Below, you'll find the most recent Virginia quarterly economic update, prepared by economist Fletcher Mangum for the Virginia Chamber Foundation. We hope you find this information useful for your business and planning purposes.
The Virginia Chamber Foundation has also recently launched the Virginia Economic Dashboard. It's an online tool we use to:
- Compare Virginia's performance with our peer states
- Drill down to progress at the local level
- Track many of these metrics over time
You can explore the Virginia Economic Dashboard here.
Thank you for your continued support of the Virginia Chamber of Commerce and the Virginia Chamber Foundation.
Barry DuVal
President & CEO
Virginia Chamber
|
|
|
In Sum
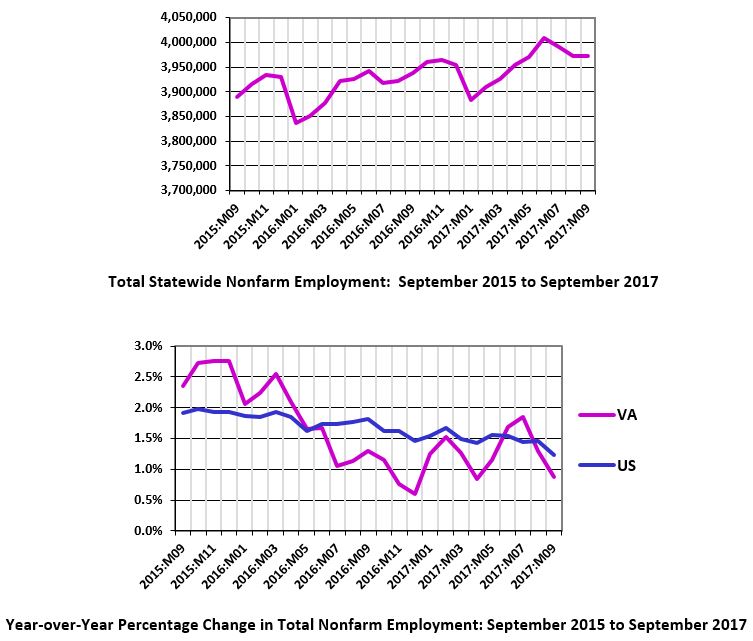
Nationally, we have been experiencing a gradual deceleration in Total Nonfarm Employment growth since February of 2015. Virginia briefly bucked that trend and rose above the national average in 2015, only to fall back below it again in 2016. However, in the first three quarters of 2017 Virginia has made progress at closing that gap. Most of that employment growth has been driven by five sectors: Education and Health Services, Financial Activities, Leisure and Hospitality, Professional and Business Services, and Transportation and Utilities. Of those five, Professional and Business Services is the one sector that continues to generally under-perform the national norm. As a result, future employment trends in Professional and Business Services will likely have a decisive impact on Virginia's ability to close the gap with national employment growth.
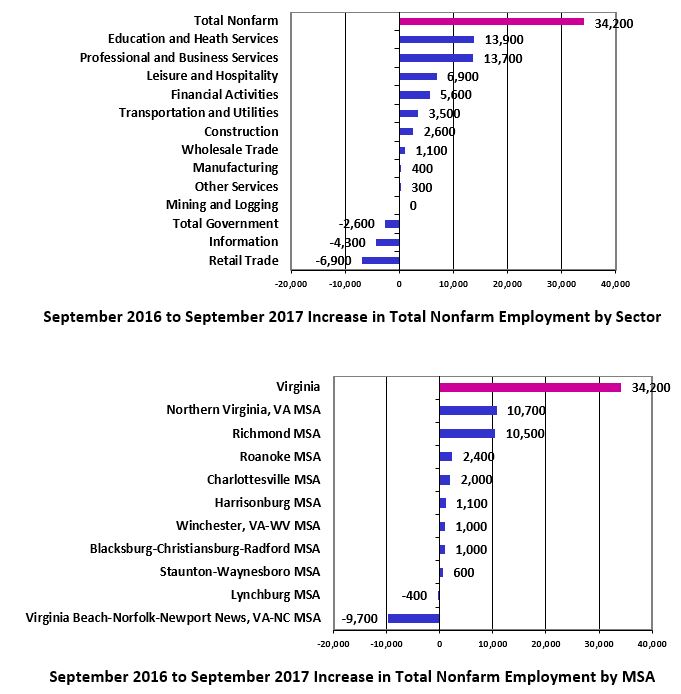
Total Nonfarm Employment in Virginia increased by 34,200 jobs, or 0.9%, between September 2016 and September 2017.
Between September 2016 and September 2017, statewide growth in Total Nonfarm Employment was led by increases in the Education and Health Services (up 13,900 jobs), Professional and Business Services (up 13,700 jobs), and Leisure and Hospitality (up 6,900 jobs) sectors. From a regional perspective, the largest job gains occurred in the Northern Virginia (up 10,700 jobs), Richmond (up 10,500 jobs), and Roanoke (up 2,400 jobs) MSAs.
Virginia's 0.9% year-over-year growth in statewide Total Nonfarm Employment in September 2017 was below the 1.2% increase posted at the national level. However, five of Virginia's thirteen major industry sectors still out-performed the national norm over the period. Those were: Education and Health Services (up 2.6% statewide vs. up 2.1% nationally); Financial Activities (up 2.8% statewide vs. up 1.8% nationally); Leisure and Hospitality (up 1.7% statewide vs. 1.2% nationally); Transportation and Utilities (up 2.7% statewide vs. up 1.9% nationally); and Wholesale Trade (up 1.0% statewide vs. up 0.9% nationally).
While on the other side of the ledger, Virginia's Construction (up 1.4% statewide vs. up 2.5% nationally); Information (down 6.3% statewide vs. down 2.8% nationally); Manufacturing (up 0.2% statewide vs. up 1.0% nationally); Mining and Logging (0.0% statewide vs. up 9.1% nationally); Other Services (up 0.1% statewide vs. up 0.9% nationally); Professional and Business Services (up 1.9% statewide vs. up 2.6% nationally); Retail Trade (down 1.7% statewide vs. down 0.4% nationally); and Total Government (down 0.4% statewide vs. up 0.2% nationally) sectors under-performed the national norm.
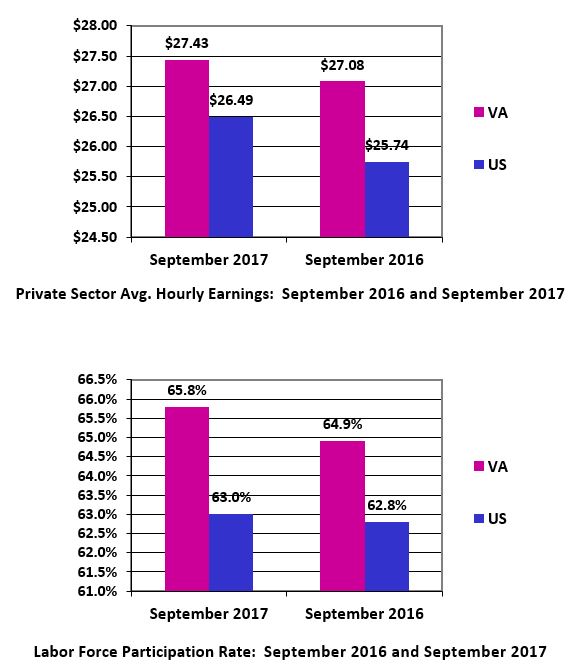
Private Sector Average Hourly Earnings in Virginia rose from $27.08 to $27.43 between September 2016 and September 2017, a nominal year-over-year increase of 1.3%, which was below the 2.9% nominal increase posted at the national level. Virginia's labor force participation rate, the proportion of the civilian population above the age of 16 that is either employed or looking for work, increased from 64.9% in September 2016 to 65.8% in June 2017. While at the national level, the labor force participation rate rose from 62.8% in September 2016 to 63.0% in September 2017.
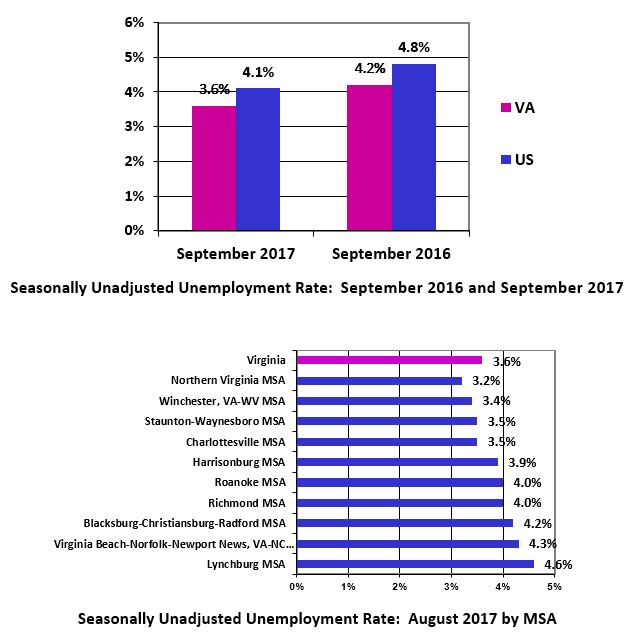
Turning to unemployment, the statewide seasonally unadjusted unemployment rate stood at 3.6% in September 2017, below the national unemployment rate of 4.1% for that month, and an improvement over the state's 4.2% unemployment rate a year before. From a regional perspective, in August 2017 (sub-state unemployment rates are reported later than the statewide rate) the seasonally unadjusted unemployment rates in Virginia's major MSAs ranged from a high of 4.6% in Lynchburg to a low of 3.2% in Northern Virginia.
What to Look For
1. Employment
:
Nationally, we have been experiencing a gradual deceleration in Total Nonfarm Employment growth since February of 2015. Virginia briefly bucked that trend and rose above the national average in 2015, only to fall back below it again in 2016. In the first three quarters of 2017, however, we have made progress at closing that gap. Statewide employment growth in the first three quarters of 2017 has been driven by five sectors: Education and Health Services, Financial Activities, Leisure and Hospitality, Professional and Business Services, and Transportation and Utilities.
Of these five sectors,
Education and Health Services and Transportation and Utilities have posted growth rates in Virginia that out-performed the national norm throughout 2015, 2016, and 2017.
Financial Activities and Leisure and Hospitality under-performed the national norm until this year, when they accelerated above it. And perhaps most importantly, with the exception of June and July of this year, statewide employment growth in
Professional and Business Services has generally under-performed the national norm since mid-2016. In combination, these trends depict a statewide economy that is potentially on track to close the gap with national employment growth. But, future statewide growth in the Professional and Business Services sector will likely play a decisive role in whether that happens or not.
It is also important to keep in mind that below average performance in several key sectors continues to place downward pressure on Virginia's overall employment trajectory. For example, if year-over-year employment growth in Virginia's Construction, Information, Manufacturing, Professional and Business Services, and Retail Trade sectors had been equal to the national average in those sectors in September 2017, Virginia would have gained 16,388 more jobs that month than it did. That means that the statewide year-over-year increase in Total Nonfarm Employment would have been 1.3%, not 0.9%, and that would have exceeded the national average of 1.2% that month.
2. Wages
: News on the wage front was mixed. Although
Private Sector Average Hourly Earnings in Virginia exceeded the national average in September 2017 ($27.43 in Virginia vs. $26.49 nationally), average hourly earnings have been growing more slowly in Virginia than the national average since May 2017 and the gap between the two increased to 1.6% in September (1.3% year-over-year growth in Virginia vs. 2.9% nationwide)
.
3. Labor Force Participation
:
Labor force participation, the proportion of the 16 and over population that is either employed or looking for work, fell precipitously during the recession both in Virginia and nationally. In Virginia, that trend began to reverse in July 2016 as the year-over-year change in labor force participation turned positive. Moreover, throughout 2017 Virginia's growth in labor force participation has continued to accelerate while the national labor force participation rate has level off. Overall, approximately 85,227 additional workers entered Virginia's labor force between September 2016 and September 2017.
4. Unemployment
:
In September 2017, Virginia's seasonally unadjusted unemployment rate was 3.6%, below the national rate of 4.1%, and down from 4.2% the year before. Moreover, that decline was driven entirely by a decrease in the number of individuals who were unemployed (down 26,560) and an increase in the number of individuals who were employed (up 105,787), relative to September 2016.
1. New and Expanding
: Virginia Economic Development Partnership announcements of new or expanding businesses in the 3rd quarter 2017:
- Statewide: 2,849 jobs and $284.3 million in direct investment.
- Blacksburg-Christiansburg-Radford MSA: 40 jobs and $4.3 million in direct investment.
- Charlottesville MSA: 31 jobs and $1.0 million in direct investment.
- Danville MSA: 50 jobs and $12.2 million in direct investment.
- Kingsport-Bristol-Bristol MSA: 28 jobs and $6.8 million in direct investment.
- Richmond MSA: 731 jobs and $26.8 million in direct investment.
- Roanoke MSA: 96 jobs and $2.8 million in direct investment.
- Staunton-Waynesboro MSA: 29 jobs and $1.0 million in direct investment.
- Virginia Beach-Norfolk-Newport News MSA: 338 jobs and $12.9 million in direct investment.
- Northern Virginia MSA: 1,351 jobs and $189.9 million in direct investment.
2. Reductions and Closures: Virginia Economic Development Partnership announcements of reductions and closures in the 3rd quarter 2017:
- Statewide: 630 jobs.
- Danville MSA: 222 jobs.
- Richmond MSA: 71 jobs.
- Virginia Beach-Norfolk-Newport News MSA: 109 jobs.
- Northern Virginia MSA: 18 jobs.
Data sources:
- U.S. Bureau of Economic Analysis
- U.S. Bureau of Labor Statistics
- Virginia Economic Development Partnership
- Virginia Employment Commission
|
|
|
|
|