Huge quantities of complex, messy, multi-dimensional data gathered from biological and human social systems, collections that lack the formal structure that might have existed had data been accumulated to examine a specific question, are challenging to analyze. And such data sets are burgeoning in multiple fields, from medical records, genomic sequencing, and neural networks in the brain and to the social networks in human life.
A story by Jennifer Ouellette in Quanta Magazine explains that today's big data is "noisy, unstructured and dynamic," sometimes corrupted and sometimes incomplete, and that a wide range of mathematical tools and techniques are needed to make sense of it. Yale mathematician Ronald Coifman asserts that we need a "big data equivalent of a Newtonian revolution, on a par with the seventeenth century invention of calculus." He believes new techniques developing in modern math will help identify and make visible the underlying structures of big data sets.
In an article in the Santa Fe New Mexican, Simon DeDeo, a research fellow in applied mathematics and complex systems at the Santa Fe Institute, suggests that the computer revolution is aiding the discovery of some universal principles hidden in massive data. For example, he says, the mathematical models that describe the conflict and cooperating in editing contentious Wikipedia entries are remarkably similar to models based on the outbreak and resolution of wars among ancient Greek city states. He and colleagues are now looking at the U.S. government shut down to determine whether that conflict can be modeled using the same math.
The Quanta story tells how DeDeo analyzed 300 years worth of data from the archives of Old Bailey, the criminal court of England and Wales. He used spreadsheets to record information from nearly 200,000 trials, which included charge, verdict and sentence, and transcripts containing 10 million words. Using text recognition, he sifted through the words, grouping them unto 1,000 categories. "Now you've turned the trial into a 1,000 dimensional space that tells you how much the trial is about friendship, or trust, or clothing," he told Quanta.
In his New Mexican article, DeDeo writes that he and collaborators saw ideals of modern justice and fairness evolving from a harsh medieval world. In the 1600s, he writes, "incorrigible pickpockets" were sentenced to die; in the 1700s people convicted of violent and nonviolent crimes met similar fates and were described in similar language. Over the next 150 years, data shows growing recognition that murder and rape differ from petty theft and fraud and should be treated differently, a dramatically important social shift.
Gunnar Carlsson, a mathematician at Stanford University, studies cumbersome complex data using
topological data analysis (TDA). Carlsson says TDA is a way of getting structured data out of unstructured data, so that
machine learning, a set of techniques to construct and study systems that can learn from data, will work on it. Watch Carlsson's short
YouTube lecture. The seeds of TDA and modern network theory go back to the
Seven Bridges of Konigsberg, a math problem popular in the eighteenth century, Ouellette writes. The challenge asks whether a person can travel to and from each of four separate land areas, crossing each of seven connecting bridges only once. The
mathematician Leonhard Euler realized distances and positions didn't matter, but the number of land masses-the nodes-and how the bridges connected them-the links or edges-did.
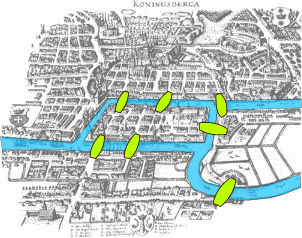 |
| Map of Konigsberg in Euler's time showing the actual layout of the seven bridges, highlighting the river Pregel. Wikipedia |
Carlsson says huge, raw data sets with many dimensions can be mathematically compressed into lower-dimension structures that show primary regions and how they are connected.
Carlsson developed technology, which he offers through his company Ayasdi that can produce maps visualizing compressed representations of huge data sets. For instance, the Quanta story says, data from a breast cancer study was initially recorded on spreadsheets with 1,500 columns and 272 rows representing differing genomic samples from patients. When the data was transformed by TDA into a network, the map took the shape of a Y. Patients who died were clustered on the left branch, and a smaller number who survived were on the right branch, allowing geneticists to study factors that influence survival. Read the Quanta story here and DeDeo's article here. Read Ouellette's Quanta piece on quantum computers, machine learning and big data, in Wired Magazine, here.