|
Your weekly 5-minute guide to the data and economic news shaping Southern Nevada and the world.
In this week's newsletter:
- Nevada’s State Budget
- 1st Quarter U.S. GDP
- Import Volumes
- Statistic of the Week
- What We Are Watching
- Tariff Tracker
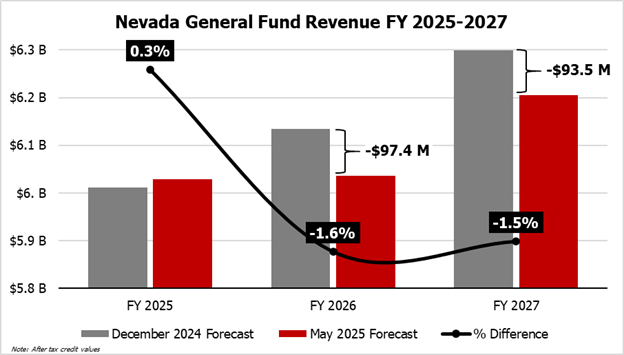
| | The decline in state general fund revenue from the prior estimate for the next two fiscal years | | Graphic Source: UNLV Center for Business and Economic Research | | |
With less than one month remaining in the 83rd Legislative Session, Nevada state legislators and executive branch agencies are facing urgent pressure to recalibrate in response to a significant budget decrease for the upcoming biennium. The Nevada Economic Forum, a panel of five private sector economists and tax experts, is tasked with producing general-fund tax revenue projections that lawmakers and the governor must use when setting spending levels for the next two fiscal years, which begin in July and end in June of the following year). Lawmakers are constitutionally required to pass a balanced budget by the end of the session, meaning proposed expenditures cannot exceed the Forum’s approved revenue forecast.
Prior to their May 1st meeting, the Economic Forum last met in December 2024, prior to the start of the 120-day Legislative Session, where they approved a $12.4 billion budget for the next biennium, $6.1 billion for FY 2026 and $6.3 billion for FY 2027 *(This is the amount after tax credits the Legislature may approve during the legislative session). At its May 1 meeting, however, the Forum revised its forecast downward, approving a $12.2 billion budget, representing a $190.9 million or 1.6 percent reduction from the December projection. The FY 2026 budget was reduced by $97.4 million and FY 2027 by $93.5 million. This marks the first mid-session budget downgrade since 2009.
Economists attributed the shortfall primarily to weaker sales tax revenue projections, which makes up approximately 30 percent of the general fund. Dampening consumer sentiment, higher than anticipated inflation, and slower wage growth have curbed discretionary spending, leading to reduced taxable sales. Gaming revenues are also expected to decline significantly, decreasing 5.6 percent YoY in FY 2026 but partially rebounding 2.2 percent YoY in FY 2027. For context, gaming revenues increased 40.7 percent YoY in FY 2022, but has been plateauing since.
These state-level budget decreases coincide with the possibility of major federal funding cuts later in the year. President Trump has proposed $163 billion in reductions to federal programs that support state education, healthcare, housing, and many other programs. Congress is working its way through a budget package which from its outline would continue and expand tax cuts while reducing the amount of aid provided to states for programs like Medicaid. The Guinn Center has found that 27.7 percent of Nevada’s overall budget is sourced from federal funding, compared to 20.5 percent which comes from the state general fund (the proportion lawmakers allocate every session). The confluence of potential cuts leaves Nevada’s public programs, including education, healthcare (Medicaid), and supportive services, in a precarious position for the next few fiscal years as the state and nation continue to navigate economic uncertainty.
Legislative Council Bureau (LCB) 1, LCB 2, Nevada Independent, New York Times, Guinn Center
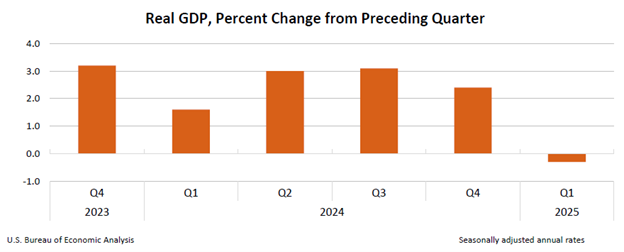
| | The annual decline in real GDP in the 1st quarter of 2025 | | |
Advanced estimates found that U.S. real Gross Domestic Product (GDP) decreased by 0.3 percent annually in the first quarter of 2025. For comparison, real GDP increased by 2.4 percent in the fourth quarter of 2024. Much of the decrease in the first quarter relates to an increase in imports and a decrease in government spending. Increased imports, which are a subtraction from GDP, led to a decrease in real GDP of around five percentage points. This decrease was partly offset by increases in business investment and exports. Real final sales to private domestic purchasers, which is the sum of consumer spending and gross private fixed investment, increased by 3.0 percent compared to 2.9 percent in the previous quarter. As real GDP decreased, at the same time inflation rose. The price index for gross domestic purchasers grew by 3.4 percent, up from an increase of 2.4 percent last quarter. Excluding food and energy prices, PCE increased 3.4 percent, up from a rise of 2.6 percent in the fourth quarter.
The decrease in real GDP undershot expectations, as Dow Jones estimates projected a gain of 0.4 percent. In the days before the GDP release, however, some Wall Street economists changed their predictions to negative growth due to unexpected surges in imports as companies prepared for tariff policy implementations. In the first quarter, imports surged 41.3 percent, driven by a 50.9 percent increase in goods, increasing the trade deficit (imports minus exports) in goods by $464.4 billion (The U.S. runs a surplus in the trade of services) Outside of the pandemic, this has been the biggest growth in imports since 1974.
Within Nevada, real GDP in the fourth quarter of 2024 grew by 2.4 percent annually and 1.9 percent quarterly. On the other hand, the first quarter of 2025 yielded negative economic signals in Nevada. In March, gaming revenue was down by 1.1 percent and air passengers fell by 3.3 percent from the previous year. The unemployment rate in March was up by 0.4 percentage points year-over-year. Job hires remain robust in some sectors, such as government and healthcare, but other sectors that are more sensitive to the business cycle, like transportation and warehousing, are weakening. This could indicate that the local economy is facing similar economic headwinds as the national economic outlook.
U.S. Bureau of Economic Analysis (BEA) 1, CNBC, U.S. BEA 2, UNLV Center for Business and Economic Research, Bloomberg, DETR
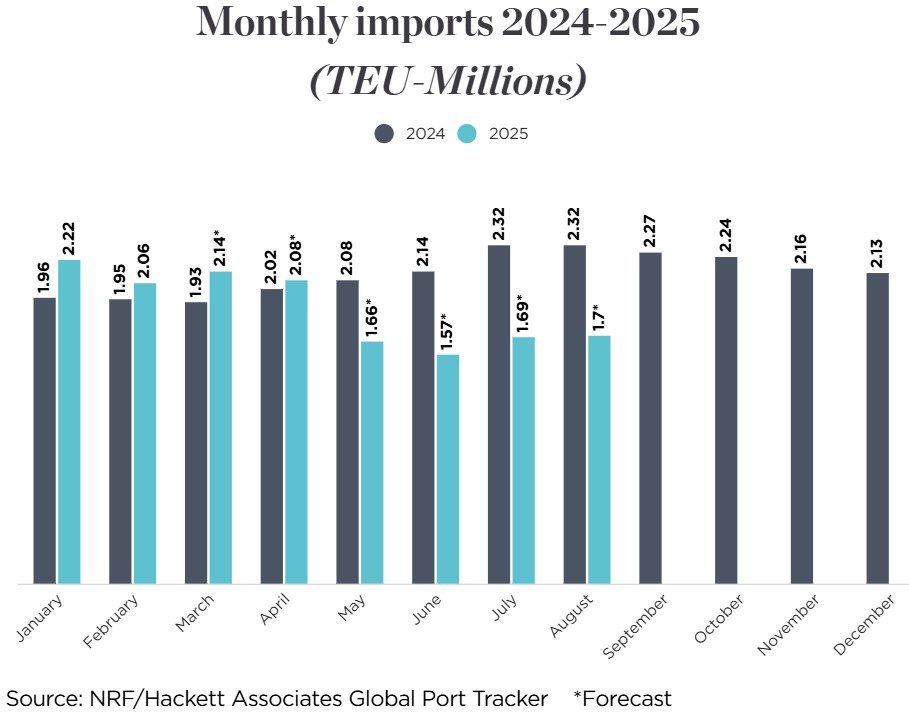
| | The projected decreased in shipping container import volumes for the remainder of 2025 | | |
Retailers throughout the country and in Nevada are preparing for significant supply-chain challenges as new tariffs disrupt global shipping. Many U.S. retailers have started to pause or cancel orders as the costs rise, and the effects are expected to hit Nevada’s retail and construction sectors in the upcoming weeks. The National Retail Federation’s Global Port Tracker predicts that U.S. containerized imports will decline by approximately 20 percent year-over-year (YoY) in the second half of 2025. By month, imports are forecasted to drop sharply starting in May at 20.5 percent YoY, followed by drops of over 26 percent YoY in June, July, and August.
Globally, the overall container shipping volume is forecast to contract by one percent in 2025, marking only the third decline since 1979. Analysts expect that the U.S. imports from China will fall by as much as 40 percent, if the tariffs remain at the current levels. Shipping disruptions are already visible, with some carriers reporting that 30 percent of shipments from China to the U.S. have been canceled.
The Ports of Los Angeles and Long Beach are vital hubs for Nevada’s inbound goods, serving as the state’s primary gateway for imports as well as the U.S. Mexico border in California. The I-15 corridor also serves as one of the nation’s busiest truck shipping routes for goods coming or going to ports in Southern California or Mexico. Although specific data on Nevada’s imports is limited, approximately 45 percent of the Port of Los Angeles’ overall container business consists of imports from China, underscoring its role in the broader West Coast supply chain. The Port of Los Angeles expects cargo volume to fall by more than 35 percent next week compared to the same time last year, a decline driven primarily by reduced shipments from China as retailers react to escalating tariffs. While some suppliers are transferring to other countries in Southeast Asia, the shipping volume is still projected to remain relatively low in the near term. Retailers currently rely on the existing inventories, but the supply gaps and price increases are being anticipated as stockpiles shrink over the next five to seven weeks.
Locally, Nevada retailers have already started to feel the effects. Regional chains such as RC Willey Home Furnishings, which has locations across Nevada and neighboring states, have stopped placing new orders from China. Although some of the sourcing has started to shift to other countries like Vietnam, these adjustments are not necessarily immediate fixes and have added more logistical complexity and higher costs and are still subject to reciprocal tariffs. We could see reduced product variety and higher prices at retail stores across Nevada, even as the situation continues to evolve.
Reuters, CNBC, National Retail Federation
| | |
Statistic of the Week
52.6 percent - the premium that organic fruits and vegetables cost over conventional produce. The organic price gap is widest for iceberg lettuce (+$2.17; 179.3 percent), brussels sprouts (+$2.79; 126.8 percent), and Granny Smith Apples (+$2.38; 123.3 percent) while some organic products actually cost less than their conventional counterparts, such as blueberries (-$0.83; -16.2 percent) and green onions (-$0.43; -38.4 percent).
California leads the nation in organic production and sales, generating 39 percent of total U.S. organic products and selling $3.7 billion worth of organic fruits and vegetables. In comparison, organic farms in Nevada sold $67 million worth of organic fruits and vegetables for the same year. The potential price increase from tariffs, however, could bring the grocery store staples between conventional and organic into price parity. While half of conventional fruits and one third of conventional vegetables are imported, only five percent of organic produce comes from abroad. Tariffs are projected to raise prices for vegetables, fruits, and nuts by an average of 4.0 percent, with imported products set to jump 10.1 percent, compared to just 1.3 percent for domestically produced items.
Lending Tree, Marketplace, United States Department of Agriculture (USDA) 1, USDA 2, The Budget Lab at Yale
| | What We Are Watching This Week | | |
Tuesday
The U.S. Bureau of Economic Analysis (BEA) will release data on the U.S. international trade deficit for March 2025. In February 2025, the trade deficit narrowed to $122.7 billion, a 6.1 percent decrease month-over-month (MoM) but 76.9 percent increase YoY. The January deficit was slightly revised from $131.4 billion to $130.7 billion. Imports totaled $401.1 billion in February, remaining stagnant from the prior month, while exports rose 2.9 percent MoM to $278.5 billion. The largest gains in U.S. exports were in industrial supplies and materials ($3.0 billion), capital goods (including computers and civilian aircrafts) ($2.7 billion), and automotive vehicles and parts ($1.6 billion).
Wednesday
The Federal Open Market Committee (FOMC) will convene for the third time in 2025. The Committee maintained its target range of 4.25-4.5 percent for the federal funds rate during their March meeting. Economists predict the FOMC to maintain the current rates again as they wait for more 2025 data to become available, but may signal potential cuts at their subsequent meetings over the summer. Balancing the Fed’s dual mandate of maximum employment and price stability requires careful assessment of ongoing inflation and labor market trends.
The Federal Reserve will release the Consumer Credit G.19 report for March 2025. These data are important indicators of consumer spending, tracking revolving (primarily credit cards) and nonrevolving credit (such as student or auto loans) taken on by individuals. In February, total consumer credit unexpectedly dropped by $810 million or 0.2 percent YoY, substantially under the projected $15.2 billion increase. Revolving credit rose slightly by 0.1 percent or $128 million while nonrevolving credit decreased by 0.3 percent to $938 million. This sharp pullback comes just months after a total consumer credit spike of 6.4 percent YoY in December 2024.
Thursday
The U.S. Bureau of Labor Statistics (BLS) will release the preliminary Productivity and Costs data for 2025Q1. Productivity data are useful when forecasting changes in prices, wages, and technology. In 2024Q4, productivity (output per hour worked) increased by 1.5 percent quarter-over-quarter (QoQ) in 2024Q4 and 2.0 percent YoY. This marks a continued slowdown, however, from the three-year high of 3.3 percent YoY observed in Q1 2024. Unit labor costs for all nonfarm workers increased by 2.2 percent in 2024Q4, a 2.0 percent YoY increase.
| | |
Love the newsletter? Want to share an article or offer feedback? Send us an email: Cber@UNLV.edu
Or if you would like to share this newsletter on your favorite social media platform, use the links below.
| |
UNLV Center for Business and Economic Research Website
| | | | | |