|
One Cool Tip Newsletter
September 6, 2026
| Your daily dose of tech-savvy brilliance! | |
😀Greetings! Happy Sunday, Cool Tipper!
Get ready to streamline your digital life with simple, actionable tips delivered straight to your inbox.
Cool Tip Theme: Gemini Notebook Infographics
Transform dense notes, PDFs, and docs into clean visual infographics using Gemini Notebook. Follow our simple guide to create, customize, and export.
New here? Subscribe to the One Cool Tip Newsletter for daily updates. It's FREE!
| |
3️⃣
If you enjoy the One Cool Tip newsletter, please forward this newsletter to THREE friends or colleagues or share it on social media using the links below.
Leave a $$$ Tip!
Share this One Cool Tip Newsletter!
| | |
🚨A Sweet Treat, But a Serious Reminder About Data Security🚨
News of a reported data breach involving See's Candies serves as an important reminder that any company holding personal information can become a target for cybercriminals.
The incident may have involved customer and employee data, potentially increasing the risk of identity theft, fraud, and phishing scams for affected individuals.
If you receive a data breach notification from any company (pdf), don't ignore it.
Review the notice carefully, change passwords on affected accounts, enable multi-factor authentication, and monitor your bank accounts and credit reports for suspicious activity.
It's also a good idea to be extra cautious of unexpected emails, texts, or phone calls that reference the breach.
Taking a few proactive steps now can help protect you from bigger problems later.
And in Other News...
- AI Is Smart, But Don't Let It Be Your Only Guide
Artificial intelligence can be a helpful tool for research and planning, but it should never be your only source for important decisions.
A recent rescue incident involving hikers who relied heavily on an AI chatbot for route planning and packing advice highlights the risks of trusting AI without verification.
Authorities said the hikers were reportedly advised to bring less food and water than they ultimately needed, contributing to a dangerous situation that required a rescue.
Whether you're planning a trip, making a financial decision, or tackling a home project, use AI as a starting point, not the final authority.
Always verify recommendations with official sources, local experts, or trusted professionals.
The best results often come from combining the convenience of AI with real-world expertise and common sense.
| |
| 🤔 How would you use Gemini Notebook Infographics most in your daily routine? | | | | |
Help support One Cool Tip. Use this Amazon link when you shop online.
Check out these Cool Deals:
| | |
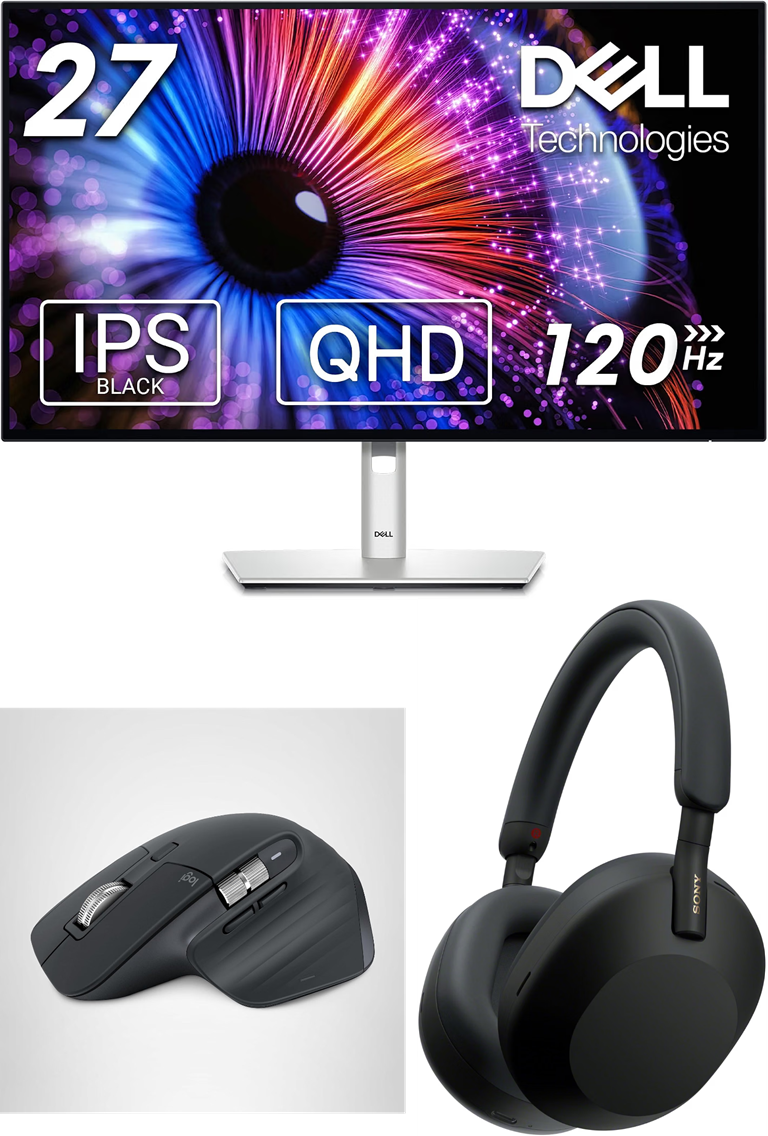
🖥️ Dell UltraSharp 27 4K USB-C Hub Monitor (U2724DE): Provides sharp text and color clarity when reviewing detailed visual graphics and research documents.
Look👉. Now $499. 4.4 Stars. Check it out on Amazon!
🖱️ Logitech MX Master 3S Wireless Mouse: Features an ergonomic thumb wheel and precision sensor that make panning through high-resolution infographics effortless.
Save 10%. Now $89.99. 4.5 Stars. Check it out on Amazon!
🎧 Sony WH-1000XM5 Wireless Noise-Canceling Headphones: Top-tier active noise cancellation to help you focus during deep research and note-taking sessions.
Save 50%. Now $198. 4.2 Stars. Check it out on Amazon!
*Prices accurate when originally published.
One Cool Tip may earn a commission from qualifying purchases.
| | |
Turn Complex Research Into Visual Summaries With Gemini Notebook Infographics
Gemini Notebook now converts pages of dry research notes into structured, visual graphics in a couple of clicks. Here is how you can use the built-in Studio tools to customize, generate, and share presentation-ready visual summaries.
Sifting through multi-page research reports, project briefs, and technical PDFs often leaves you with pages of text that team members or clients simply skim past.
While summary bullet points help, visual information captures attention faster and helps ideas stick.
Here’s a Cool Tip: Use the customization pencil in Gemini Notebook’s Studio panel to set your orientation and visual style before generating your visual summary.
Google has added an automated visual generation engine directly inside Gemini Notebook.
Instead of manually copying data points into graphic design templates, you can turn your uploaded research sources into a complete visual poster with customized layouts, styles, and color schemes.
Feature Explanation
Gemini Notebook Infographics is an AI-powered visual synthesis tool housed inside the application's Studio panel.
It reads all active documents, transcripts, notes, and web sources in your notebook, extracts the central relationships and core statistics, and composes a unified visual summary.
The tool operates asynchronously in the background.
While the engine formats graphics, labels data points, and arranges layout blocks, you can continue typing questions, reviewing citations, or organizing sources.
Users can fine-tune outputs across four parameters before running the generator:
-
Detail Level: Choose between Concise, Standard, or Detailed (beta) depending on whether you need high-level takeaways or granular data points.
-
Orientation: Pick Square, Portrait, or Landscape to fit mobile feeds, slide decks, or printed handouts.
-
Visual Style: Choose between presets such as Professional, Sketch Note, Kawaii, or let the system auto-select an aesthetic.
-
Custom Prompting: Add natural-language instructions to dictate specific color palettes, prioritize specific metrics, or focus on a particular source document.
Once completed, the asset opens in an expanded viewer where you can zoom into details, review the original prompt, download a high-resolution PNG image, or copy a direct web link.
What You'll Gain
- Save time by skipping manual slide layout and graphic template building.
- Improve retention by converting dense technical data into scannable visual structures.
- Communicate clearly with clients, students, or team members who prefer visual executive briefs.
- Maintain flexibility by generating square, portrait, or landscape formats for presentations and reports.
Step-by-Step Instructions
Here's how to do it.
To generate or delete an infographic, you must have edit access to the notebook and be at least 18 years of age.
Web / Desktop Browser:
-
Open your browser and go to your Gemini Notebook workspace.
-
Select an existing notebook containing your sources, or click New Notebook and upload your reference documents (PDFs, Docs, web links, or text notes).
-
Look at the right-hand sidebar to locate the Studio panel.
-
Locate the Infographic card. Click the Pencil icon (Customize) to open the preferences pane before creating the image.
-
Select your desired Output language, choose your Level of detail (Concise, Standard, or Detailed), and set your Orientation (Square, Portrait, or Landscape).
-
Pick a Visual style (such as Professional or Sketch Note), or leave it set to auto-select.
-
Enter any specific guidance into the custom prompt field (for example: "Focus on the third quarter revenue trends and use a clean navy blue color scheme").
-
Click Generate. The engine will process the request in the background, allowing you to keep browsing your notebook.
-
When generation finishes, click the title of your new infographic in the Studio panel to open the full-screen viewer.
-
Click the Three dots menu in the top corner of the viewer and select Download to save the infographic as a high-resolution PNG file to your computer.
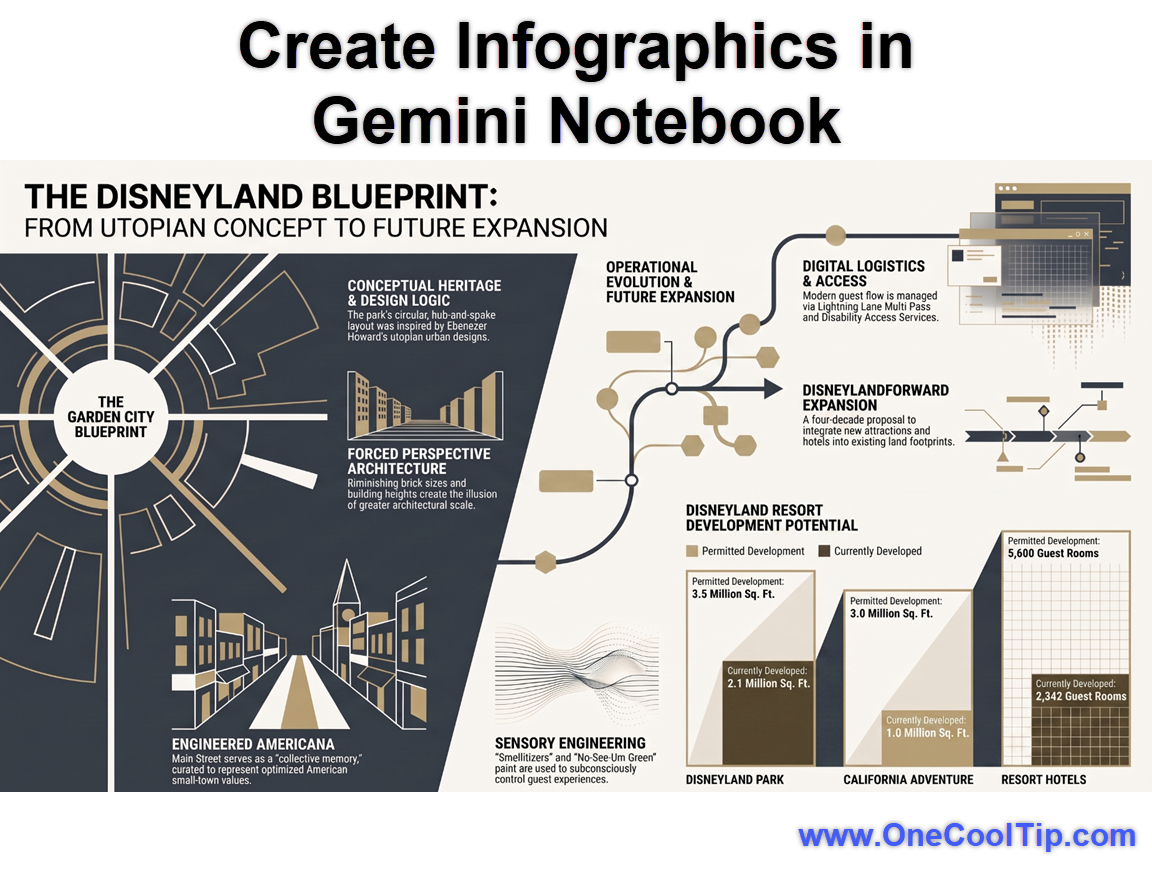
| | fig. 1 - Create Infographics in Gemini Notebook | | |
iPhone, iPad, and Android:
-
Launch the Gemini Notebook mobile app on your device. (iOS / Android)
-
Tap on the notebook you want to summarize.
-
Switch to the Studio tab at the bottom or side of the screen.
-
Tap Infographic (or tap the customization icon if you want to set orientation and detail levels).
-
Tap Generate and allow the background task to complete.
-
Tap the generated item to review it in the viewer, then tap the Share or Download action to export.
(Note: Interface layouts and options in mobile versions may differ slightly from the desktop web experience based on app updates).
Windows and macOS Native Desktop:
- Not currently available as standalone native desktop client applications.
- Access the feature via any supported desktop web browser at the official Gemini Notebook portal.
Pros and Cons
Pros:
-
Background generation: You do not have to wait on a loading screen; you can review notes and draft prompts while the graphic builds.
-
Flexible aspect ratios: Square, portrait, and landscape options make it simple to adapt visuals for social feeds, reports, or widescreen presentations.
-
Grounded in your sources: The engine synthesizes facts directly from your uploaded source material rather than generating ungrounded clip art.
-
Clean export options: Easy direct PNG downloads make sharing across Slack, email, or pitch decks straightforward.
Cons:
-
Age requirement: The feature is strictly limited to user accounts verified as age 18 and older.
-
Potential text distortion: As with all generative visual models, occasional spelling artifacts, minor label misalignments, or numeric hallucinations can occur.
-
Ebook download restrictions: If your notebook references certain Google Play Books titles, publisher restrictions can disable artifact exports.
-
Enterprise sharing boundaries: Workspace Education and Enterprise accounts cannot generate public view-only links.
Feature Access
-
Rollout Status: Generally available to consumer accounts; active in Gemini Notebook.
-
Age Requirement: Strictly 18+.
-
Platform Availability: Web browsers (desktop/laptop) and Gemini Notebook mobile apps for Android and iOS.
-
Tier Availability: Available across standard free consumer access, with higher operational volume tiers supported under Google AI Plus, Pro, and Ultra plans.
-
Workspace Availability: Supported in Workspace Business and Enterprise tiers, though public link distribution is disabled by design.
Score
Criterion | Score (0–10) | Justification
Value | 8
Turns dense research into clean visual summaries within minutes, solving the friction of manual layout design.
Usability | 8
The Studio pane workflow is intuitive, and the pencil customization drawer makes setting orientations easy.
Wow Factor | 8
Generating a coherent, styled infographic from raw source text feels remarkably modern and practical.
Total: 24/30 | 👍 Good
A practical time-saver for anyone who needs to package research findings into visual formats without opening a graphic editor. While Canva provides deeper pixel-level typography control, Gemini Notebook builds the layout and summarizes the core data in a single automated step.
Key Takeaways
Gemini Notebook can now synthesize multi-source documents into full-color, structured visual infographics.
You can customize the orientation, detail level, visual style, and color instructions before hitting the generate button.
The feature runs in the background and exports high-resolution PNG images ready for slides, social posts, or reports.
Cool Tip Snapshot
-
Feature Name: Gemini Notebook Infographics.
-
Platform(s): Web, Android, iOS.
-
Quick Benefit: Instant visual summaries generated directly from research notes and uploaded documents.
-
Best For: Researchers, students, project managers, and content creators.
-
Access Type: Free with standard limits; enhanced limits on paid Google AI tiers.
-
Difficulty: Easy.
Try It Yourself
Open your favorite research notebook in Gemini Notebook today and try generating your first visual summary using the Studio panel. Did the layout capture your key points?
Drop your thoughts in the comments, subscribe to the One Cool Tip newsletter for regular productivity advice, and share this Cool Tip with colleagues who want to spend less time building presentation graphics.
READ MORE
Read the Full Cool Tip.
| | |
Lost Like Robinson
https://www.rjmansfieldmusic.com/2026/09/lost-like-robinson.html
“Lost Like Robinson” is an original song about the loneliness of losing someone you still love and the hope that somehow they might find their way back to you.
I wrote this song around the image of being stranded like Robinson Crusoe, surrounded by memories and sending signals into the distance, hoping someone is still watching.
The lyrics turn heartbreak into an emotional island, where old photographs become sunrises, miles feel like oceans, and every wave brings the past back to shore.
At its heart, it’s a song about refusing to give up on a love that still feels worth saving, even when you’re not sure anyone can hear you calling.
If you’ve ever felt lost without someone or kept a light burning for a love you couldn’t quite let go, I hope this song speaks to you.
I’d love to hear what “Lost Like Robinson” means to you in the comments.
Thank you for listening and supporting my music.
| | |
Check Out These Cool Tips & Tricks
-
Customize First: Fine-tune your visual orientation and style presets before clicking generate. Click the pencil icon on the Infographic card inside the Studio panel to set your parameters.
-
Prompt Specific Colors: Dictate your brand or team colors directly within the generator. Enter a custom prompt such as "Use an emerald green and charcoal palette" into the customization panel.
-
Vary Detail Levels: Adjust how much information appears on your final poster. Toggle between Concise, Standard, or Detailed in the preferences menu to match your audience.
-
Recall Old Prompts: Check the exact instructions used to generate an earlier visual. Select the three dots menu next to the title in the Studio panel and click "View custom prompt".
-
Export PNG Directly: Save visual files locally for reports and decks. Open the graphic in the viewer, click the three dots, and choose Download.
-
Work in Background: Continue reading and querying sources while visuals render. Click generate and navigate away to other notebook notes without interrupting the build.
-
Select Source Focus: Steer the visual toward specific documents in your project. Specify the exact title of your uploaded PDF in the custom prompt instructions.
-
Share Direct Links: Distribute visual summaries quickly to personal Google account holders. Click Share in the expanded viewer and copy the link after setting notebook access to full view.
-
Zoom to Inspect: Check small typography and labels carefully before exporting. Use the magnifying glass controls in the expanded viewer to inspect all text elements.
-
Submit Output Feedback: Help improve subsequent model rendering quality. Click the "Good content" or "Bad content" buttons inside the viewer to log performance feedback.
| | ICYMI - In Case You Missed It ... | | | | |
Make Your iPhone Read the Screen Aloud
Apple’s VoiceOver screen reader can describe buttons, messages, webpages, notifications, and other content displayed on your iPhone. It is an essential accessibility tool for people who are blind or have low vision, but it is also useful for developers, caregivers, and anyone interested in accessible technology.
Read the Full Version.
Read the Newsletter Version.
| | |
Tomorrow's Cool Tip is waiting to amaze you.
Until then, go forth and conquer the tech world with your newfound knowledge!
Be sure to visit www.OneCoolTip.com for Cool Tech Tips for a Cooler Life!
And if you Like One Cool Tip, please support with TipJar!
Enjoy!
Rodger
Chief Cool Tipper
onecooltip.com@gmail.com
| |
| What do you think of today's OneCoolTip newsletter?
| | | | Connect with One Cool Tip!! | | |
|
As an Amazon Associate, One Cool Tip may earn a small commission from qualifying purchases.
Our media content is intended solely for informational purposes only. Please do not construe anything here as legal, tax, investment, financial, marital or other advice.
Copyright © 2026 | www.OneCoolTip.com | All Rights Reserved
|
| | | |