|
Graham Gilchrist, PAg
Biological Carbon Canada
Borrowing from the Canadian TV show Letterkenny, but I was interacting with Farming Forward the other day….
We started to talk about how the emissions for the ag sector in Canada have a new report. The industry sector is part of Canada's full 2023 National Inventory Report on GHG emissions. I have added pictures below to help illustrate what we talked about.
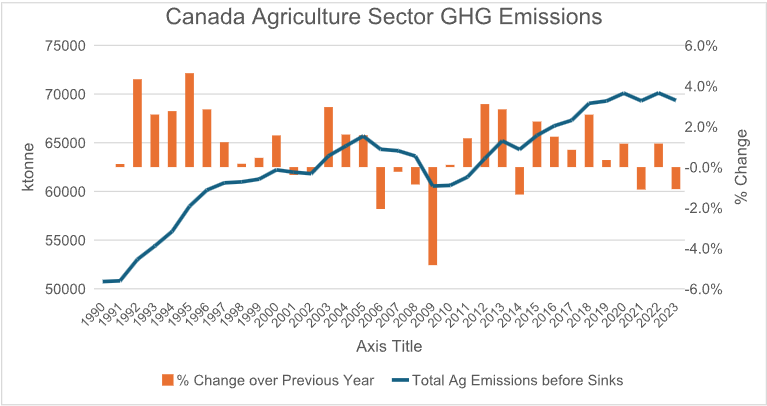
The report starts in 1990 and goes all the way through to the year 2023. Our total emissions, which include fuel use, our livestock sector, and our cropping sector, including fertilizer use and burning crops, started at just over 50,000 kilotonnes. By the time we get to 2023, we are just under 70,000 kilotonnes.
What's interesting in the graph? The annual change is not consistent. Between 1990 and 2000, our yearly growth ranged from a high of almost 5%, and there were a couple of years when we were just above 0%. Then, between 2001 and 2014, we experienced annual increases and decreases. Then, finally, starting in 2015, we had several years that were as high as the 3% change.
The point of all this is that the annual change in our emissions across the ag sector is that we are not consistent.
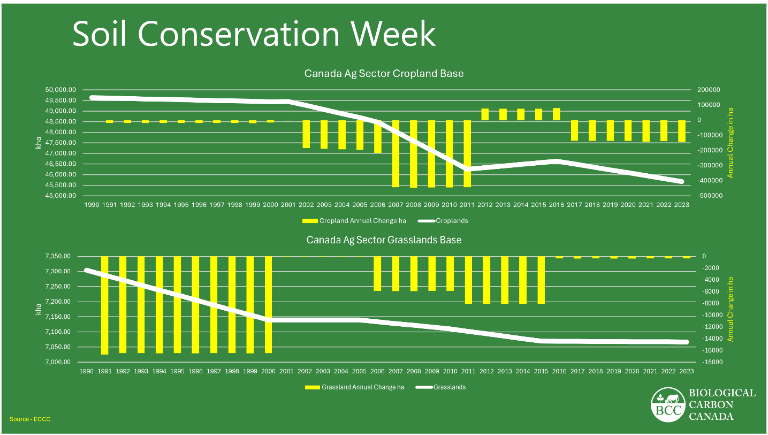
I will focus on the sink side since that was certainly one of the questions we got at the gathering in Evansburg. As you may know, our ag landscape is shrinking. For our grassland base, Canada had just over 7.3 million hectares in 1990, and we are now just over 7,000,000 hectares.
For our cropping sector across Canada, we were just over 49.5 million hectares back in 1990, and we are down very close now to 45.5 million hectares. So every time we lose land out of the system, there is a corresponding emissions factor, but more importantly, that annual change in our sink means we have less land in total to counter the annual emissions coming out of our ag operations.
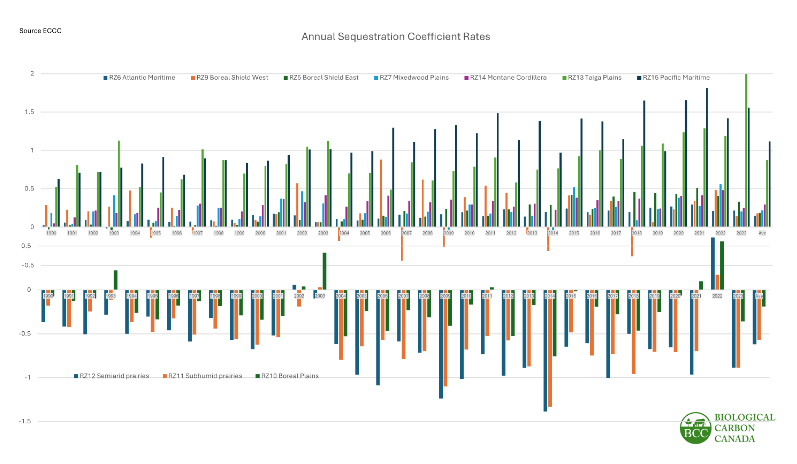
Now, let's add more complexity. Inside the National Inventory Report, we can see the coefficients used annually for different soils across Canada. Only three of the soil zones, mainly in Western Canada, had a negative coefficient. That means those farming practices on those soils sequestered carbon. But the coefficient wasn't consistent. There were seven zones in the rest of Canada that consistently had a positive coefficient. That positive coefficient means that the farming practices emit greenhouse gases from the soils.
So what does this all mean? As an Alberta producer trying to figure out your annual change in a footprint for your farm, you can use our calculator to help you do that. The new one is now up on the website.
Your emissions, from your fuels, from your animals, from your cropping systems need to be unique. For the most part, our calculator does a good job. You add in what you consume.
The bottom number is harder. We must publish a new calculator yearly as the soil coefficients change annually.
I might suggest that you start a soil survey across your farm so you can actually see the changes in soil organic matter and bulk density. Use your data.
And as promised. Here are the graphs.
|