|
|
Internal Only
May 23, 2023
|
|
Internal VTU Health Dashboard |
|
The VTU Health Dashboard in Tableau can now be used for your Reveal customers in the US and Canada. This internal dashboard makes it easier for GCS and Solutions Architects to proactively monitor the equipment health of a customer's fleet for the following devices:
- Asset Tracker - Powered Asset Tracker, Non Powered Asset Tracker
- Vehicle Tracker - Xirgo, CalAmp, VDD
This Dashboard displays percentage of units with:
- Excessive Towing
- GPS Signal Strength
- Non-Reporting Units
- Latent Plots
- No Movement
Device health is crucial to ensure that units are reporting properly without degradation in GPS plotting frequency and to maintain connectivity. This will also reduce the turnaround time on cases requiring investigation, and make it easier to proactively resolve issues.
This dashboard was successfully rolled out for the Charter account last year and will now be a useful support tool to help meet our device health goals.
Check out the new Dashboard in Tableau today!
|
|
What employees are saying |
|
For the past two months several employees have been testing the VTU Health Dashboard in Tableau. |
|
Christina Blas and the Government Implementation team are excited about the ability to review a customer's account in a more readable format with graphs.
Christina says they have used the dashboard to:
- Easily review device issues
- Provide more information with the raw data export
- To access overall fleet health during an active deployment for large customers
|
|
Tyler Piacella and Enterprise Customer Success Managers are thrilled that they can now provide their customers with the full view of how their units are performing.
Tyler has used the dashboard to:
- Easily identify non reporting units and their total percentage in the fleet
- Recognize units that have not been installed or checked in
- The towing events have been a major help in identifying potential reporting issues
- Quickly locate the current Xirgo configuration on the device
-
Export info that is unobtainable in Fleetcare
|
|
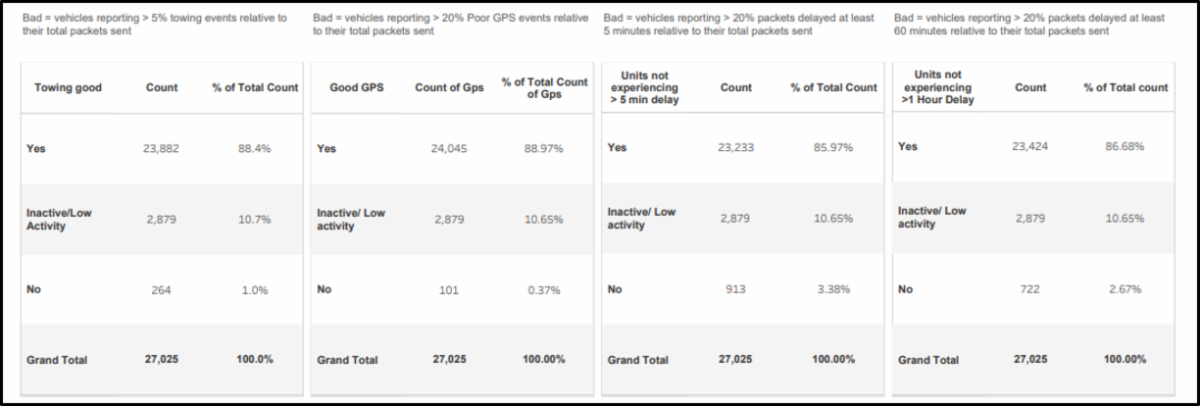
The Device Health KPIs represent how well the vehicle's reporting is doing overall.
Categorically, this is how reporting is defined as “degraded”:
-
Towing events: >5% of the total packets reported by the vehicle are Towing Events
-
Poor GPS: >20% of the total packets reported by the vehicle are identified to be Poor GPS, meaning there is a reduced accuracy in the data
- Latent plots:
- >20% of the packets reported by the vehicle are delayed at least 5 Minutes
- >20% of the packets reported by the vehicle are delayed at least 60 Minutes
|
|
The VTU Health Dashboard provides beneficial views into additional data. Here is what you gain from these additional views:
-
Vehicle Geo Location View provides many filtering options to see the right data on a map, including: Unit Status by NRU,Diagnostic Codes and No Movement
-
VTU Health Historical Reporting View makes it easier to identify trends
-
VTU Health Status Comparison View compares results from two different report dates
-
VTU Health Raw Data View provides additional details that makes device level troubleshooting easier
|
|
To access the Dashboard views, click on the Tableau Okta Tile, go to Cross-Platform Reporting: Hardware & Installations, select VTU Health Dashboard and explore all the views.
If you do not have access to Tableau, please follow the below steps:
-
On AccessHub, select Tableau VZConnect360
- After adding to the cart, click on checkout
-
In the list of "Available Tableau VZConnect360 Groups," please add VZC.TABLEAU.VZCONNECT360.DATAPRODUCT.READ
- Then click Next
- In the last Step, please provide the business justification for the access request
- Submit the request
Once the request is submitted, the Approval email will be sent to the line manager. Access will be provided after the approval. When you receive the approval notification, you will see an OKTA tile for Tableau VZConnect 360. Please test the access, and in case of any issue please reach out to the #tableau_support Slack channel.
|
|
We will add even more capabilities to the Dashboard in the future:
- Expand rollout to more teams i.e. Tier 1, EMEA, APAC
- Camera KPIs including Non Reporting Unis and excessive Harsh Driving Events
- Fleet - Dashboard for our Fleet devices capturing Non Reporting Units, latent plots, GPS signal strength and other KPIs
|
|
Q: Do I need training to use this Dashboard?
- A: No, this dashboard is straightforward and user friendly. After reviewing this announcement and the knowledge base article you should have no issues using the dashboards.
Q: Are these dashboards available to customers?
- A: No, currently these dashboards are not available externally but the information can be shared and discussed with customers.
Q: If I have an issue with the dashboards what should I do?
- A: If you are noticing any issues please use the KB to troubleshoot and resolve the issue. If this does not work please follow the BAU process for entering a support case.
|
|
This content is for Verizon Connect employees. Internal only. Do not distribute.
This message was sent on behalf of the Product Team to the following people that support:
-
Platform: Reveal
-
In this country: US, CA
-
On these teams: GCS, Hardware, Installs, L&D/Employee Training, Product/R&D (Global), Solutions Architect, VZC Exec Leadership, PMO, Sales Ops
|
|
Check out the Launch Hub for all recent product releases
|
|
|
|
|
|
|