Gordon T Long Research exclusively located at MATASII.com

All questions should be directed to the [email protected]

LONGWave - AUGUST 2022

A BEAR MARKET COUNTER RALLY OR SOMETHING ELSE??


The US equity markets have reached a critical signaling juncture of whether we are in a longer term bear market or the bear market is over and we are headed higher We at MATASII.com are still firmly in the camp that we continue to be within a major long  term market trend lower.


This month's LONGWave video lays out our views in this regard via 50 slides. However, we feel there is even further evidence for our thinking which is laid out below. Importantly, there are near term tests ahead that will soon tell us whether we are right or wrong. We identify those tests below.

LONGWave-08-10-22-AUGUST-What-Q2-Eanrings-Revealed-Cover image

=========


WHAT YOU NEED TO KNOW


  • MATASII'S INTERMEDIATE TERM "WATERFALL" CHART
  • A Long-Term Head & Shoulders and Rounded Top Formation Patterns gives strong evidence that an important long term technical market top is now in.
  • MATASII charts shows the markets to be in an important counter-rally within normal 61.8% retracement expectations.
  • A final push to the 200 DMA & 80 WMA overhead resistance level should be watched carefully to ensure it holds.
  • Watch for a possible classic "W" bottom formation with September earnings to signal if this Intermediate Term  Bear Market is in fact over.
  • BEAR MARKET COUNTER RALLIES ARE LARGER AND LONGER AS THE BEAR MARKET ADVANCES
  • The current counter rally is in line with major bear market counter rallies.
  • FIBONACCI RETRACEMENT LEVELS ARE AT CRITICAL "TELL"
  • The 50% retracement rule for Bear Markets is confusing newbie Momentum and Gamma 'Meme" traders. 
  • FINANCIAL CONDITIONS INDEX IS KEY TO WATCH
  • We expect the Financial Conditions Index to reach previous 2008-2010 levels before rebounding to prior market highs (see Longer-Term S&P500 chart directly below-left).
  • PHI MATES & PHI CLUSTERS TELL AN INTERESTING STORY
  • We are nearing the end of one of Dr. Robert Hugh's windows outlined below. We have found his theory of Phi Clusters to have a solid and proven predictability which is worth careful consideration.


WHAT IS GOING ON:

LARGE DEGREE REFERENCE CHARTS FOR THIS NEWSLETTER

MATASII'S EXPECTED LONGER TERM S&P 500 OUTLOOK


DECLINE IN THE US STANDARD OF LIVING MATCHES OUR EXPECTED DECLINE IN THE S&P500

=========

MATASII'S INTERMEDIATE TERM "WATERFALL" CHART


A Long-Term Head & Shoulders and Rounded Top Formation Patterns shown below give strong evidence that an important technical market top is likely now in.


  • We have been experiencing a classic "Doomed Market Top" since the beginning of 2021.
  • We appear to be completing a larger Right Shoulder of a classic "Head & Shoulders" pattern withing the Doomed Top.
  • The Right Shoulder is approaching longer term overhead resistance (Yellow resistance band shown below). 
LONGWave-08-10-22-AUGUST-What-Q2-Earnings-Revealed-Newsletter-2-MATASII-Long-Term-HS image

YOUR ANNOTATED DESK TOP / TABLET / PHONE ANNOTATED REAL-TIME CHART

 SUBSCRIBER LINK

MATASII BEAR MARKET ELLIOT WAVE COUNT & RETRACEMENT EXPECTATIONS


  • It is our expectations that the Intermediate Term Topping Pattern (shown above) is part of an Elliott Wave Double Combo Complex Corrective ("WXY" Zig Zag) formation.
  • Long Term Parabolic markets rises, shown below by three red curves (one dotted, one dashed and one solid), are important boundary conditions currently in play.
  • We should expect a major rally on completion of the "WXY" pattern at approximately 3270 on the S&P 500.
LONGWave-08-10-22-AUGUST-What-Q2-Earnings-Revealed-Newsletter-2-WXY-Corrective-Pattern image

YOUR ANNOTATED DESK TOP / TABLET / PHONE ANNOTATED REAL-TIME CHART

 SUBSCRIBER LINK

  • We have been expecting a standard Fibonacci counter rally retracement of 61.8% which the S&P 500 has now achieved.
LONGWave-08-10-22-AUGUST-What-Q2-Earnings-Revealed-Newsletter-2-WXY-Corrective-Pattern-2 image

YOUR ANNOTATED DESK TOP / TABLET / PHONE ANNOTATED REAL-TIME CHART

 SUBSCRIBER LINK


A FINAL PUSH TO THE 200 DMA OVERHEAD RESISTANCE LEVEL

We anticipate that the bear market counter rally will end with a retest of the underside of the 200 Day Moving Average at approximately 4329 on the S&P 500 (shown below).

LONGWave-08-10-22-AUGUST-What-Q2-Earnings-Revealed-Newsletter-2-WXY-Corrective-Pattern-3 image

YOUR ANNOTATED DESK TOP / TABLET / PHONE ANNOTATED REAL-TIME CHART

 SUBSCRIBER LINK

NOTE: Watch for a possible final retest of the prior lows with a classic "W" bottom formation. This will tell you we are wrong with our assessment that the Bear Market is still in play and we are no longer heading for a S&P 500 low of 3270.

NOTICE Information on these pages contains forward-looking statements that involve risks and uncertainties. Markets and instruments profiled on this page are for informational purposes only and should not in any way come across as a recommendation to buy or sell in these assets. You should do your own thorough research before making any investment decisions. MATASII.com does not in any way guarantee that this information is free from mistakes, errors, or material misstatements. It also does not guarantee that this information is of a timely nature. Investing in Open Markets involves a great deal of risk, including the loss of all or a portion of your investment, as well as emotional distress. All risks, losses and costs associated with investing, including total loss of principal, are your responsibility.

FURTHER SUPPORTING ANALYTICS

BEAR MARKET COUNTER RALLIES ARE LARGER AND LONGER AS THE BEAR MARKET ADVANCES


The current counter rally is inline with major bear market counter rallies experienced in 2000-2002 (Dotcom Bubble) and 2008-2009 (Great Financial Crisis).

LONGWave-08-10-22-AUGUST-What-Q2-Earnings-Revealed-Newsletter-2-Bear-Market-Rallies-1-00-02 image

2000-2002

LONGWave-08-10-22-AUGUST-What-Q2-Earnings-Revealed-Newsletter-2-Bear-Market-Rallies-2-08-09 image

2008-2009

FIBONACCI RETRACEMENT LEVELS ARE AT CRITICAL (BUT CONFUSING) "TELL" LEVELS!


WHAT IS DISTRACTING & CONFUSING MOMENTUM & GAMMA 'MEME' TRADERS


Very important to the Momentum and Gamma Meme traders is that the S&P is now back over the 50% retracement level (4220) from the January all time high to the June bear market lows. This is key because there has never been a "bear market rally" that bounced back above the 50% fib and then went on to make lower lows!


The mistake in this statistic (which is the current buzz within the trading community) is that we have not yet competed this Intermediate corrective leg and it is perfectly reflective of activity that can be expected in Elliot Wave Double and Triple Combo Corrective patterns which this market is currently within. We will likely end this particular leg at 3270 and then head to previous market highs. We will then enter a Longer Term Bear market.


The labeling of what is a Bear Market is confusing 'newbie' traders who have never experienced a real Bear Market! The confusion is centered around understanding "Degrees" of correction versus the relatively new terminology of a Bear Market being labeled as a market correction of 20%. We have not experienced the currently unfolding "Degree" of a real Bear Market in decades!

LONGWave-08-10-22-AUGUST-What-Q2-Earnings-Revealed-Newsletter-2-50-Percent-Bear-Market-Overhead-Resistance-2 image
LONGWave-08-10-22-AUGUST-What-Q2-Eanrings-Revealed-Newsletter-2-Correlation-10Y-Real-Rate-v-Forward-PE-Multiple image

The current drift lower in risk is coinciding with a sharp rebound in:


  1. Treasury yields,
  2. US Dollar strength,


Multiple expansion has been highly correlated to moves in forward rates. Goldman Sachs notes that to justify a further rally we need to see either EPS revised up (unlikely) or real rates move back to negative territory (chart to the right).


For all the melt-up euphoria, a casual look at what lies ahead brings up storm clouds, because unless earnings rebound - and with margins collapsing that's unlikely - the markets will need to see multiple expansion, which however is unlikely unless real yields drop turn negative again. However this is especially unlikely since the Fed will have to aggressively step in and contain the market's froth which has undone the tightening from the latest 150bps of Fed rate hikes, leaving Powell with no other choice than to hammer markets at the first possible opportunity (see Fed Funds v Financial Conditions chart above).

THE FINANCIAL CONDITIONS INDEX IS KEY TO WATCH!


Real rates have struggled to move back into negative territory as the Fed continues to keep policy in restrictive territory (chart below).

LONGWave-08-10-22-AUGUST-What-Q2-Earnings-Revealed-Newsletter-2-Financial-Conditions-Index-1 image

Based on the recent Fed Fund Rate hike we should expect near term Financial Conditions Index to increase, thereby pressuring the market lower (chart below).

LONGWave-08-10-22-AUGUST-What-Q2-Earnings-Revealed-Newsletter-2-Financial-Conditions-Index-3 image
LONGWave-08-10-22-AUGUST-What-Q2-Earnings-Revealed-Newsletter-2-Financial-Conditions-Index-2 image

We expect the Financial Conditions Index to reach previous 2008-2010 levels (see chart to right) before rebounding to prior market highs (see "What You Need to Know" at top of newsletter).


The rally in everything has 'eased' financial conditions again - almost exactly the same amplitude of easing we have seen 4 other times during this tightening cycle. (chart right)


We have seen this cyclical shift before with lower highs (tighter peaks to each easing sub-cycle) and lower lows (tighter tights) ... suggesting perhaps The Fed is well aware that tightening aggressively in one big batch will crush the market (and the economy). So perhaps a 'gently does it' approach is more palatable... and judging by the amplitude of this 'easing sub-cycle', we should be facing another tightening leg down...


We believe the current lift shown here will extend further than indicated before heading towards 3270.


As Nomura's Charlie McElligott recently noted:


"The trick here is this next few weeks window, where the resumption of Fed-speak could begin to lean back into the market’s impulse EASING of Financial Conditions Index."

LONGWave-08-10-22-AUGUST-What-Q2-Earnings-Revealed-Newsletter-2-Financial-Conditions-Index-4 image

PHI MATES & PHI CLUSTERS TELL AN INTERESTING STORY


The well followed Dr. Robert McHugh at TechnicalIndicatorIndex.com lays out his theory of Phi Clusters below. We are nearing the end of one of his windows outlined below. We have found this theory of Phi Clusters to have a solid and proven predictability and is worth careful consideration.


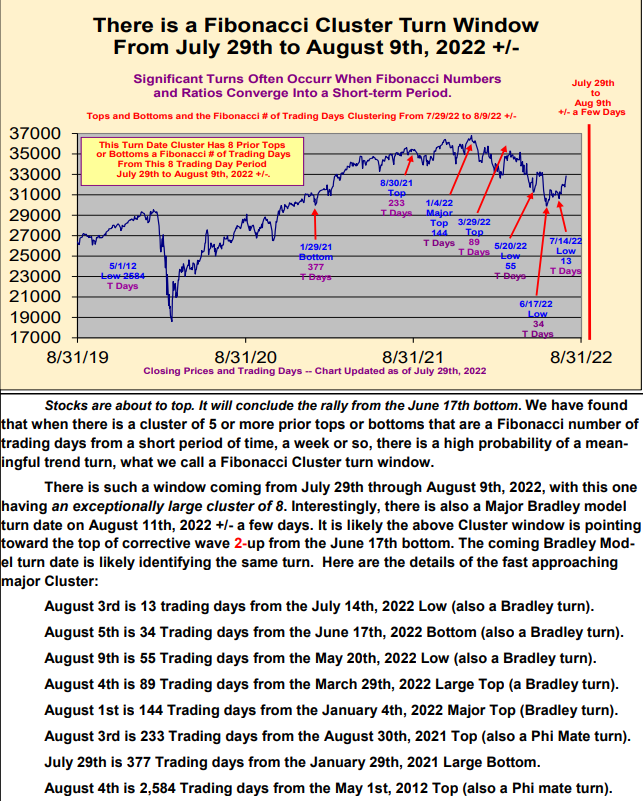
The As for the theory of this cycle indicator, we have found that when there is a cluster of 5 or more prior tops or bottoms that are a Fibonacci number of trading days within a short period of time, a week or so, there is a high probability of a meaningful trend turn, what we call a Fibonacci Cluster turn window.


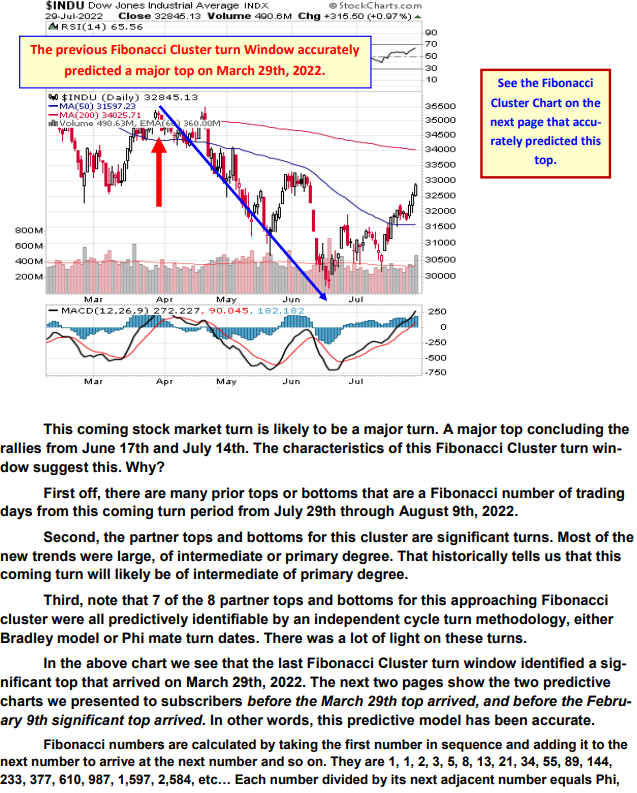
This coming stock market turn is likely to be a major turn. It will be a major top concluding the rallies from June 17th and July 14th. The characteristics of this Fibonacci Cluster turn window suggest this. Why?


  1. First off, there are a higher-than-usual number of prior tops or bottoms that are a Fibonacci number of trading days from this coming turn period, from July 29th through August 9th, 2022.
  2. Second, the partner tops and bottoms for this cluster are significant turns, not minor. Most of the trends from these matching tops and bottoms were large, of intermediate or primary degree. That historically tells us that this coming turn will likely also be large, of intermediate or primary degree.
  3. Third, note that 7 of the 8 partner tops and bottoms for this approaching Fibonacci cluster were all predictively identifiable by an independent cycle turn methodology, either Bradley model or Phi mate turn dates. There was a lot of light on these partner turns, that this coming turn is matched up with, which adds severity to the coming turn.


So how has this Fibonacci Cluster cycle turn indicator performed in the past? Well, the past two times during 2022 that we saw a Fibonacci Cluster turn window, they each accurately identified significant tops that led to strong declines within the stock market crash of 2022. The first one was the February 9th, 2022 top, the second one was the March 29th, 2022 top.

LONGWave-08-10-22-AUGUST-What-Q2-Earnings-Revealed-Newsletter-2-Phi-Clusters-1 image
LONGWave-08-10-22-AUGUST-What-Q2-Earnings-Revealed-Newsletter-2-Phi-Clusters-4 image

NOTE: Dr. Robert McHugh has reprinted the January and March results which is available with a subscription.

CONCLUSION


The S&P 500 will squeeze higher towards its 200 DMA (80 WMA) as the:


1. Fed "reasserts itself and is forceful in its push back to looser financial conditions",


2 Overall economy starts to get weaker which will feed into lower EPS expectations.


Inflation and the tight labor market remain the main focus points according to the investment bank. Labor market data needs to be extremely weak and CPI needs to come in with another big miss in order for Fed to "celebrate", so basically bad labor market is good news for the financial markets.


It is unlikely an equity rally, flattening yield curve and commodity backwardation can persist (chart right).


The curious case of the complacent retail investor


But their strength is "good news" for the contrarian (imposter) bear, because this will crack and before it does, one can be sure that we have not seen the lows. Not until this ‘gorilla’ in equity markets budges will we see the real bottom, warns BofA.(chart right bottom).

LONGWave-08-10-22-AUGUST-What-Q2-Earnings-Revealed-Newsletter-2-Somethings-Gotta-Give image
LONGWave-08-10-22-AUGUST-What-Q2-Earnings-Revealed-Newsletter-2-Big-Money-Selling-Required image
MATASII'S STRATEGIC INVESTMENT INSIGHTS
2020 VIDEOS OUTLINING THE COMING RISE IN INFLATION & COMMODITY PRICES
Supporting Newsletter -#1 - https://conta.cc/31jo7QU
Supporting Newsletter -#2 - https://conta.cc/3jmiwiB
Supporting Newsletter -#1 - https://conta.cc/3kXkKGu
Supporting Newsletter -#2 - https://conta.cc/2G7pE5e
Supporting Newsletter -#1 - https://conta.cc/2XQpe8H
Supporting Newsletter -#2 - https://conta.cc/3gXZ8bo

LONGWave - AUGUST 2022

RELEASED - 08-10-22


VIDEO: 21 Minutes with 50 supporting slides.

LONGWave-08-10-22-AUGUST-What-Q2-Eanrings-Revealed-Cover image
LONGWave-08-10-22-AUGUST-What-Q2-Eanrings-Revealed-Agenda image


VIDEO LINK: SUBSCRIBER LINK


TRANSCRIPTION: SUBSCRIBER LINK


OUR LATEST BOOK
IDENTIFICATION OF HIGH PROBABILITY TARGET ZONES


Learn the HPTZ Methodology!
Identify areas of High Probability for market movements
Set up your charts with accurate Market Road Maps

Available at Amazon.com
More Details at MATASII.COM


The Most Insightful Macro Analytics On The Web
PO Box 1224,
Norton, MA 02766
(508) 285 2213
Email Us
Twitter  Youtube  
LinkedIn Share This Email