|
Mid-Year Outlook 2026: Key Investor Lessons for the Second Half of the Year
July 2026
| | |
Pat McFawn | Financial Advisor - Registered Representative
Dale White | Financial Advisor - Registered Representative
Steve McFawn | Financial Advisor - Registered Representative
| | |
There is a saying that smooth seas do not make skillful sailors. When it comes to investing, at no time has this been more true than during the first half of the year. Investors faced major events including the war in Iran, oil prices pushing inflation to multi-year highs, and questions around artificial intelligence (AI). And yet, markets have climbed to new all-time highs, corporate earnings have grown at a double-digit pace, and many asset classes have performed well. The first six months have been a reminder of the importance of staying invested and maintaining a longer time horizon.
This lesson is perhaps even more important today because the business cycle is now in its seventh year while the market cycle is approaching its fifth. For investors, it can feel as if the same set of concerns have cycled in and out of focus, including inflation, the Fed, valuations, and more. Managing these conflicting challenges is not just a part of investing, but is why investors who stay the course are rewarded in the long run.
There will no doubt be unexpected events in the second half of the year, including developments in the ongoing Middle East conflict, the upcoming midterm election, and new market activity such as initial public offerings (IPOs). How can investors maintain perspective as these events unfold?
Key Market and Economic Drivers in the First Half of 20261
- The S&P 500, Nasdaq, and Dow Jones Industrial Average have returned 9.6%, 12.8%, and 8.9% year-to-date through the end of June, respectively. The second quarter was historically strong with the S&P 500 returning 14.9%, the Nasdaq 21.4%, and the Dow 12.9%.
- The Bloomberg U.S. Aggregate Bond Index has risen 0.6% year-to-date. The 10-year Treasury yield ended the second quarter at 4.47%, rising from 4.17% at the start of the year.
- Developed market international stocks (MSCI EAFE) have gained 7.7% and emerging market stocks (MSCI EM) have returned 22.7% year-to-date, both in U.S. dollar terms.
- The Bloomberg Commodities Index has risen 12.3% year-to-date. This was due to a strong first quarter which experienced a gain of 23.3%, versus a decline of 8.9% in the second quarter.
- Brent crude peaked just under $120 per barrel in May before closing the quarter at $73 per barrel.
- Gold prices fell to $4,007 per ounce while Bitcoin declined to a recent low of $58,633.
- Headline CPI rose 4.2% year-over-year in May, driven largely by energy prices. Core CPI, which excludes food and energy, rose 2.9%.
- The Federal Reserve kept rates unchanged at 3.50% to 3.75% through the first half of the year. Kevin Warsh was sworn in as Fed Chair in May.
The business cycle has entered its seventh year
| | |
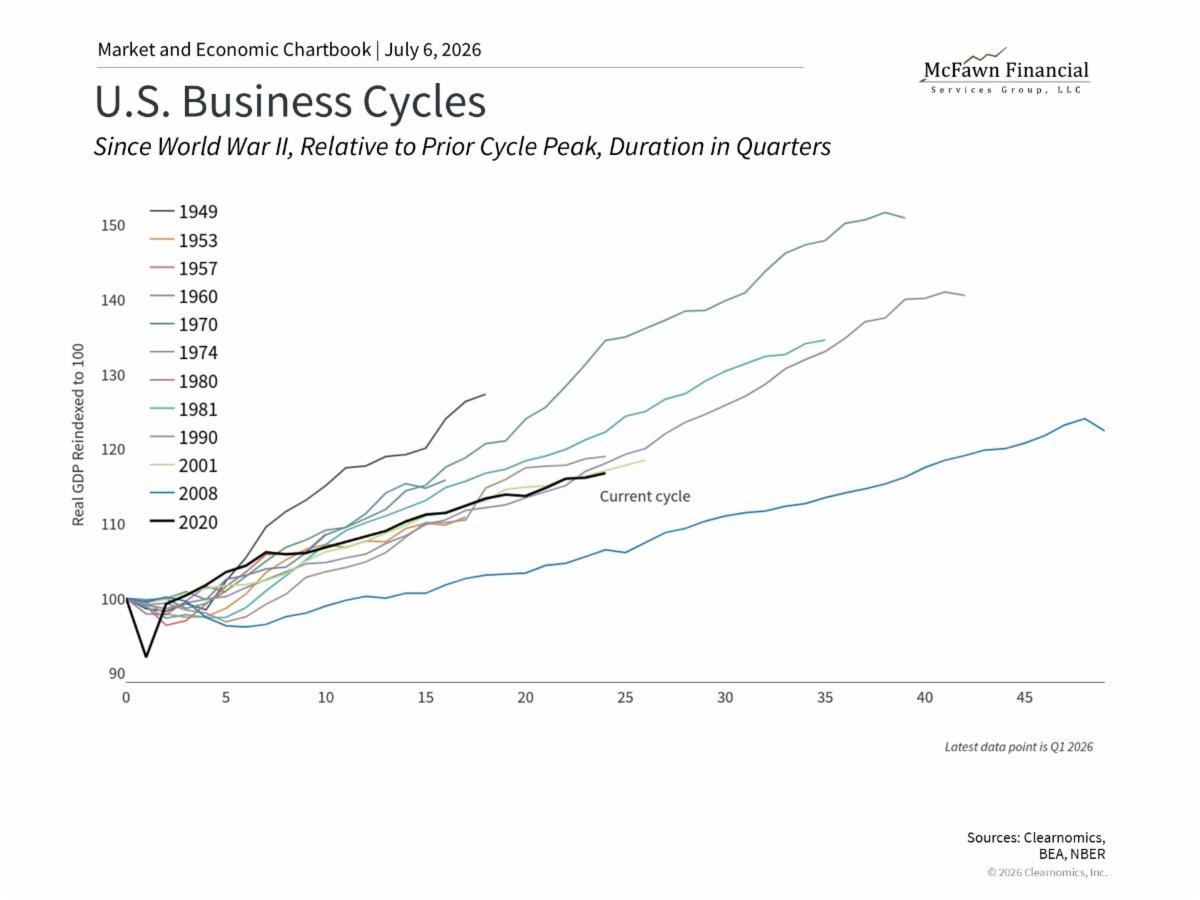
It may be surprising to some investors that the current business cycle began in April 2020 amid the pandemic and just passed its sixth anniversary in the second quarter. There have been several times when investors and economists worried that there might be another recession, including when inflation peaked in 2022 and when tariffs disrupted trade last year. Through it all, the economy has been resilient, growing steadily despite these challenges.
The business cycle affects all aspects of investing and financial planning, from mortgage costs to annual pay raises. A healthy economy drives consumer spending and business investment, fueling corporate earnings and ultimately stock market returns. So, while the stock market and economy are not the same thing, they are often closely linked. The chart above compares this cycle to other historical periods. The longest business cycles, including the one that began after the 2008 financial crisis and the 1990s during the dot-com boom, have lasted for a decade or longer.
How is the economy doing today? Inflation is high but could improve if oil prices remain low. The job market has begun to heat up again, reversing last year’s concerns over the slow pace of hiring. The dollar has stabilized and rebounded more recently, trade is still uncertain but has stabilized, and business investment has accelerated. Consumers are feeling pessimistic, but continue to spend on both necessities and discretionary items. Overall, the economy appears to be healthy despite some mixed signals, which is historically positive for financial markets in the long run.
Many asset classes have performed well this year
| | |
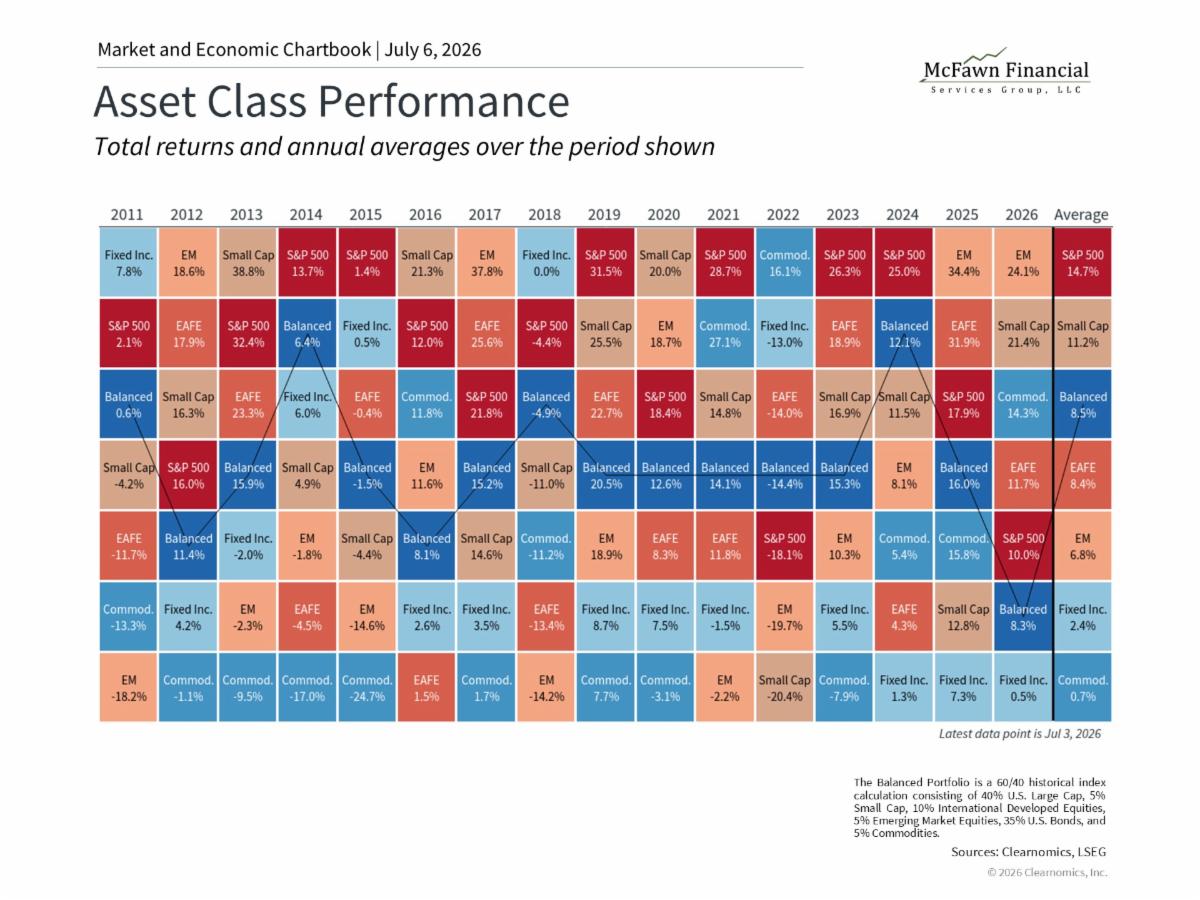
A variety of global asset classes have contributed to portfolios so far this year, continuing last year’s trend. This includes not only large cap stocks, represented by the S&P 500, but also small caps, emerging markets, and commodities, as shown in the chart above. The second quarter, in particular, was one of the strongest on record. This is partly due to the timing of the war in Iran which resulted in the market recovery beginning at the start of April.
There are many themes behind these returns, including the strength of the economy, hopes of a peace deal in Iran, and enthusiasm around AI. Many of these factors have driven corporate earnings growth, with profits rising over 20% in the past twelve months for S&P 500 companies.2 This strong market environment has also led to a wave of high-profile IPOs, including SpaceX in the second quarter, and the anticipated listings of OpenAI and Anthropic, both AI companies.
While investors often focus on the first few days of an IPO when there are the most headlines, the real benefits accrue over a longer period. The benefit of these listings is that they broaden the opportunity set for all investors, which is especially important since many companies have been staying private longer. What matters most is how these businesses then perform over the years and decades that follow. The largest technology companies today, for instance, have grown over a long period through many market and economic cycles.
All of these positive trends do mean that U.S. stock valuations are historically high. The S&P 500 currently trades at a price-to-earnings ratio of 20x, above the long-term historical average of 16x.3 These valuation ratios do not predict what the markets will do over the next year or two. Instead, they are helpful guides for building long-term portfolios, especially when considering other asset classes and risk management. Overall, this year’s asset class returns show the importance of maintaining balance.
Inflation remains a concern but oil prices have improved
| | |
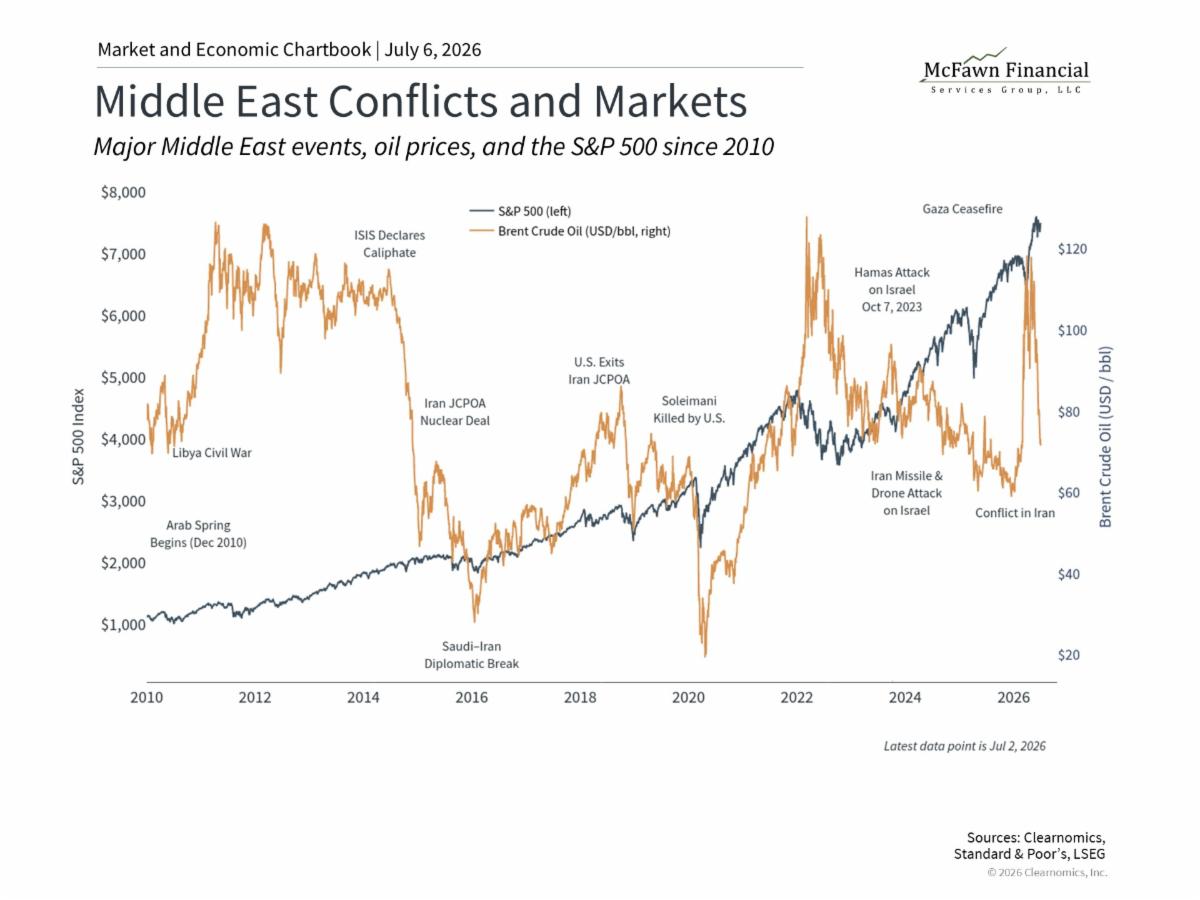
The ups and downs of the conflict in Iran have primarily affected the U.S. economy through energy markets. Disruptions to oil transportation through the Strait of Hormuz pushed Brent crude to nearly $120 per barrel before prices pulled back significantly. In recent weeks, oil prices have fallen to around $70, near pre-conflict levels. Gasoline prices have followed a similar path on a delayed basis, peaking above $4.50 per gallon nationally before retreating below $4.00 per gallon more recently.4
Energy price swings have directly impacted inflation rates. The Consumer Price Index rose 4.2% year-over-year in May, its highest reading in several years, with the gasoline component jumping 40.5% over the same period. Importantly, core CPI, which excludes food and energy, rose only 2.9%.5 This shows that inflation has been concentrated in fuel prices, and is not yet a broader phenomenon.
With oil prices falling recently, many economists hope that we are near peak inflation levels. This is similar to other past geopolitical shocks that affected the supply of oil, such as Russia's invasion of Ukraine in 2022, and many others shown in the chart above. Once the situation stabilized, oil prices often improved, bringing inflation rates back down over time.
Volatility has been manageable
| |
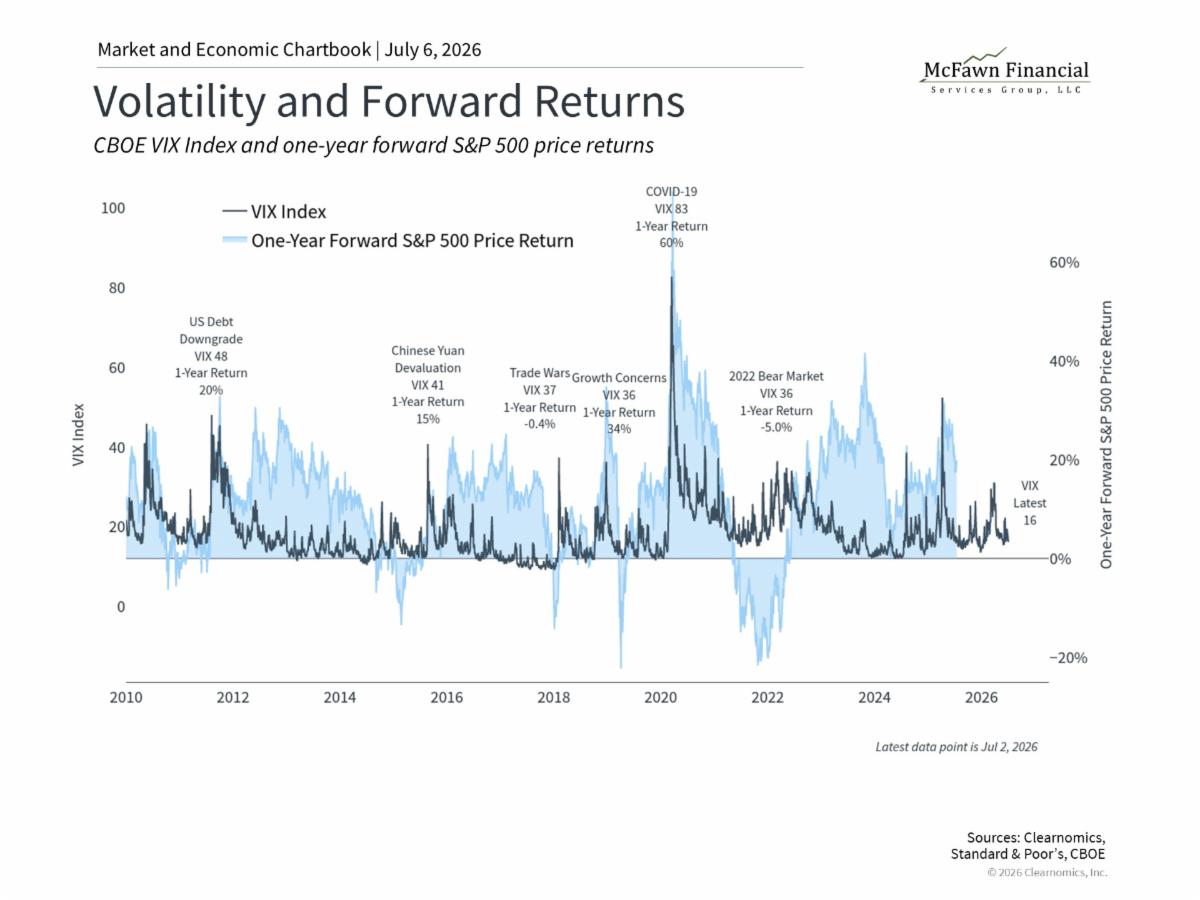
Investors have grown accustomed to brief periods of volatility caused by macroeconomic events. Between tariffs, the Middle East conflict, and uncertainty around the Fed, these events have led to short-lived market swings in just the past year alone. This can be seen in the VIX index, a common measure of stock market volatility. Fortunately, the current VIX reading of 16 sits below its long-term average of 18.4, and is well below recent peaks. This is shown in the chart above and also demonstrates that periods of volatility are also when the market opportunity can be the greatest.
Another way to think about how these market moves affect investors is via the largest pullback each year. So far, the S&P 500's largest peak-to-trough decline in 2026 has been 9%. While pullbacks like these are never pleasant, markets tend to rebound when investors least expect it. Today, not only has the market fully recovered from its earlier pullback, but the S&P 500 has reached 24 new all-time highs so far this year.6
The first half of the year demonstrates that the most important risk for investors navigating these episodes is not the volatility itself, but how we react to them. It’s tempting to try to time the market during periods of uncertainty, but this can often backfire. Instead, it’s better to hold a portfolio that is designed to withstand all parts of the market cycle, while serving long-term financial goals. By doing so, investors can better prepare for the inevitable periods of uncertainty in the second half of the year.
The bottom line? The first half of 2026 has rewarded investors who stayed diversified and maintained a long-term perspective, even as geopolitical and economic headlines created short-term uncertainty.
References
1. All figures are as of June 30, 2026 and are on a price return basis unless otherwise noted
2. Clearnomics research and LSEG data as of June 30, 2026
3. Ibid.
4. https://gasprices.aaa.com
5. https://www.bls.gov/news.release/cpi.nr0.htm
6. Clearnomics research and Standard & Poor’s data as of June 30, 2026
7. Clearnomics research and FDIC data as of June 30, 2026
Index Descriptions
S&P 500
The Standard & Poor’s 500 Index is a capitalization-weighted index of 500 stocks designed to measure performance of the broad domestic economy through changes in the aggregate market value of 500 stocks representing all major industries.
Dow Jones Industrial Average
The Dow Jones Industrial Average consists of 30 stocks that are major factors in their industries and widely held by individuals and institutional investors.
NASDAQ
The NASDAQ Composite Index measures all NASDAQ domestic and non-U.S. based common stocks listed on The NASDAQ Stock Market. The market value, the last sale price multiplied by total shares outstanding, is calculated throughout the trading day, and is related to the total value of the Index.
MSCI Emerging Markets Index
The MSCI EM (Emerging Markets) Index is a free float-adjusted market capitalization weighted index that is designed to measure the equity market performance of the emerging market countries of the Americas, Europe, the Middle East, Africa and Asia. The MSCI EM Index consists of the following emerging market country indices: Brazil, Chile, Colombia, Mexico, Peru, Czech Republic, Egypt, Greece, Hungary, Poland, Qatar, Russia, South Africa, Turkey, United Arab Emirates, China, India, Indonesia, Korea, Malaysia, Philippines, Taiwan, and Thailand.
MSCI EAFE Index
The MSCI EAFE Index is a free float-adjusted market capitalization index that is designed to measure the equity market performance of developed markets, excluding the US & Canada. The MSCI EAFE Index consists of the following developed country indices: Australia, Austria, Belgium, Denmark, Finland, France, Germany, Hong Kong, Ireland, Israel, Italy, Japan, the Netherlands, New Zealand, Norway, Portugal, Singapore, Spain, Sweden, Switzerland and the UK.
Bloomberg US Aggregate Bond Index
The Bloomberg U.S. Aggregate Bond Index is an index of the U.S. investment-grade fixed-rate bond market, including both government and corporate bonds.
| | The information contained in this report does not purport to be a complete description of the securities, markets, or developments referred to in this material. | | |
As always, if you have any questions, please do not hesitate to call us at (248) 619-0090.
This information, developed by an independent third party, Clearnomics, has been obtained from sources considered to be reliable, but Raymond James Financial Services, Inc. does not guarantee that the foregoing material is accurate or complete. This information is not a complete summary or statement of all available data necessary for making an investment decision and does not constitute a recommendation. The information contained in this report does not purport to be a complete description of the securities, markets, or developments referred to in this material. This information is not intended as a solicitation or an offer to buy or sell any security referred to herein. Investments mentioned may not be suitable for all investors. The material is general in nature. Past performance may not be indicative of future results. Raymond James Financial Services, Inc. does not provide advice on tax, legal or mortgage issues. These matters should be discussed with the appropriate professional. There is no guarantee that these statements, opinions or forecasts provided herein will prove to be correct. Investing involves risk and you may incur a profit or loss regardless of strategy selected, including diversification and asset allocation. Bond prices and yields are subject to change based upon market conditions and availability. If bonds are sold prior to maturity, you may receive more or less than your initial investment. Holding bonds to term allows redemption at par value. There is an inverse relationship between interest rate movements and bond prices. Generally, when interest rates rise, bond prices fall and when interest rates fall, bond prices generally rise. Prior to making an investment decision, please consult with your financial advisor about your individual situation. Raymond James is not affiliated with nor sponsors or endorses Clearnomics or any of the aforementioned organizations.
Leading Economic Indicators are selected economic statistics that have proven valuable as a group in estimating the direction and magnitude of economic change. The S&P 500 is an unmanaged index of 500 widely held stocks that is generally considered representative of the U.S. stock market. Inclusion of this index is for illustrative purposes only. Keep in mind that individuals cannot invest directly in any index, and index performance does not include transactions costs or other fees, which will affect actual investment performance.
The Bloomberg U.S. Aggregate Bond Index is a broad-based benchmark that measures the investment-grade, U.S. dollar-denominated, fixed-rate taxable bond market. The MSCI EAFE Index represents the performance of developed markets outside of the U.S. and Canada (Europe, Australasia, and the Far East). The MSCI Emerging Markets Index captures large and mid-cap representation across 24 Emerging Market (EM) countries. The U.S. Dollar Index measures the value of the U.S. dollar relative to a basket of foreign currencies. The Consumer Price Index (CPI) measures the average change over time in the prices paid by urban consumers for a basket of goods and services. It is one of the most widely used indicators for inflation.
| | |
Securities offered through Raymond James Financial Services, Inc. member FINRA/SIPC. Investment advisory services are offered through Raymond James Financial Services Advisors, Inc. McFawn Financial Services Group, LLC is not a registered broker/dealer and is independent of Raymond James Financial Services.
The Dow Jones Industrial Average (DJIA), commonly known as “The Dow” is an index representing 30 stock of companies maintained and reviewed by the editors of the Wall Street Journal.
The Russell 2000 Index measures the performance of the 2,000 smallest companies in the Russell 3000 Index, which represent approximately 8% of the total market capitalization of the Russell 3000 Index.
Bitcoin issuers are not registered with the SEC, and the bitcoin marketplace is currently unregulated. Bitcoin and other cryptocurrencies are a very speculative investment and involves a high degree of risk.
Investing in commodities is generally considered speculative because of the significant potential for investment loss. Their markets are likely to be volatile and there may be sharp price fluctuations even during periods when prices overall are rising.
Gold is subject to the special risks associated with investing in precious metals, including but not limited to: price may be subject to wide fluctuation; the market is relatively limited; the sources are concentrated in countries that have the potential for instability; and the market is unregulated.
Please visit https://www.raymondjames.com/legal-disclosures/social-media-disclaimer-icd for Additional Risk and Disclosure Information. Raymond James does not accept private client orders or account instructions by email. This email: (a) is not an official transaction confirmation or account statement; (b) is not an offer, solicitation, or recommendation to transact in any security; (c) is intended only for the addressee; and (d) may not be retransmitted to, or used by, any other party. This email may contain confidential or privileged information; please delete immediately if you are not the intended recipient. Raymond James monitors emails and may be required by law orregulation to disclose emails to third parties.
Investment products are: Not deposits. Not FDIC or NCUA insured. Not guaranteed by the financial institution. Subject to risk. May lose value.
This may constitute a commercial email message under the CAN-SPAM Act of 2003. If you do not wish to receive marketing or advertising related email messages from us, please reply to this message with "unsubscribe" in your response. You will continue to receive emails from us related to servicing your account(s).
| | | | |