|
Monthly Market Update for April: New All-Time Highs Despite Market Uncertainty
May 2026
| | |
Pat McFawn | Financial Advisor - Registered Representative
Dale White | Financial Advisor - Registered Representative
Steve McFawn | Financial Advisor - Registered Representative
| | |
April's performance is a reminder that markets can experience strong rebounds even in the face of ongoing investor concerns. Despite the continuing war in the Middle East, major market indices climbed to new all-time highs during the month. The S&P 500 gained 10.4% in April alone, one of its strongest monthly performances in history. On the surface, this echoes last year’s tariff-driven volatility and market rebound.
Of course, this does not necessarily mean the market will experience a smooth ride from here. Geopolitical uncertainty, a leadership transition at the Federal Reserve, and higher energy prices will likely generate headlines in the months ahead. What this does emphasize is that no matter how challenging a situation may appear to be, maintaining a well-constructed portfolio aligned with long-term financial goals remains the best approach.
Key Market and Economic Drivers in April
-
The S&P 500 and Nasdaq gained 10.4% and 15.3% for the month, both ending at new all-time highs, while the Dow Jones Industrial Average rose 7.1%.
- Volatility declined over the month, as measured by the CBOE VIX index, falling from 25.3 to 16.9 alongside improving market conditions.
- International developed markets returned 7.0% based on the MSCI EAFE Index in U.S. dollar terms, while emerging markets returned 14.5% based on the MSCI EM Index.
- U.S. small cap stocks jumped 12.2% based on the Russell 2000 and mid-cap stocks gained 7.8% based on the S&P MidCap 400.
- The 10-year Treasury yield ended the month with little change at 4.37%. The Bloomberg U.S. Aggregate Bond Index was flat with only a 0.1% increase during the month.
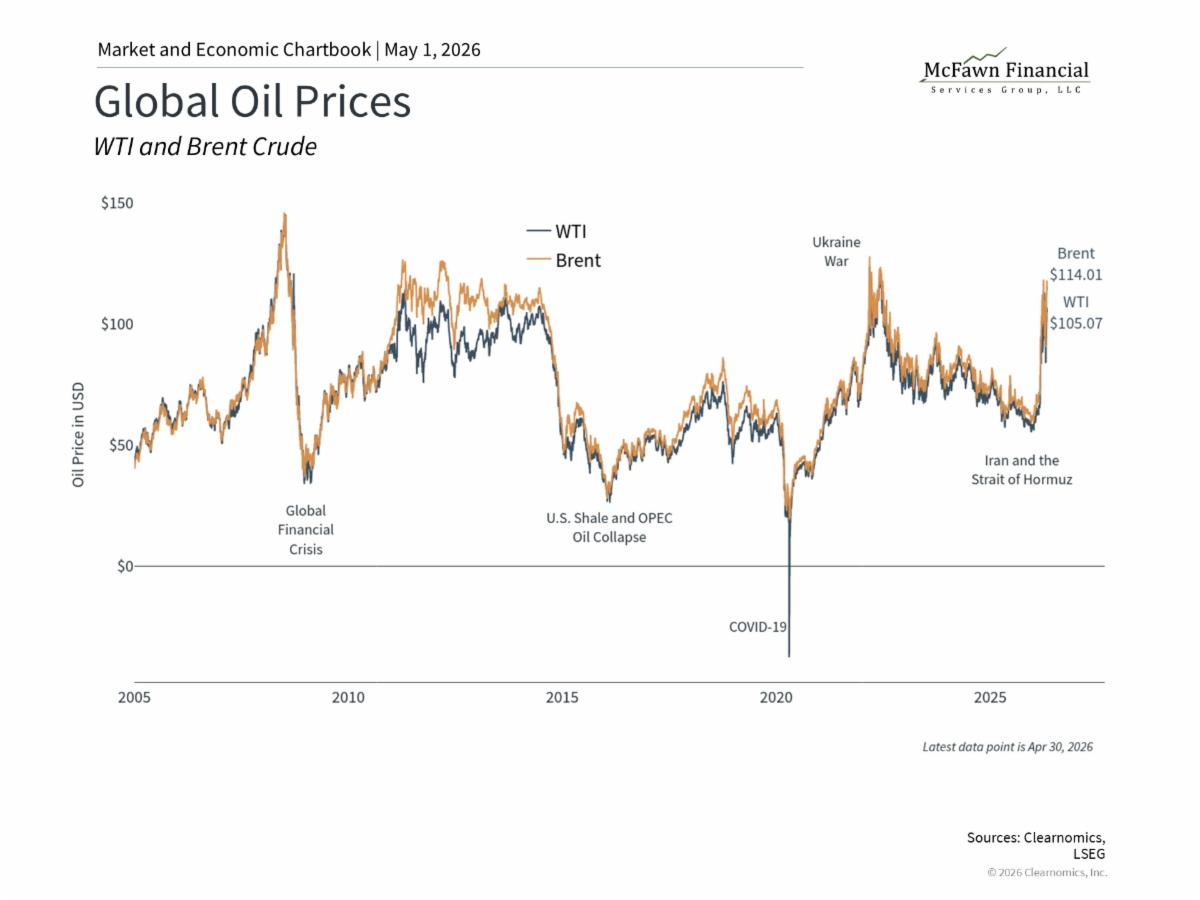
- Brent crude oil ended April at $114 per barrel, with swings from as low as $92 to as high as $121. WTI closed the month at $105, as the Strait of Hormuz remained closed to shipping.
- Gold ended the month at $4,610 per ounce, a slight decline over the month. The U.S. Dollar Index stood at 98.1, down from 99.96 the previous month.
The stock market rebound
| | |
The market’s gain in April may seem surprising given the backdrop of geopolitical tensions and policy uncertainty. However, history shows that some of the strongest market months have occurred during periods when investor sentiment was at its most cautious. This pattern has repeated across many cycles, including after the pandemic shock of 2020, the inflation-driven bear market of 2022, and the tariff-driven pullback of early 2025. While these types of rebounds are never guaranteed, they tend to occur when it’s least expected.
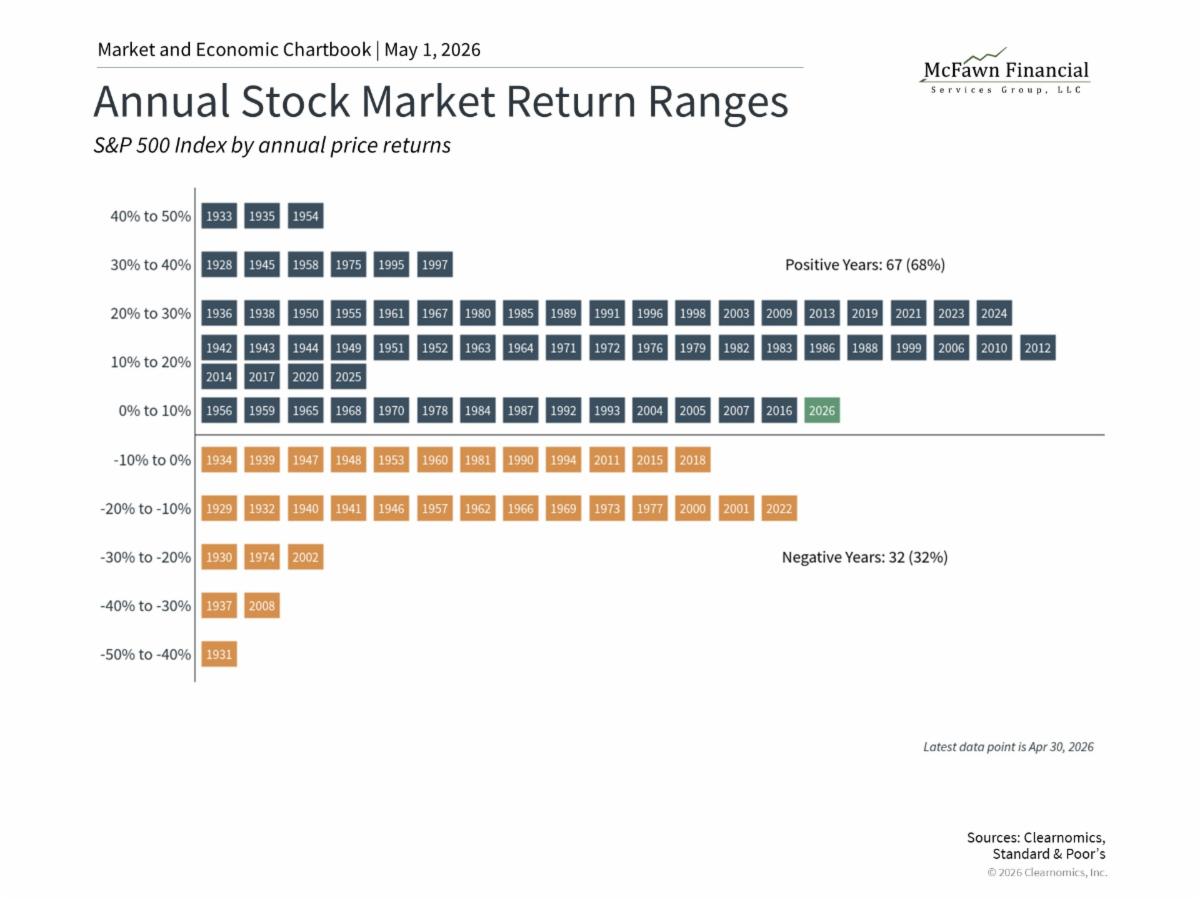
When combined with negative returns in the first quarter, the S&P 500 is now up 5.3% year-to-date. The accompanying chart shows the distribution of annual S&P 500 returns over history. Since 1928, the market has been positive in roughly two-thirds of years, which means that while negative years are common and not unexpected, there are far more years with gains over longer time horizons. Since 1980, the percentage of positive years is even higher, at about three-quarters.
This is not to say that markets always rebound quickly, but instead underscores the difficulty of timing the market. These past few years provide important lessons for investors to remember during upcoming periods of volatility, when they inevitably occur.
The Federal Reserve’s final session under Jerome Powell
| | |
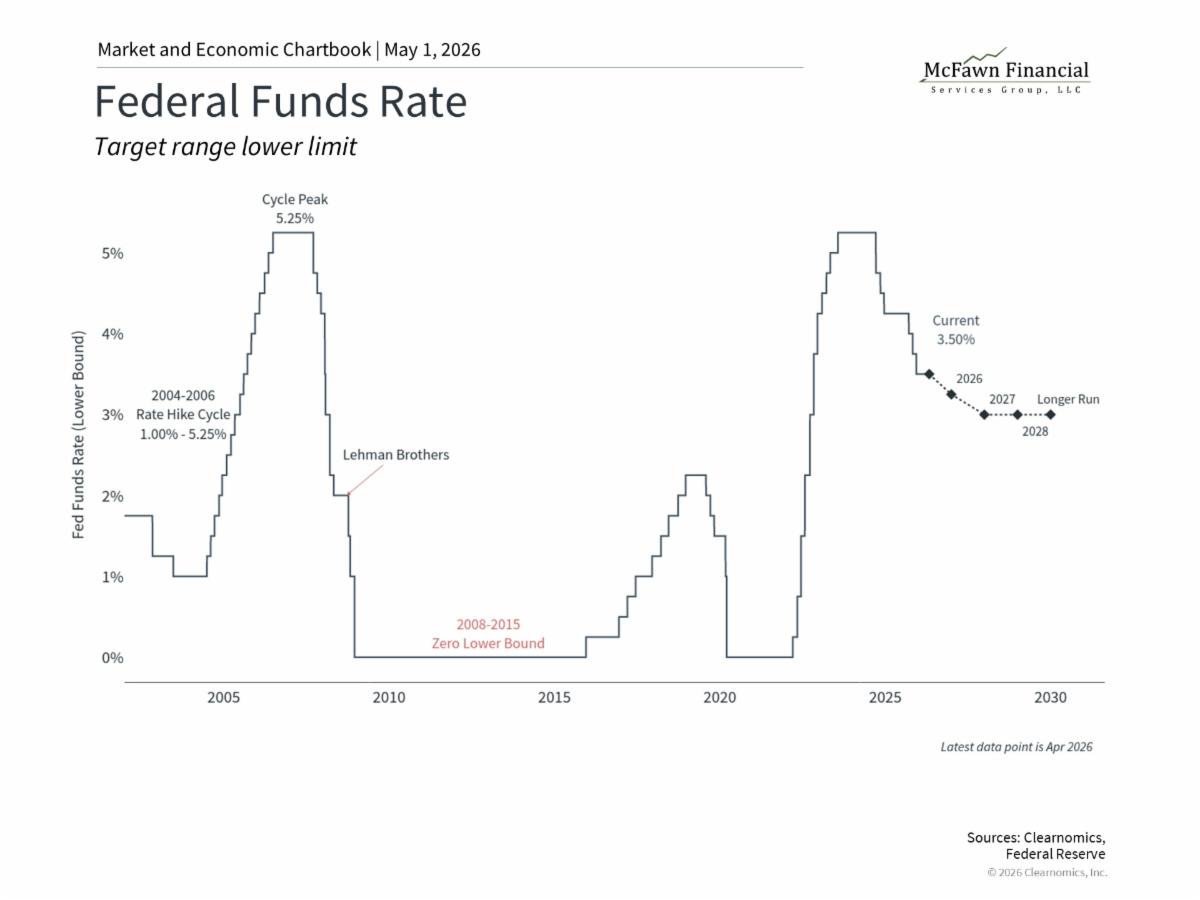
The Federal Reserve held its key policy rate steady at its April meeting, keeping it in a range of 3.50% to 3.75%. While this decision was widely anticipated, there was significant disagreement within the committee as four of the twelve voting members dissented, the most since 1992. Three officials agreed with the rate decision but did not support continuing to include language in the statement that hinted at future rate cuts. One governor pushed for an immediate cut, although they have done exactly that at every meeting they have attended.
The divide reflects a leadership change and two economic challenges that the Fed is navigating. When it comes to the economy, the labor market has been showing signs of softening, with job openings falling below the number of unemployed workers for the first time in years. When it comes to inflation, however, the ongoing conflict in Iran and continued disruption around the Strait of Hormuz have pushed oil prices even higher, affecting gasoline prices and inflation.
Supporting the job market would normally result in rate cuts, while fighting inflation would call for rate hikes. As a result, market expectations for the next Fed move have shifted to reflect roughly even odds between a rate cut and a rate hike later this year.
This was also Jerome Powell’s final press conference as Fed Chair. He has served in the role since taking over from Janet Yellen in 2018, and has been on the Board of Governors since 2012. The next Fed Chair is expected to be Kevin Warsh, whose nomination has been approved by the Senate Banking Committee. Powell stated at the press conference that he will not leave the Fed’s Board of Governors until legal actions from the Justice Department are resolved, and that he intends to serve in a manner that is respectful of the incoming Chair.
While a change in Fed leadership adds a layer of uncertainty as to how the Fed is likely to proceed, the reality is that both markets and the economy have performed well across many Fed Chairs and monetary policy environments. Ultimately, a well-diversified portfolio is designed to manage through this kind of policy uncertainty.
Oil prices and the Strait of Hormuz
| | |
Oil prices remain one of the most direct channels through which the conflict in Iran affects everyday investors and consumers. Brent crude and WTI prices climbed back toward recent highs in April as the Strait of Hormuz remained effectively closed to oil shipping. There were a number of false starts over the past month regarding ceasefires and peace deal negotiations, which whipsawed markets.
Still, the stock market has performed well despite higher oil prices. The more significant concern for investors is whether energy costs will begin to spread to other parts of the economy. This “second-order effect” would occur if oil and gasoline prices remain high for an extended period, increasing transportation and energy input costs for businesses that are then passed onto consumers via higher prices for goods and services.
That said, it is worth maintaining some perspective. The history of oil shocks suggests that inflation effects can fade once the underlying situation stabilizes. The 2022 spike in U.S. gasoline prices above $5 per gallon proved to be short-lived as supply conditions improved, even if it did create challenges for household budgets. Also, it is worth noting that the U.S. remains the world’s largest producer of oil and natural gas, which provides some insulation from global supply disruptions compared to prior decades.
For investors, this year also underscores the important contributions different parts of the market can make to balanced portfolios. For example, technology-driven sectors performed well over the past month, and the energy sector has contributed positively this year. Holding a portfolio that can benefit from all parts of the market continues to be important.
The bottom line? The market rebound in April demonstrates that positive swings can occur even during challenging times. A well-constructed portfolio, aligned with your long-term financial goals, is designed precisely to navigate these periods.
| | The information contained in this report does not purport to be a complete description of the securities, markets, or developments referred to in this material. | | |
As always, if you have any questions, please do not hesitate to call us at (248) 619-0090.
This information, developed by an independent third party, Clearnomics, has been obtained from sources considered to be reliable, but Raymond James Financial Services, Inc. does not guarantee that the foregoing material is accurate or complete. This information is not a complete summary or statement of all available data necessary for making an investment decision and does not constitute a recommendation. The information contained in this report does not purport to be a complete description of the securities, markets, or developments referred to in this material. This information is not intended as a solicitation or an offer to buy or sell any security referred to herein. Investments mentioned may not be suitable for all investors. The material is general in nature. Past performance may not be indicative of future results. Raymond James Financial Services, Inc. does not provide advice on tax, legal or mortgage issues. These matters should be discussed with the appropriate professional. There is no guarantee that these statements, opinions or forecasts provided herein will prove to be correct. Investing involves risk and you may incur a profit or loss regardless of strategy selected, including diversification and asset allocation. Bond prices and yields are subject to change based upon market conditions and availability. If bonds are sold prior to maturity, you may receive more or less than your initial investment. Holding bonds to term allows redemption at par value. There is an inverse relationship between interest rate movements and bond prices. Generally, when interest rates rise, bond prices fall and when interest rates fall, bond prices generally rise. Prior to making an investment decision, please consult with your financial advisor about your individual situation. Raymond James is not affiliated with nor sponsors or endorses Clearnomics or any of the aforementioned organizations.
Leading Economic Indicators are selected economic statistics that have proven valuable as a group in estimating the direction and magnitude of economic change. The S&P 500 is an unmanaged index of 500 widely held stocks that is generally considered representative of the U.S. stock market. Inclusion of this index is for illustrative purposes only. Keep in mind that individuals cannot invest directly in any index, and index performance does not include transactions costs or other fees, which will affect actual investment performance.
The Bloomberg U.S. Aggregate Bond Index is a broad-based benchmark that measures the investment-grade, U.S. dollar-denominated, fixed-rate taxable bond market. The MSCI EAFE Index represents the performance of developed markets outside of the U.S. and Canada (Europe, Australasia, and the Far East). The MSCI Emerging Markets Index captures large and mid-cap representation across 24 Emerging Market (EM) countries. The U.S. Dollar Index measures the value of the U.S. dollar relative to a basket of foreign currencies. The Consumer Price Index (CPI) measures the average change over time in the prices paid by urban consumers for a basket of goods and services. It is one of the most widely used indicators for inflation.
| | |
Securities offered through Raymond James Financial Services, Inc. member FINRA/SIPC. Investment advisory services are offered through Raymond James Financial Services Advisors, Inc. McFawn Financial Services Group, LLC is not a registered broker/dealer and is independent of Raymond James Financial Services.
The Dow Jones Industrial Average (DJIA), commonly known as “The Dow” is an index representing 30 stock of companies maintained and reviewed by the editors of the Wall Street Journal.
The Russell 2000 Index measures the performance of the 2,000 smallest companies in the Russell 3000 Index, which represent approximately 8% of the total market capitalization of the Russell 3000 Index.
Bitcoin issuers are not registered with the SEC, and the bitcoin marketplace is currently unregulated. Bitcoin and other cryptocurrencies are a very speculative investment and involves a high degree of risk.
Investing in commodities is generally considered speculative because of the significant potential for investment loss. Their markets are likely to be volatile and there may be sharp price fluctuations even during periods when prices overall are rising.
Gold is subject to the special risks associated with investing in precious metals, including but not limited to: price may be subject to wide fluctuation; the market is relatively limited; the sources are concentrated in countries that have the potential for instability; and the market is unregulated.
Please visit https://www.raymondjames.com/legal-disclosures/social-media-disclaimer-icd for Additional Risk and Disclosure Information. Raymond James does not accept private client orders or account instructions by email. This email: (a) is not an official transaction confirmation or account statement; (b) is not an offer, solicitation, or recommendation to transact in any security; (c) is intended only for the addressee; and (d) may not be retransmitted to, or used by, any other party. This email may contain confidential or privileged information; please delete immediately if you are not the intended recipient. Raymond James monitors emails and may be required by law orregulation to disclose emails to third parties.
Investment products are: Not deposits. Not FDIC or NCUA insured. Not guaranteed by the financial institution. Subject to risk. May lose value.
This may constitute a commercial email message under the CAN-SPAM Act of 2003. If you do not wish to receive marketing or advertising related email messages from us, please reply to this message with "unsubscribe" in your response. You will continue to receive emails from us related to servicing your account(s).
| | | | |