Expected Progeny Differences (EPD) allow for comparison of animals’ genetic merit as parents within a breed for a given trait. This selection tool has been utilized for many decades within the beef industry, however, even today, some beef cattle producers are skeptical of where EPDs come from or how they are utilized for selection. An EPD incorporates the animal’s full pedigree, the animal’s own record, progeny information, and even genomic information, if tested. Furthermore, as additional sources of information are submitted or become available, this will also increase the accuracy of the EPD value.
Many producers (both seedstock and commercial alike) tend to focus on the actual weights or ultrasound measurements when selecting a sire for the next breeding season. The actual weight of an animal depends not only on its genetics, but also the nutrition and management (this can also be called environment) this animal receives. Thus, the actual weight is not a simple reflection of the potential genetics the animal could pass to its offspring as a parent.
|
|
Why don’t full siblings have the same EPDs?
Each parent passes half of its genes to the offspring, however which alleles get passed on is completely random. Thus, an animal could receive all of the best alleles from a parent (which is what we all are hoping for), but this is not always the case. Another way of thinking about this is flush mates. These mates would share the same pedigree and thus the same EPD estimates when just pedigree information is utilized. However, as different performance and genomic records are submitted, these differences affect the EPDs which is ultimately due to the Mendelian sampling effect.
|
|
EPD changes and accuracy
An EPD is an estimate. Thus, as more information is provided on the animal, the EPD may change. As discussed above, the sources of information for an EPD include the pedigree, performance records of the animal, progeny information, and genomic information. For example, an animal starts out with just a pedigree estimate for birth weight at 0.7, but after a producer submits the animal’s own record for birth weight, the EPD estimate changes to 0.9 (Table 1). Then, after the animal is genotyped, the EPD changes to 2.4. This is just one example of how an animal’s EPD changes, however other examples can be found in Table 1 below. Not all animal’s EPDs change the same way as additional information is added. As more information is provided on the animal, the EPD value increases in accuracy, thus providing a more accurate representation of the animal’s genetic value as a parent.
|
|
Table 1. Examples of Birth Weight EPD Changes
|
|
Ultimately, when making selection decisions that will influence your herd for years to come, focusing on the genetic components is key. Selection tools such as EPDs are a more accurate estimate of the genetic merit an animal can pass on to the next generation, making it a reliable resource to utilize.
Navigating an animal’s EPD table on the Registry
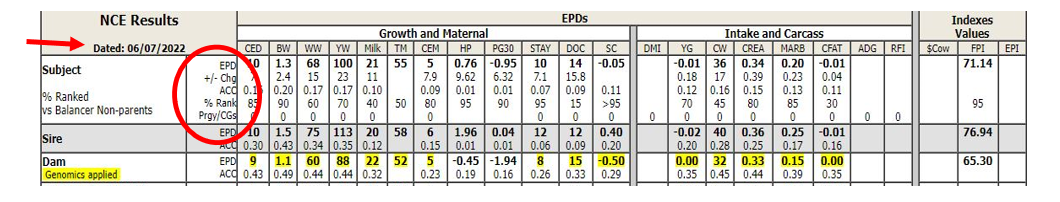
Figure 1 below shows a full EPD table for an animal as it appears within the AGA Online Registry Service. Just to the left of each row of numbers is an abbreviated description of what those numbers represent: Expected Progeny Difference (EPD), Variance Change (+/- Chg), Accuracy (ACC), Percent Rank (% Rank), Number of Progeny/Contemporary Group with information reported for that trait (Prgy/CGs). A “~” in the Prgy/CGs column means that number refers to the progeny equivalent gained from genomic testing.
Figure 1. EPD Table as seen on the AGA Online Registry Service
|
|
How often do new EPDs appear on the registry?
The AGA Online Registry Service provides updated EPDs every week on animals that have ran through the genetic evaluation. The date an animal’s data was ran can be seen directly under “NCE Results” on the animal’s EPD table, as pointed out on Figure 1. It’s important to note that while EPDs are updated weekly, the date shown reflects when data was sent to the genetic evaluation and will always show the date of the prior week for the most current EPDs. For example, EPDs that were released on Monday, June 13 have the date of June 7, 2022.
Breed Averages and EPD Reports
To compare an animal’s EPDs to those of the breed average, be sure to visit the EPD Info page found under the Genetic Technology tab at Gelbvieh.org to view breed average EPDs that are updated quarterly throughout the year. |
|
Additional EPD reports and sire summary information can be found on the AGA Online Registry Service below the left work menu under the heading Cattle Evaluation. Reports include genetic trends, percentile ranks, progeny tested sires, genetic indicator sires and trait leaders.
Questions?
For more information or questions about EPDs, please contact the AGA office at 303-465-2333 or email [email protected].
|
|
|
|
|
|
|