|
In the Fall of 2022, before we knew it would become the seed for a series about sustainability, we published Contrail Busters. This introduced the significant impact that some contrails have on the climate. We’ve since written a lot more about sustainability; the other articles in this series are listed under Useful Links below.
This time, we are wrapping up our sustainability series with a look at how you’ll be able to perform cost- and climate-aware flight optimization using ARINCDirect flight planning in tandem with a new application available soon. If you have time now, please consider reading or rereading Contrail Busters.
Aviation Climate-Change Factors
The best-known climate impact from aviation is CO2 emissions from burning jet fuel. This constitutes about one-third of aviation’s climate impact, with immediate—and lasting—harmful effects. This factor increases linearly with the amount of fuel consumed. To a lesser extent, oxides of nitrogen (NO2 and NO3) are also emitted. These can be good (destroying methane) or bad (producing ozone). The contribution of oxides of nitrogen is difficult to measure or reduce, because they depend on engine temperature as well as fuel consumed. Sulfur dioxide, soot particles, and water vapor produced by combustion have little to no impact. On the other hand, contrails can be half or more of the climate impact for a flight. This is not intuitive, so we’ll look more closely at contrails.
Contrail Production
The contrail production cycle starts with tiny soot particles in turbine exhaust, byproducts of jet-fuel combustion. Water vapor can condense on these particles, and then freeze into small ice crystals. The ice crystals will in some situations join each other to form the familiar trails we’ve seen. Further, multiple trails can combine to form persistent cirrus clouds. Knowing where contrails are likely to be produced requires hyperlocal data, vertical and lateral, for meteorological conditions such as humidity, season, and time of day, along the route of flight.
Good and Bad Contrails
The determination of whether a contrail is “good” or “bad” depends on the direction of its radiative forcing. An easy way to think of it is whether a contrail blocks solar energy from the earth’s surface (like a shield) or holds energy close to the earth (like a blanket). The modeling for contrail production needs to take time of day, humidity, temperature, even season into account. A gross simplification would be that night-time contrails are generally bad (holding heat energy against the earth when it could be allowing it to escape). Day-time contrails can be good or bad, depending on the angle of the sun, presence of other cloud cover, and the like. The same weather-data models used to predict contrail production are used to determine if they are good or harmful.
It's important to note that unlike CO2 emissions, which are additive and persistent, contrails eventually dissipate. Even so, contrails are a large contributor to aviation’s climate impact. One helpful fact from long-term studies of contrails is that harmful contrails are only seen in about 2% of flights, but those contrails account for 80% of the climate impact. They are easily avoided, typically by climbing or descending one flight level. But of course, you need to know the potential to produce them and whether to go up or down to avoid producing them.
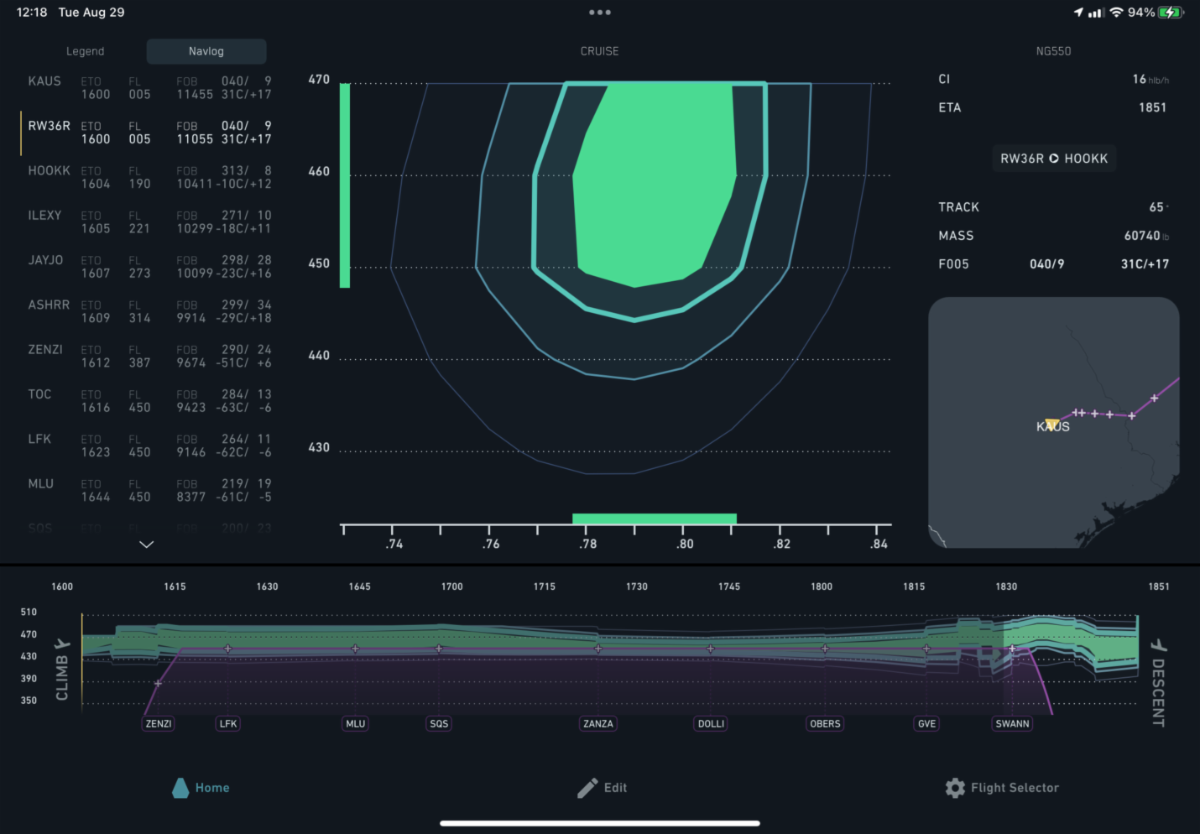
The Loretta App (cost- and climate-aware flight optimization)
The Loretta app is an adjunct to ARINCDirect flight planning and is designed to be used close to flight time to recommend altitude and Mach-speed changes that may reduce fuel burn and/or give an earlier arrival time. Plus, if your flight is likely to generate harmful contrails, you’ll be able to see where a minimal altitude change can avoid them. Recall that around 2% of flights examined generate about 80% of the harmful contrails.
Background: Cost Index
The notion of “cost index” is one of the keys to understanding and using Loretta. In Loretta, a cost index of 1 kilogram/minute means you are willing to burn up to 1kg more fuel in total to arrive 1 minute earlier (in metric aircraft). In imperial units, a cost index of 1 means you are willing to burn 100 pounds more fuel in total to arrive one hour earlier. The imperial units (100lb/hr) are a Boeing contribution and can be confusing. You may want to think of it as 1 pound more total burn to arrive 1/100 of an hour earlier (which is 36 seconds).
The ARINCDirect website has recently incorporated cost indexing. The flight-planning page gives you the ability to switch from fixed cruise modes (such as LRC) to a cost-indexed mode, with a simplified pulldown menu listing five values. These do have corresponding numerical values behind the scenes, but the names are much more descriptive of what they will do. And if you prefer fixed schedules, you can still use them.
|