Volume 64 | Thursday, March 9, 2023

Jump Seat Logo _New_.png
small-Collins_Aerospace_logo_k_rgb.jpg

Tools for Climate Change Effects

Welcome back to Jump Seat. We’re glad that you are reading our newsletter! 


A note about these articles: Our sustainability series has been written to provide information to help you navigate the technical and civic issues surrounding business aviation. Sustainability has taken on a new meaning for business aviation and as the pace of climate change intensifies, we know we have to explore pathways to mitigate our industry’s impact on the environment. Our goal is to help ensure that the aviation business remains viable in the future and that we are seen as making positive changes around sustainability. It is our hope that more efficient flight also leads to CO2 reduction, and that other expediencies, such as sustainable aviation fuel and contrail reduction, continue this path of improvement. Sustainability in general and certainly aviation sustainability is a major focus for Collins Aerospace, and we want to keep you up to date about initiatives our industry is taking to be on the forefront of innovation. 

This is the third article in our ongoing series about sustainability in business aviation. We’ll look at tools available to ARINCDirect subscribers to help cope with the effects of climate change. As a review, in the previous article we looked at specific impacts from three components: rising ocean, air, and land temperatures; increased wind speeds and locations; and heightened storm intensities and rainfall amounts. 


Storm Frequency and Intensity 


Perhaps the most widely useful tool for coping with storm effects is the Thunderstorms layer under our Mapping Plot. This tool can help you find the more severe thunderstorms by displaying them on a map. This layer looks ahead 16 hours, showing the areas of thunderstorms with color-coding for vertical velocity, along with the flight level of the tops within each area. There is a helpful legend at the lower right for the colors. 

Figure 1: Thunderstorm tops and vertical velocities on route map 

Looking at this area in southern Africa, you can see a few storm areas, one with tops at FL 460, but vertical velocities are on the lower end of the scale (5-20 meters per second). As storm intensities rise, you can expect more regions of dark orange and red to be displayed. As an aid to understanding the impact of vertical velocities, 40m/s and higher is considered strong convection, and such areas may become SIGMETs if the velocity remains high. 


It’s important to note that Thunderstorms (and other items in the Forecast Conditions list) can be toggled to use Global data (less precise) or North America data (more precise but limited in coverage). You should also expect turbulence anywhere in a 20-30 mile radius of the location, and anywhere from the surface to the tops. 


Other tools for monitoring storm activity include Weather Radar and grayscale and colorized IR Satellite. 

Figure 2: Route map checkboxes for Radar/Satellite and Forecasts 

Weather Radar is already well-known to you and very useful, but it’s only available in North America and Europe for the most part. In areas without radar coverage, the IR satellite layers will help identify areas of storm activity, and the Winds Aloft and EDR Turbulence layers can help you predict areas of clear-air turbulence (CAT) during planning. 


An Example of Using Winds and EDR to Predict CAT 


The two figures below show forecast models over British Columbia for FL400. 


Figure 3 shows an EDR forecast model over British Columbia at FL400. The darker oranges and reds represent values approaching 1.0. Typically, the closer to 1.0, the higher the likelihood you will encounter CAT.

Figure 3: EDR Turbulence Forecast over British Columbia

In Figure 4, the EDR forecast has the winds forecast overlaid on it. You can see that the FL400 winds turn from westerly to northwesterly over the region and there are pockets of wind-speed changes. Together, these present more opportunities for higher EDR values. This view can help you pinpoint those regions of potentially significant CAT.

Figure 4: EDR Turbulence Plus Winds Forecast over British Columbia

Wind Intensity and Temperature Changes


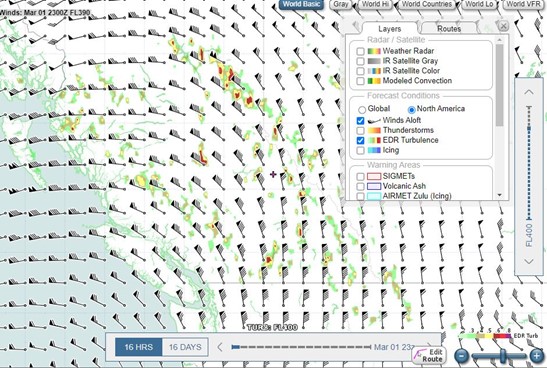
As discussed in a prior Jump Seat, increased pressure gradients are likely to result in higher winds and changes to historical directions and magnitudes. Of course, our flight-planning system takes current and forecast winds into account, and you can also overlay them on a flight-route map for a pre- and in-flight preview of what’s ahead, as in Figure 4. Our winds forecast can be displayed on the website out to sixteen days but is more accurate closer to flight time.


Flight Following and Monitoring


While climate-change effects are happening over a long period of time, your next flight is important to you in the moment. The tools discussed above can be helpful for each flight, and the premium ARINCDirect flight-following service can give you an extra measure of confidence. During flight planning and filing, you can also opt in to hazard alerting, which will automatically monitor your flight for winds, shear, turbulence, etc. that may have changed since the plan was computed.


And as always, our 24x7 Operations Center is ready to assist you via phone call, messaging, or feedback entry. Contact us:


Did you know?

  • Our sustainability series will resume soon with a high-level article about sustainable aviation fuel. We'd love your feedback on what else you'd like to read about. Please fill out this Jump Seat Sustainability Survey.

Useful Links

Thank you for reading!

Contact Jump Seat
Past Jump Seat Articles

We've updated our support Contact Information page. For coverage maps and more, navigate below.

ARINCDirect Support