|
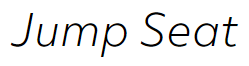
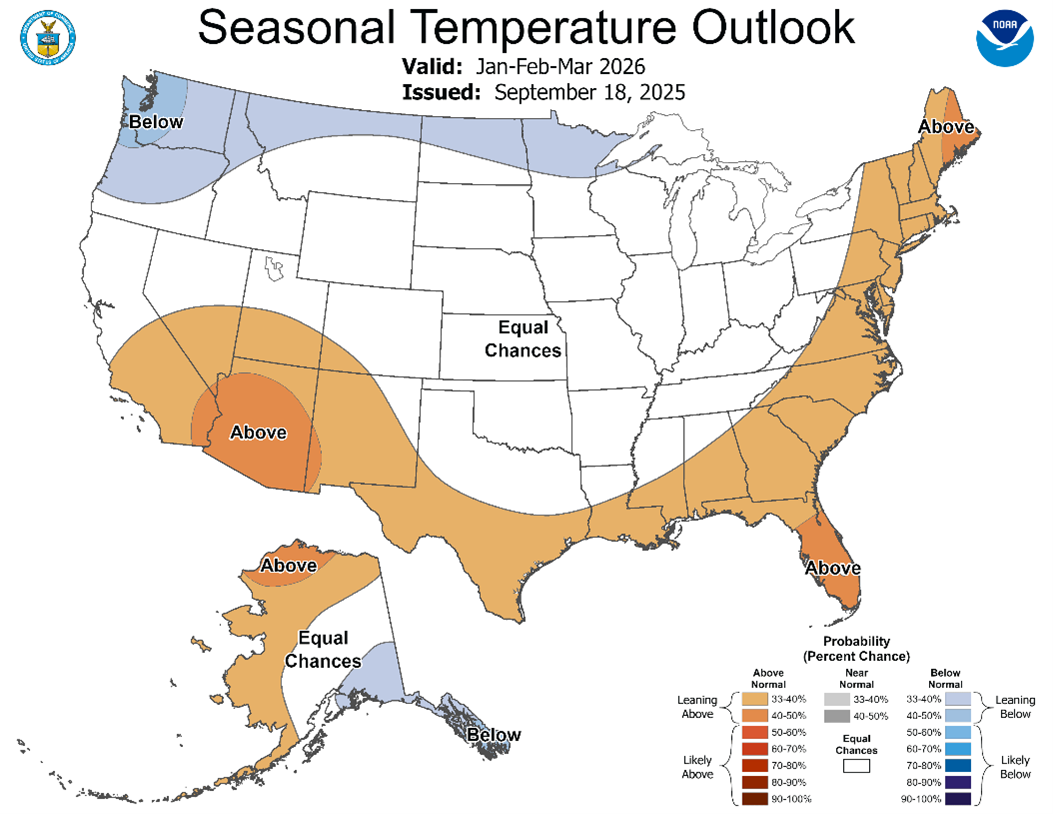
Images 1 & 2: January through March 2026 seasonal precipitation and temperature outlooks across the United States. Forecasts provided by the National Weather Service (NWS)’s Climate Prediction Center (CPC).
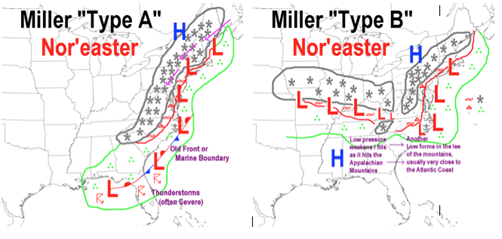
A Focus on the Northeast: Nor’easters and the I-95 Corridor
The Northeastern U.S. presents itself as a primary location for significant weather impacts from Nor'easters, largely in part due to a stark temperature gradient caused by the jetstream pushing cold and dry Arctic air towards the warmer ocean waters of the Atlantic gulf stream (the ocean current, not the jet). Nor’easter storms are most frequent between the late-fall and early-spring months (September through April) and have coined the nickname from the strong northeasterly winds that the storms can generate. Dependent on the exact storm track and air temperature, these storms can produce heavy precipitation, powerful winds, and even coastal flooding and erosion for coastline communities - all of which can significantly hinder travel plans and flights across the densely populated Washington, D.C., Philadelphia, NY-Metro and New England areas.
The precise track of the center of the low-pressure can play a significant role in precipitation type and totals across the Eastern Seaboard. A nor’easter whose center is located just 30nmi offshore can present far greater impacts for coastlines and deliver lesser effects northwards. An offshore track storm keeps colder Arctic air inland and moist air right along the coastline, creating an ideal atmospheric profile for snowfall. Nor’easters that track inland are often weaker and usher milder ocean air inland, allowing for mixed (rain-snow) precipitation along the coast.
To determine a storm’s rain vs. snow line, meteorologists often initially use the “540 line”, an isobar (line of constant pressure) that represents the vertical distance (5,400m atmospheric thickness) between 1000mb and 500mb aloft. If the thickness is less than 5400m, it suggests that the atmosphere is cold enough to support snowfall, as colder air is denser. Thickness greater than 540 can indicate warmer, less dense air, and the likelihood of rain if precipitation were to fall. Locations north of the 540 line, on average, receive snow, whereas locations south of the 540 line receive rain. It is important to note that forecasters reference the 540 line in conjunction with other factors (especially elevation) from the meteorology toolbox.
How Much Snow Will I Get?
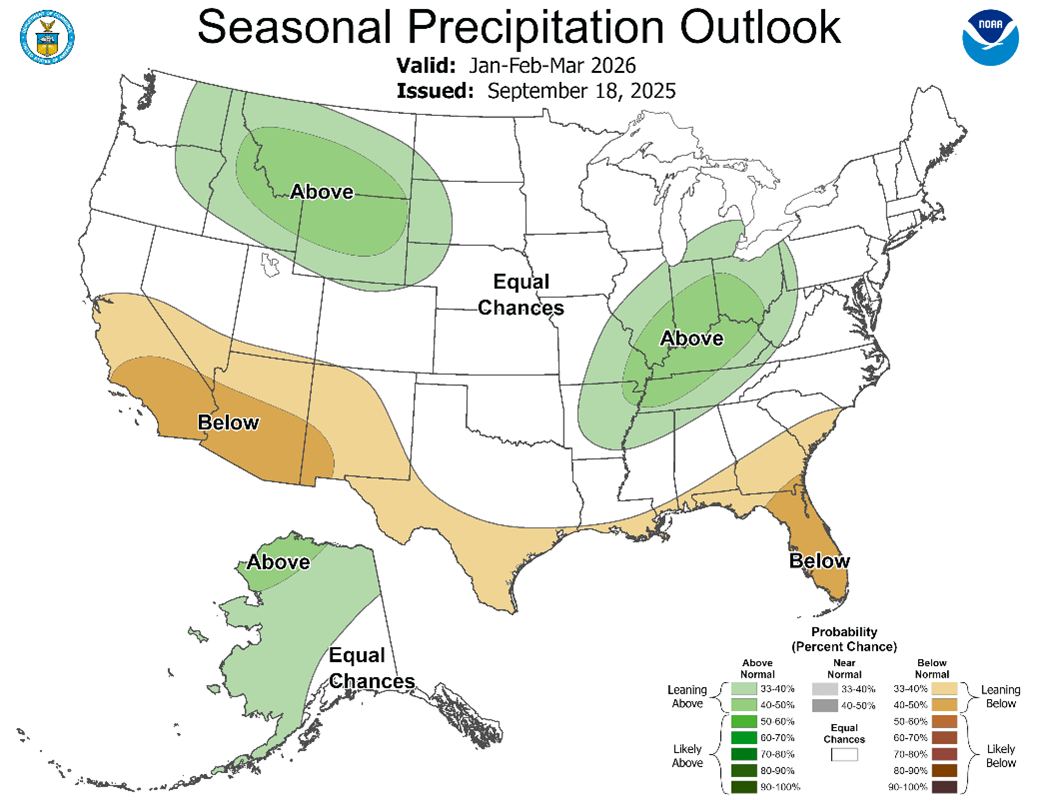
With talk of a winter-storm in the forecast, one question on everyone’s mind is, “how much snow will I get”? While an answer to this question can be challenging to pinpoint even the day of a winter storm, probabilistic snowfall forecasts within a 36-to-48-hour timeframe of an event are often published by 116 out of the 122 National Weather Service (NWS) Weather Forecasting Office (WFO)’s. Using a blend of computer models and meteorologist-input, these graphics display the range of potential accumulations from the beginning to end of an anticipated snow-event. The forecasts are often issued in a low-end, high-end, and most likely snowfall total. Users also have the option to toggle between a point (ex. 3”) and range (ex. 2-4”) output forecast.
Take, for example, the New York, NY forecast area, as seen below. Prior to an expected snowstorm one weekend this past January, the OKX WFO issued their expected snowfall amount forecast, painting a general idea of 3-5” for the KEWR, KJFK, and KHPN terminals, with locally heavier amounts upstate.
|