| | |
POLICY & ADVOCACY UPDATE
Issue #49, 3 July 2025
| | | |
- New Assistant Minister at Visitor Economy Roundtable
- Seafood country of origin labelling
- Temporary migration income threshold rises
- Hotel performance in June
- International tourism up for the March quarter
- Domestic tourism fell in March quarter 2025
- Latest Accommodation employment data for May 2025
| |
New Assistant Minister at Visitor Economy Roundtable
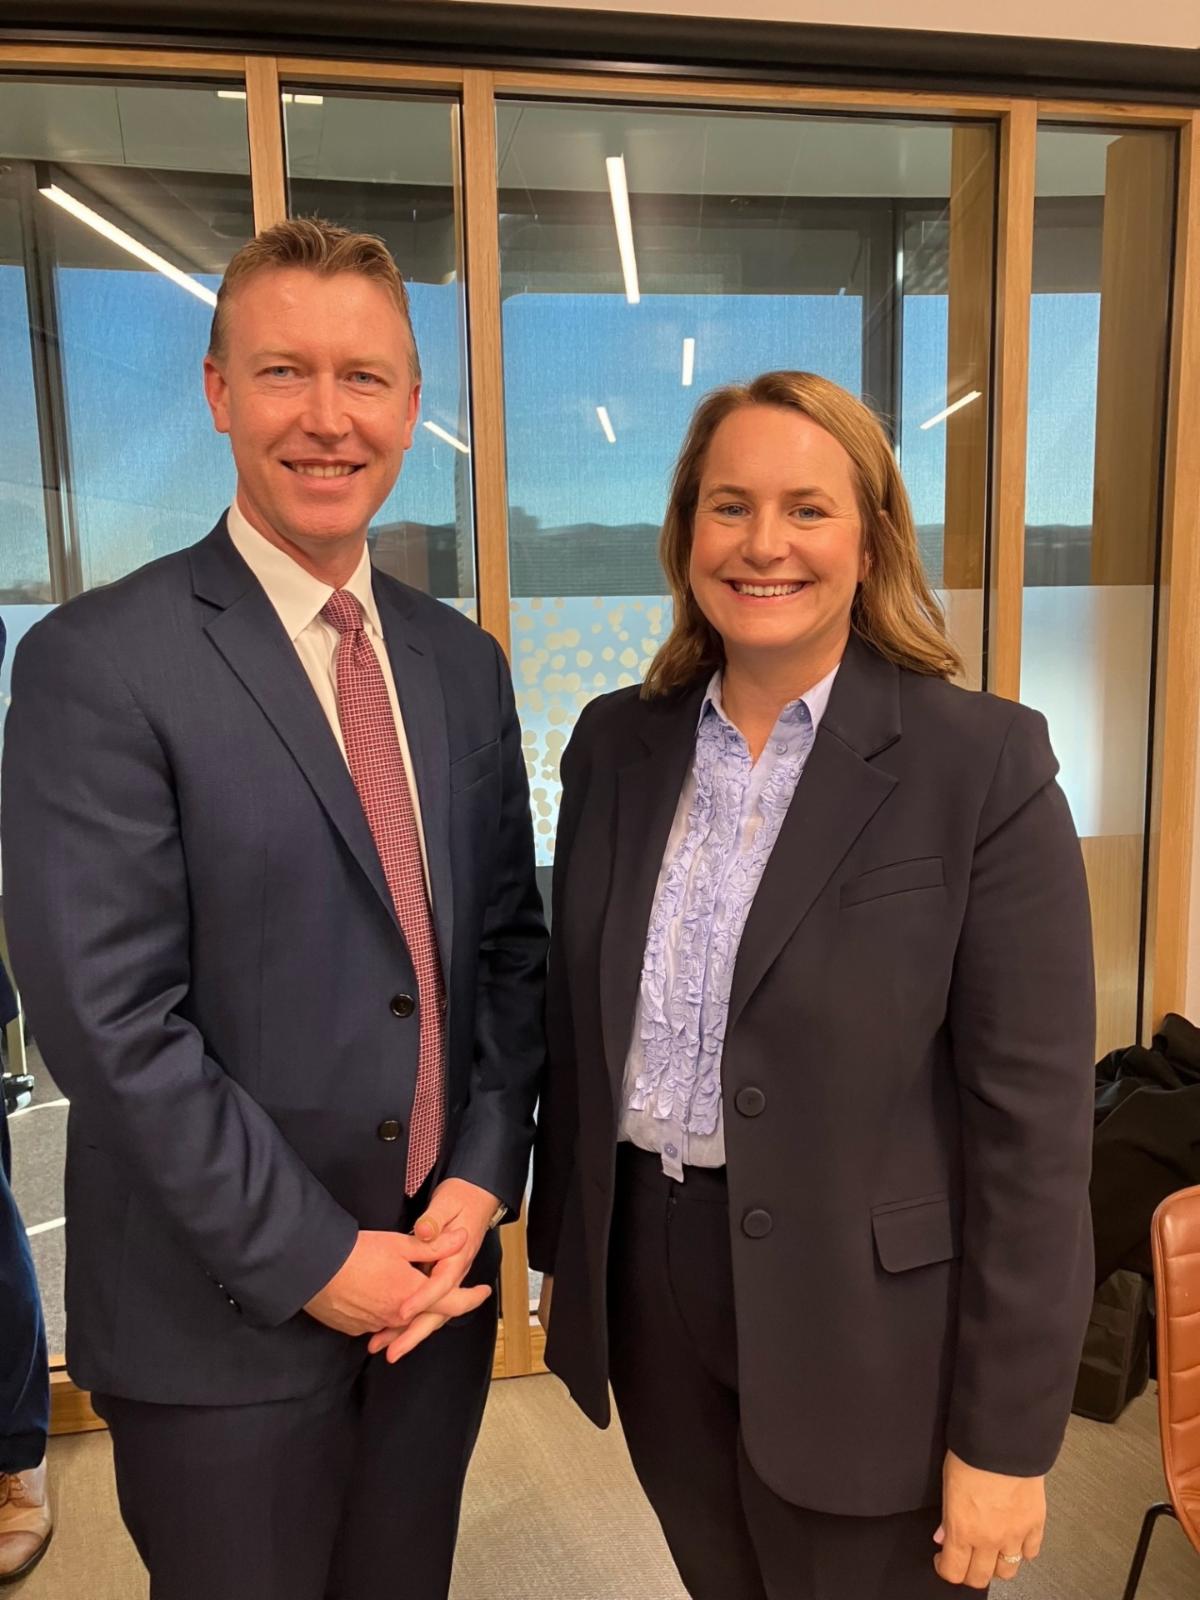
The new Assistant Minister for Tourism, Senator the Hon Nita Green, attended the Austrade Visitor Economy Roundtable on 20 June 2025 alongside other tourism leaders including AA CEO James Goodwin. Key issues discussed included opportunities and challenges facing the tourism industry, including improving training and skills, attracting more overseas visitors and growing First Nations tourism. AA was able to raise with the Senator our workforce and skills challenges, recent discussions on proposed bed taxes in Queensland, as well as encouraging her to help put on the national agenda the concerns about the impact of short-term rental on housing supply. In addition, we briefed her on our initial concerns with the Department of Environment and Climate Change’s proposal to extend the NABERS rating to accommodation properties with more than 100 rooms.
| | | |
Austrade Visitor Economy roundtable (above) listening to comments by new Assistant Minister for Tourism Senator the Hon Nita Green.
Pictured right are the AA CEO James Goodwin with the Assistant Minister Senator Green.
| | |
Seafood country of origin labelling
The Department of Industry, Science and Resources confirmed with the AHA/AA this week that the information standard for country of origin labelling for seafood in hospitality settings (seafood CoOL) has now been finalised. From 1 July 2026 it will be mandatory for restaurants, cafes and other hospitality businesses to label where their seafood comes from in accordance with the Australian-Imported-Mixed (AIM) model. The AHA worked extensively with government to ensure these standards were as practical as possible, given the inevitability of this policy's introduction. The department has indicated that during the transition period, they will release staged education materials to support labelling changes. The standard requires that the origin of the seafood served needs to be displayed in a way obvious to the customer before they order including on printed menus, a menu board or a clear sign in the business. The labelling method is known as AIM - A for Australia, I for imported and M if it is of mixed origin. For example, on the menu it would read "Grilled barramundi (A), Pad Thai noodles with prawns and squid (M)", with a legend appropriately placed on the menu telling the customer what AIM means. More detailed information on the requirements can be found on the department's website.
| |
Temporary migration income threshold rises
As mentioned in a recent Advocacy Update, our industry's use of temporary skilled migration to help fill staff shortages has risen significantly in the last year, with a 206% increase in temporary skilled visa applications in the year to March 2025 from the accommodation and food services industry, up from 4,200 to 12,850. The income threshold is an important component of this process, as the salary offered to the migrant, and the market salary of the role, need to be above the threshold which was previously known as the TSMIT (Temporary Skilled Migration Income Threshold) and now known as the Core Skills Income Threshold). On 1 July 2025, this threshold rose from $73,150 to $76,515. The level of the CSIT will continue to inhibit access to skilled migrants as, particularly in the regions, not only is this level well above the award wage for key occupations such as chef, but above the likely guaranteed annual earnings or market salary of the worker. This concern will continue to be raised with both the Minister and the Department, and AA is due to meet with both again this month. Given that it is core Labor policy, it will be difficult to change across the board, and members will continue to look to Designated area migration agreements (DAMA's) or their own labour agreement to address the problem.
| | |
Hotel performance in June
Preliminary capital city STR data for the month to 28th of June shows that hotel performance improved for some cities over the second fortnight but declined for others. Compared to the previous year Hobart was still the strongest improver over the period with a 14.7% increase in occupancy to 69.0% and a 13.7% increase in ADR to $207.86. Sydney experienced a 2.2% improvement in occupancy to 74.3%, but ADR fell 1.7% to $238.97. Melbourne's occupancy rose 1.2% to 65.9%, but ADR fell 4.3% to $195.94; Brisbane occupancy up 2.4% to 76.1%, and ADR up significantly 9.9% to $238.66; Adelaide occupancy up 8.8% to 69.8% and ADR up 1.5% to $180.04; Perth occupancy up 8.3% to 77.7% and ADR up 12.8% to $234.13; Darwin occupancy up 10.0% to 76.6% and ADR down 1.0% to $245.48; Canberra down 1.4% to 69.7% and ADR up 1.8% to $190.45; and Gold Coast occupancy down 8.9% to 57.9% and ADR down 0.9% to $231.23.
| | |
International tourism up for the March quarter
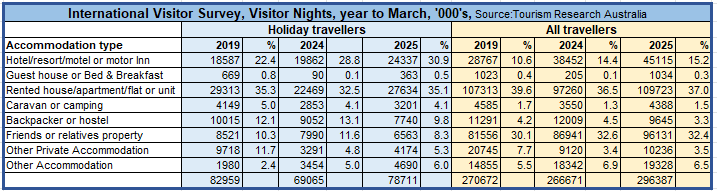
The latest international visitor survey released by TRA last week for March quarter 2025 shows that the spend by international tourists in Australia was $12.8 billion, up 25% on March 2024 levels, and the number of trips and nights spent in Australia both rose by 2%. As shown by the table below, for the year to March 2025, there were a record number of 296 million visitor nights, up by 11% on nights in the previous corresponding period and 9% more than the previous high in the year to March 2019. Holiday traveller nights have still not recovered to pre-COVID levels but are Importantly up by 14% on the previous year. The share of nights spent in hotels by holiday travellers has continued to rise to 30.9%, which is well up on the pre-COVID share of 22.4%. Of note, the share of holiday traveller nights of rented house/flat such as AirBNB also rose compared to 2024 but is about the same as the pre-COVID share. As the data covers nine months since the STRA levy was introduced in Victoria, it is useful to note that the total number of nights spent in a Victorian hotel actually fell over the year to March 25 from 11.3 million to 11.0 million, whereas the nights spent in a rented unit or house rose from 22.5 m to 32.3 m. For holiday traveller nights in Victoria, the picture is better for hotels, up from 4.6 m to 5.1 m, but even more favourable for rented units, up from 3.3 m to 7.3 m. It is clear the levy has done nothing to curb the nights spent in rented houses or units which reinforces AA's strong view that levies are ineffective in changing consumer choice - it is just a revenue grab.
| |
Domestic tourism down in March quarter 2025
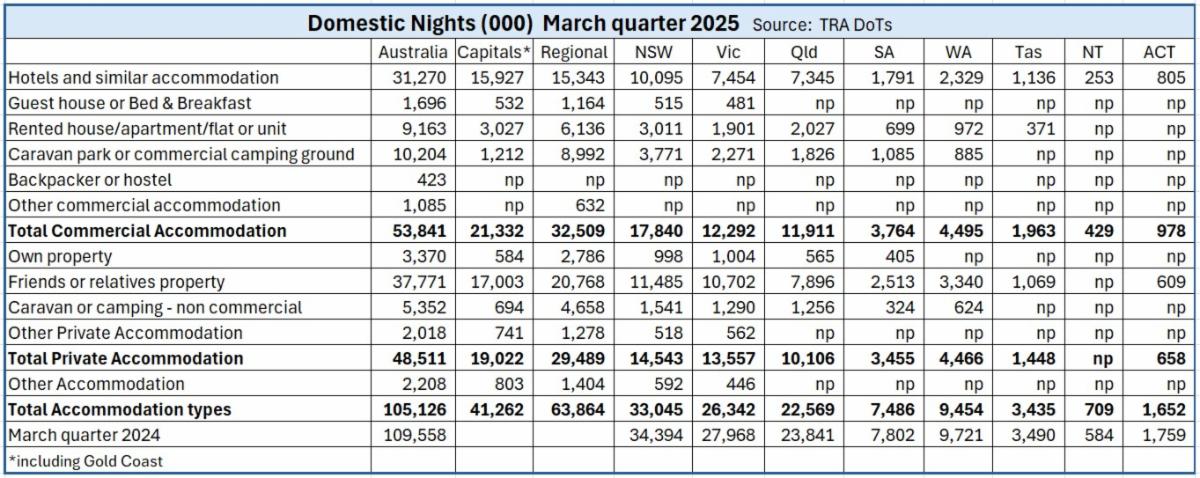
Last week Tourism Research Australia released its first domestic travel data for March quarter 2025 under the new model for collecting information on domestic visitor trips, nights and spend. DoTs replaces the previous National Visitor Survey (NVS) and combines big data from a range of sources as well as an annual survey of 32,000 Australians. The change in the data collection model makes detailed comparisons problematic in the transition, but the new DoTs data does provide an aggregate comparison with March quarter 2024. As can be seen in the table below, the number of domestic travel nights continues to fall in all States and Territories except the NT. On the plus side for our industry, compared with the old NVS, the new model shows that a higher percentage of visitor nights are spent in hotels and similar accommodation. Under the NVS for the year to 31 December 2024, the number of nights spent by holiday travellers in hotels was 29%, and 15% for all travellers. The DoTs data for March quarter 2025 show that 32.6% of total holiday traveller nights were spent in a hotel, and 29.7% for all visitors. In the capital cities, the hotel share across Australia is understandably a lot higher for all Travellers at 38.6%, but this figure varies considerably amongst the States, with the share at its highest in the ACT (48.7%), followed by NT (35.6%), Tasmania (33.1%), Queensland (32.5%), NSW (30.6%), Victoria (28.3%), with both SA and WA well below average at 23.9% and 24.6% respectively. In these last two States, staying with friends and relatives captures a much higher percentage of the total traveller nights.
Beyond the accommodation stats, DoTs for the March quarter 2025 show that over the overnight spend across Australia was down 7% to $27.1 billion and overnight trips down 2% to 28.8 million. TRA notes that the results were impacted by significant natural disasters such as flooding in Central and North Queensland, Cyclone Alfred and the Grampians bushfire. The timing of Easter also had an impact as it fell in the March quarter in 2024 but in the June quarter in 2025.
| |
Latest Accommodation employment data for May 2025
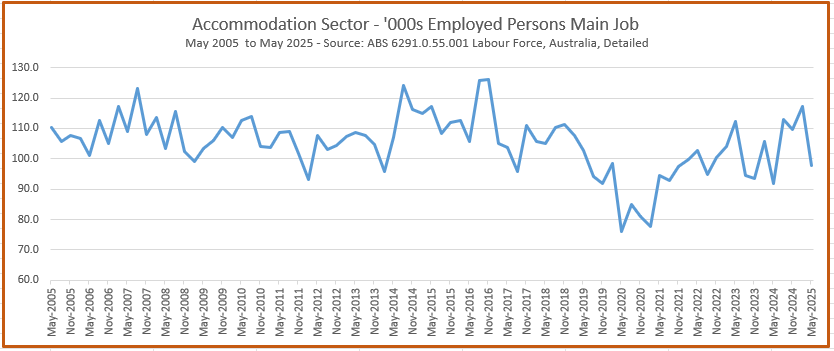
Last week the ABS released their quarterly detailed employment date for May 2025 showing that yet again in the May quarter, the ABS measures a significant drop in workers who class employment in accommodation as their main job. According to the labour force data, there were 97,800 people employed in accommodation, 60.2% of which were female, and 53.1% full time. This was a considerable drop from 117,200 employed in February, but more than the 91,800 designated by the ABS in May 2024. For all of the accommodation and food service industry (including pubs clubs and restaurants) the total number employed as their main job was 946,500, a more modest drop of 1.3% compared with February 2025. Across all of AFS, the number employed full time is a lot lower at 37.8%.
| | |
Drop me an email at policy@accommodationaustralia.org or give me a call on 0418 277 919 if you have any national policy issue that you think AA should be following up. If you know an AA member who is not receiving this advocacy report but wants to, then encourage them to email me and we can add them to the distribution list.
Kind Regards
Jenny Lambert OAM
National Policy Director
Accommodation Australia
| | | | |