|
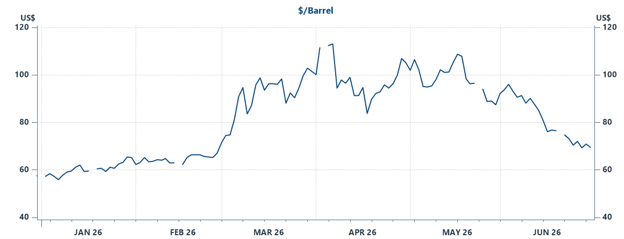
Source: EIA/CME/Haver, as of June 30, 2026
While traffic through the Strait has increased recently, it remains well below the levels seen in February. If negotiations ultimately lead to a full reopening and return of oil supply to global markets, this would be a positive sign for inflation through the remainder of the year.
The Takeaway
- Economic data, from jobs growth to retail sales, continues to indicate a growing economy.
- The outlier remains accelerating inflation data, but lower oil prices could lead to improvement going forward.
Looking Ahead: Crosscurrents Worth Monitoring
Moving forward, there are three stories to monitor:
- Reopening the Strait over the next 30–60 days and allowing oil prices to stabilize at current levels would go a long way to reduce pressures on consumers and businesses. Any setbacks could push oil prices back up quickly.
- Despite the recent drop in oil prices, Chairman Warsh made it clear that policymakers remain focused on inflation. Warsh reiterated the Fed’s commitment to its 2 percent inflation target and signaled little willingness to adjust policy based on declining oil prices alone. If rates do rise, it could pressure markets.
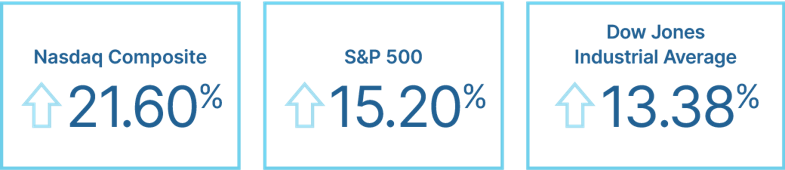
- Attention will soon turn to second-quarter earnings. Analysts are projecting approximately 22 percent year-over-year growth for the S&P 500. While this raises the risk of disappointment, recent history suggests resilience. Over the past five quarters, companies have continued to deliver strong results despite policy and trade-related uncertainties. If earnings momentum continues, it should provide a foundation for markets over the longer term.
Fundamentals drive markets over the long term, and they remain relatively solid for now. Solid jobs growth, continued consumer spending, and strong earnings growth should lead to economic growth and further market appreciation.
Uncertainty remains high and further short-term volatility is possible. However, a diversified portfolio that matches long-term goals and risk tolerance remains the best path forward. If concerns remain, please contact us.
Disclosure: This material is intended for informational/educational purposes only and should not be construed as investment advice, a solicitation, or a recommendation to buy or sell any security or investment product. Please contact your financial professional for more information specific to your situation.
Certain sections of this commentary contain forward-looking statements based on our reasonable expectations, estimates, projections, and assumptions. Forward-looking statements are not guarantees of future performance and involve certain risks and uncertainties, which are difficult to predict. Past performance is not indicative of future results. Diversification does not assure a profit or protect against loss in declining markets. All indices are unmanaged and investors cannot invest directly into an index. The Dow Jones Industrial Average is a price-weighted average of 30 actively traded blue-chip stocks. The S&P 500 Index is a broad-based measurement of changes in stock market conditions based on the average performance of 500 widely held common stocks. The Nasdaq Composite Index measures the performance of all issues listed in the Nasdaq Stock Market, except for rights, warrants, units, and convertible debentures. The MSCI EAFE Index is a float-adjusted market capitalization index designed to measure developed market equity performance, excluding the U.S. and Canada. The MSCI Emerging Markets Index is a market capitalization-weighted index composed of companies representative of the market structure of 26 emerging market countries in Europe, Latin America, and the Pacific Basin. It excludes closed markets and those shares in otherwise free markets that are not purchasable by foreigners. The Bloomberg Aggregate Bond Index is an unmanaged market value-weighted index representing securities that are SEC-registered, taxable, and dollar-denominated. It covers the U.S. investment-grade fixed-rate bond market, with index components for a combination of the Bloomberg government and corporate securities, mortgage-backed pass-through securities, and asset-backed securities. The Bloomberg U.S. Corporate High Yield Index covers the USD-denominated, non-investment-grade, fixed-rate, taxable corporate bond market. Securities are classified as high-yield if the middle rating of Moody’s, Fitch, and S&P is Ba1/BB+/BB+ or below. One basis point (bp) is equal to 1/100th of 1 percent, or 0.01 percent. The Magnificent 7 (Alphabet, Amazon, Apple, Meta Platforms, Microsoft, Nvidia and Tesla) are a group of seven companies commonly recognized for their market dominance, their technological impact, and their changes to consumer behavior and economic trends.
*************************
Sincerely,
The IEM Investment Committee
|