Dear Friends,
Here's my newsletter recapping the Arlington residential real estate market for single-family homes and condos, year to date (through June 2019).
The highlights:
|
|
Prices Have Leveled Off
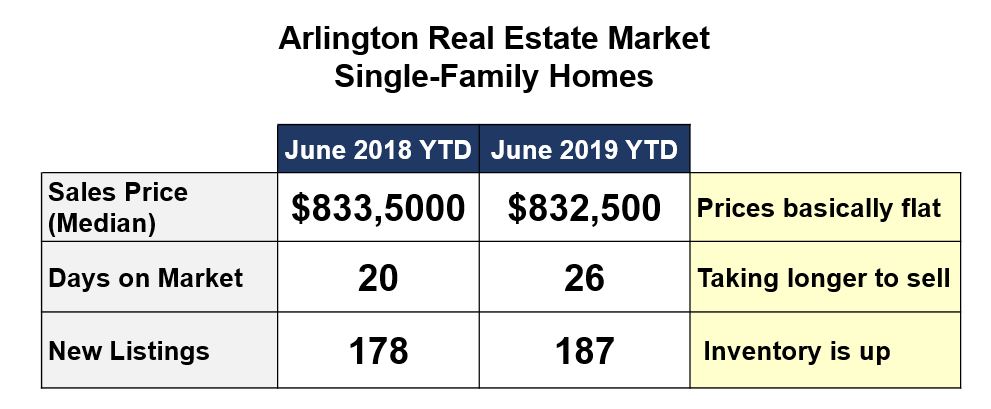
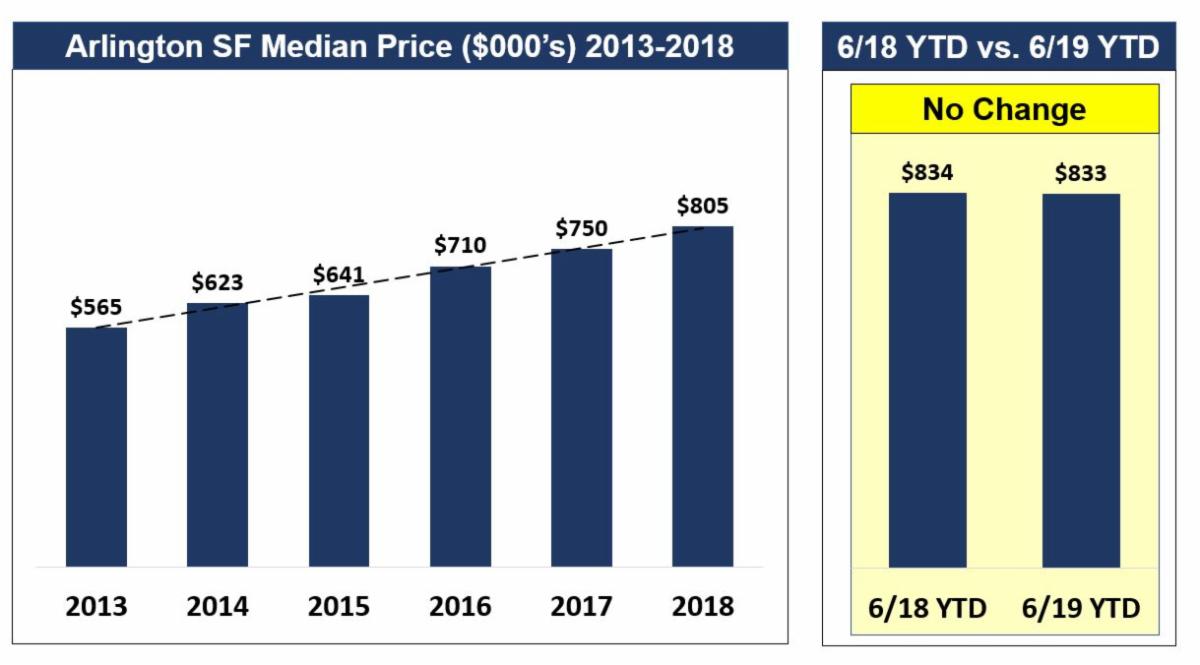
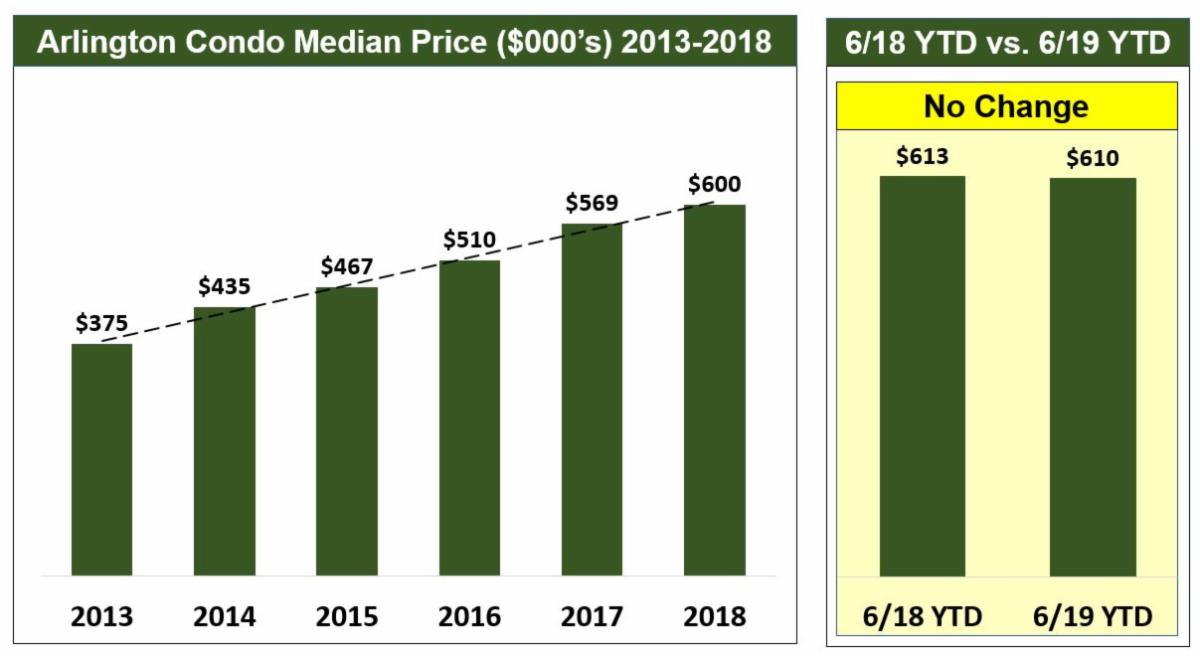
Maybe you've seen articles recently blaring that prices in the greater Boston area have been reaching record highs. In large part that's true. But it's also true that the rate of price rise has slowed considerably, and in Arlington it has leveled off. The median price for single-family homes sold in Arlington in 2019 through June was $832,500, down a little bit from the $833,500 reached during the same period in 2018. And the median price for condos in 2019 through June was $610,000, also down from the $613,000 seen through June 2018. It looks like the market the year has plateaued. But it's plateaued with prices pretty much at record highs.
Supply Has Inched Up, But It's Still a Seller's Market
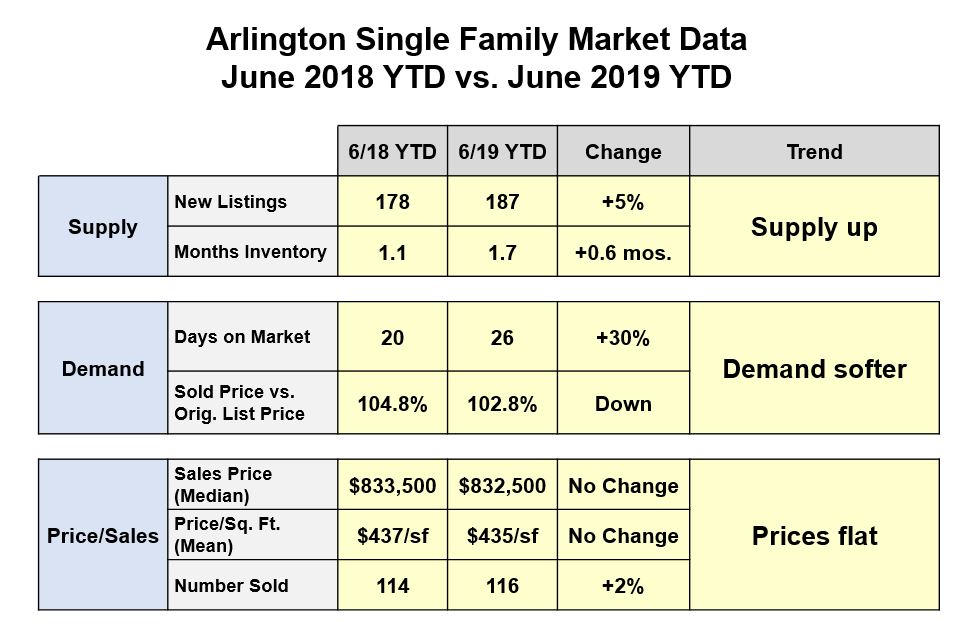
The supply of single-family homes coming on market increased somewhat in 2019 (up 5% over 2018). At the same time the number of homes being sold did not increase at the same rate, so there was a small increase in inventory (the number of homes available for sale at a given time). There was an increase as well in the condo market, as the number of condos coming on market was essentially flat, but the number sold decreased by 18%, resulting in a bump up in inventory.
Still, relative to what is viewed as a balanced market, where buyers and sellers have roughly equal bargaining power, Arlington continues to be very much a seller's market.
Demand Has Softened
Homes are staying on market longer (days on market for single-family homes was up 30% in June 2019 YTD versus June 2018 YTD, and DOM for condos was up 28%). And the premium over list price that properties were achieving in 2018 went down in 2019. There's still stiff competition for mid- and lower-priced homes, but it's not quite as crazy as it has been in recent years.
The Gorilla in the Room: Lower Mortgage Rates
The rate of price rise for homes can exceed the rate of wage increases for only so long before things slow down. It looks like that might be happening now.
And yet, if supply is up and demand is down, why aren't prices falling to the same extent? Part of the answer is that price increases are somewhat self-sustaining. Buyers and sellers have become used to prices rising 5% to 10% each year (as they have over the last six or seven years), and buyers naturally expected to pay more this year than last year. And when they found they could buy a house for the same amount as it would have cost last year, they may have thought that they had scored a bargain.
But most of the answer can be found in dropping mortgage interest rates. The rate for a 30-year fixed rate mortgage fell this year from 4.46% in January to 3.60% in August. Buyers might have had the ability to be slightly choosier about the homes they decided to buy, but as the cost of borrowing money kept declining, they could afford a higher priced home. The small changes in supply and demand seen so far in 2019 have not been enough to move the price needle very much in the face of dropping mortgage rates.
If you have any comments or questions on this or any other real estate-related matter, please
contact me
. I'd love to hear from you.
Warm regards,
Steve Poltorzycki
|
|
Arlington Real Estate Market Levels Off in the First Half of 2019
|
|
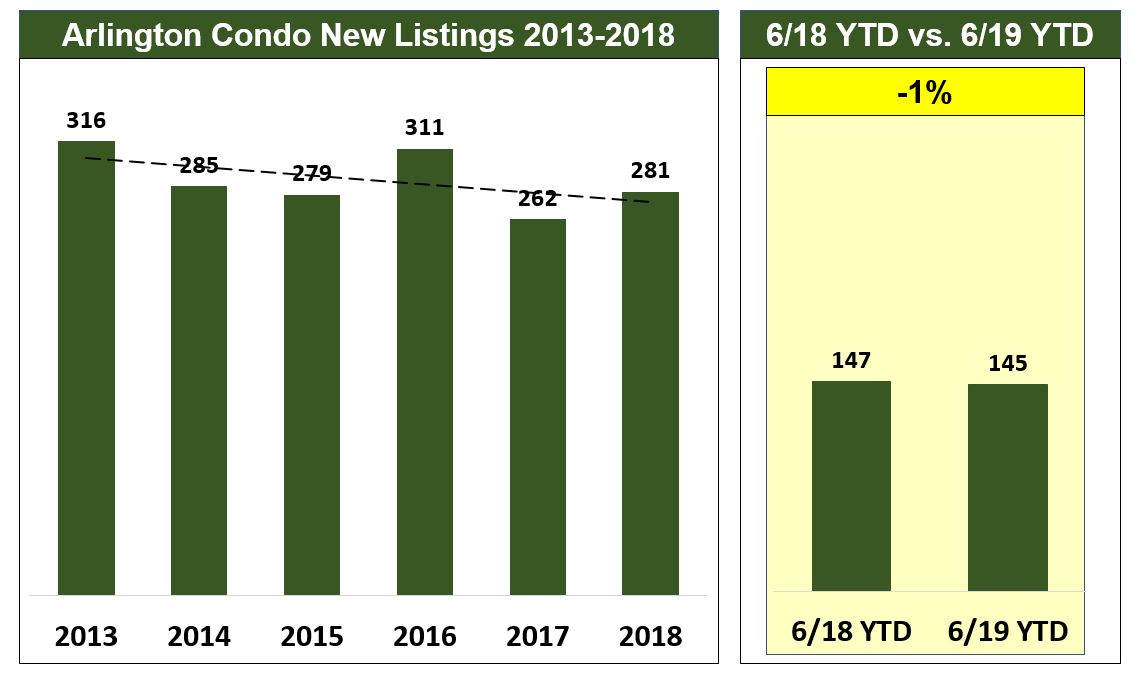
Supply Has Inched Up
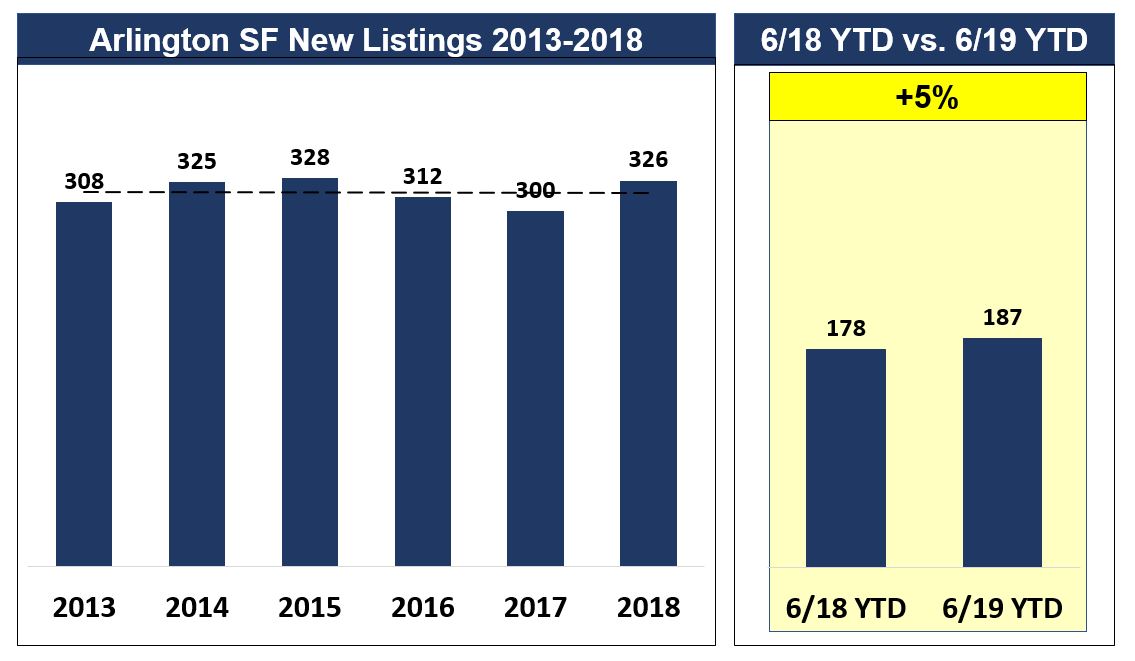
Single-family new listings were up 5% over 2018. While this is not a huge jump in new listings, it should be noted that 2019 new listings are on pace to be the most annual new listings since at least 2013. No doubt homeowners are trying to cash in on the record high prices we have been seeing the last few years.
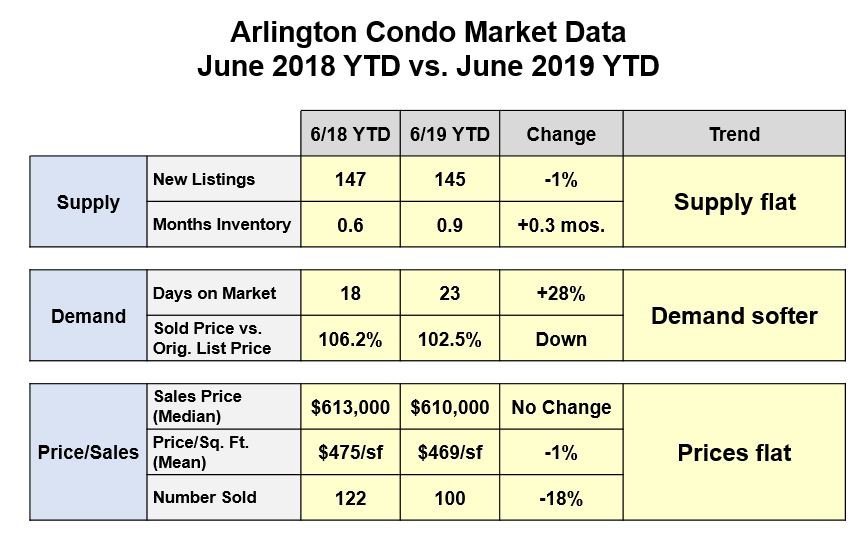
2019 condo new listings were essentially flat versus 2018.
|
|
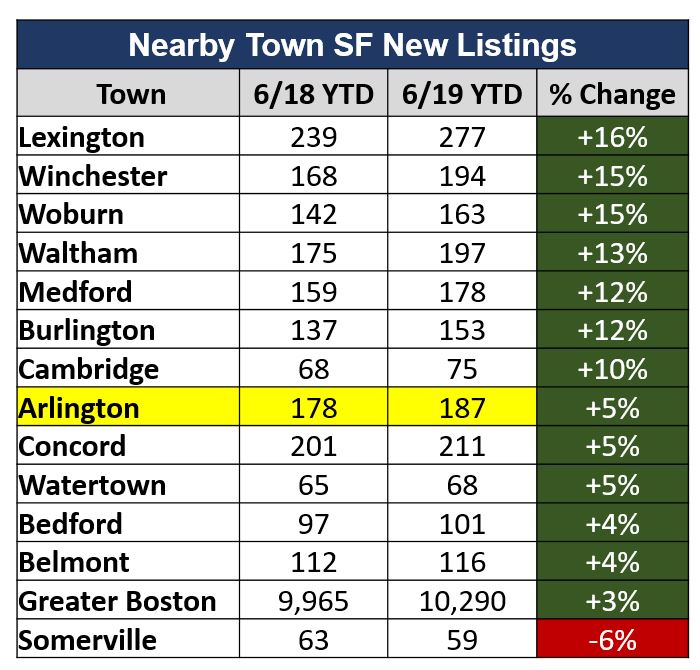
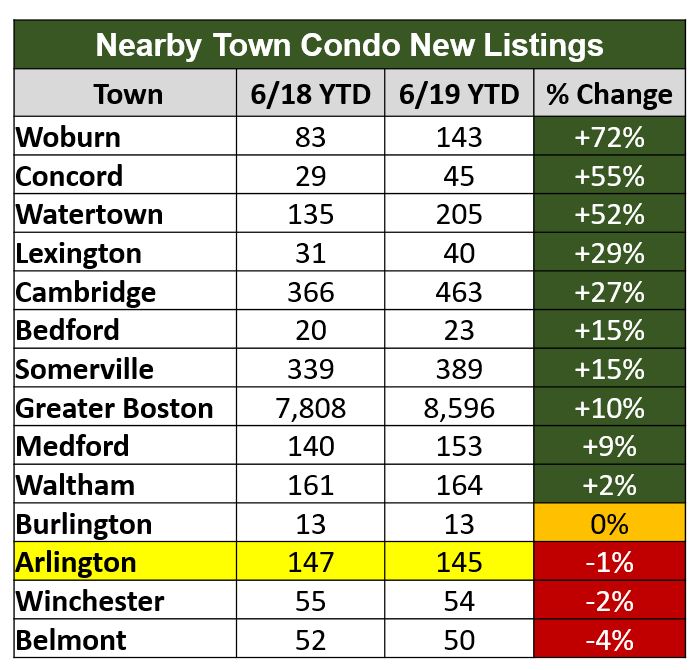
While Arlington single-family new listings increased in 2019 (and condo new listings remained about the same), when compared to the rate of rise of new listings in other nearby towns, it becomes clear that Arlington is lagging behind. The condo market in other nearby towns has benefitted from a boom in new developments coming on market in towns such as Woburn, Watertown, Lexington, and Cambridge. What's the significance of this? Just that when buyers find not so much inventory on the shelves in Arlington and check out other nearby towns, they might find more to choose from there. New listings rose in towns with higher median prices than Arlington as well as in towns with lower median prices. Buyers have been able to comparison shop within their price range and find alternatives to homes in Arlington. As a result of this competition, Arlington sellers could find it takes longer to sell and therefore may need to drop their asking price.
Note: “Greater Boston” refers to the 64 communities with the Greater Boston Area Associations of Realtors (GBAR) jurisdictional area, from North Reading to the north, Hudson and Hopkinton to the west, and Mansfield to the south. These communities are virtually all within the I-495 belt. See
www.gbreb.com
for the complete list.
|
|
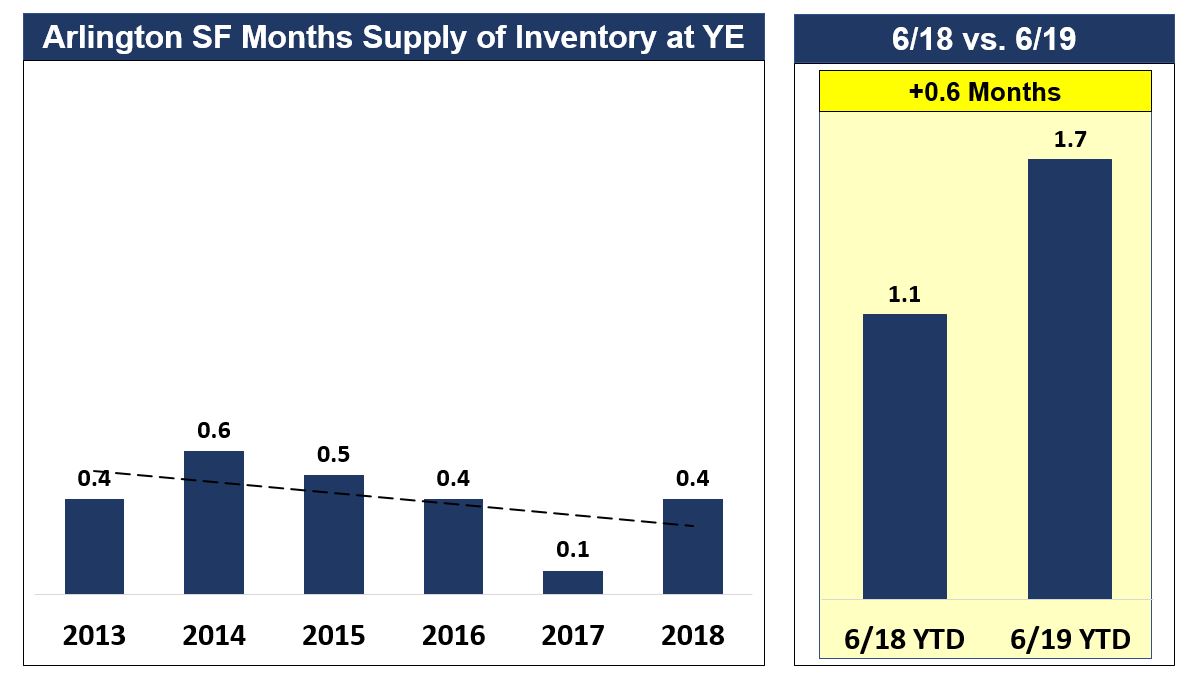
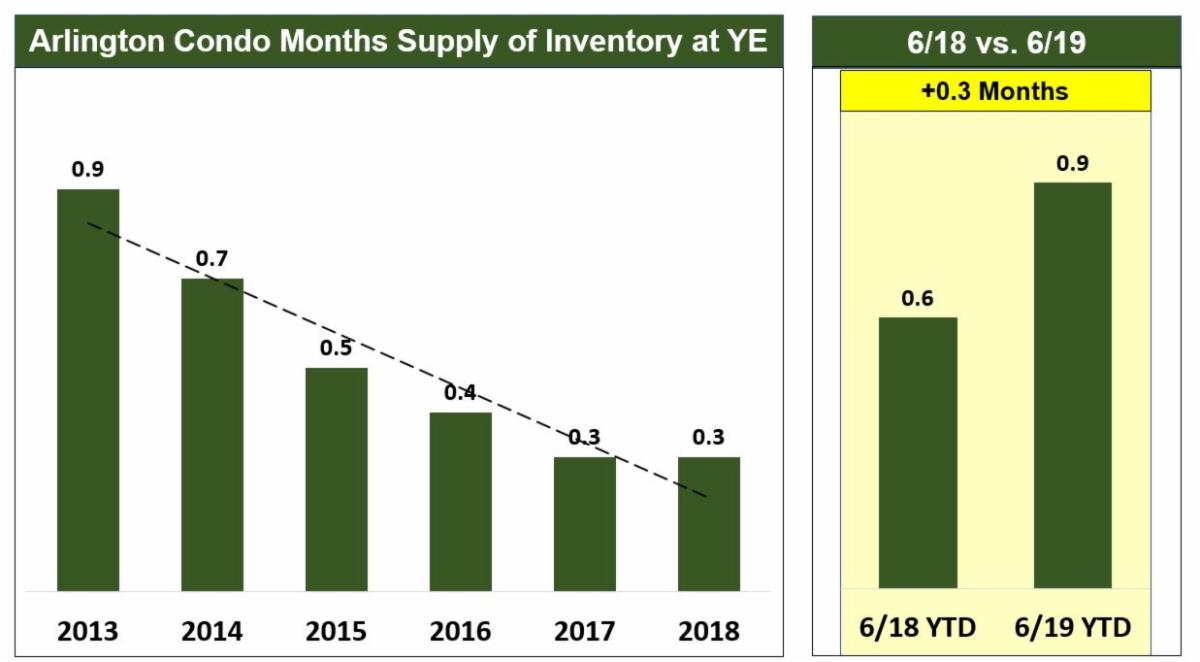
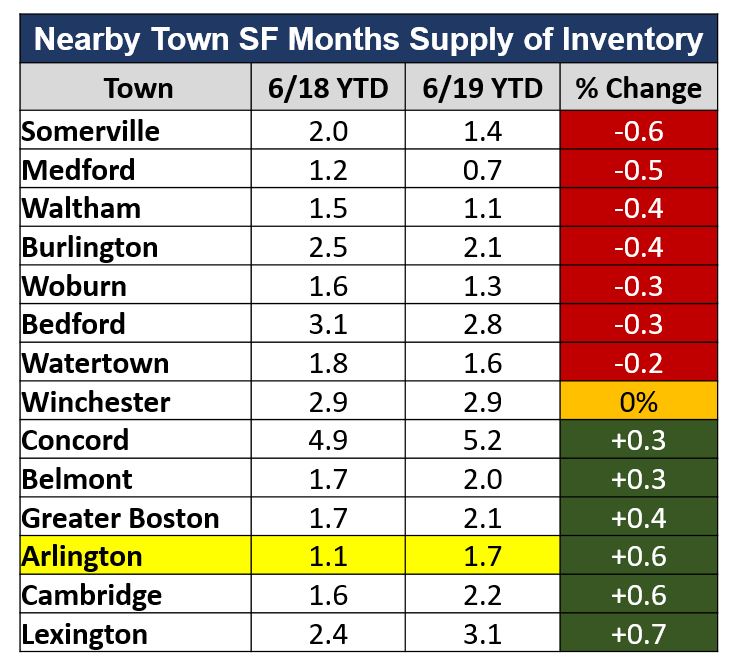
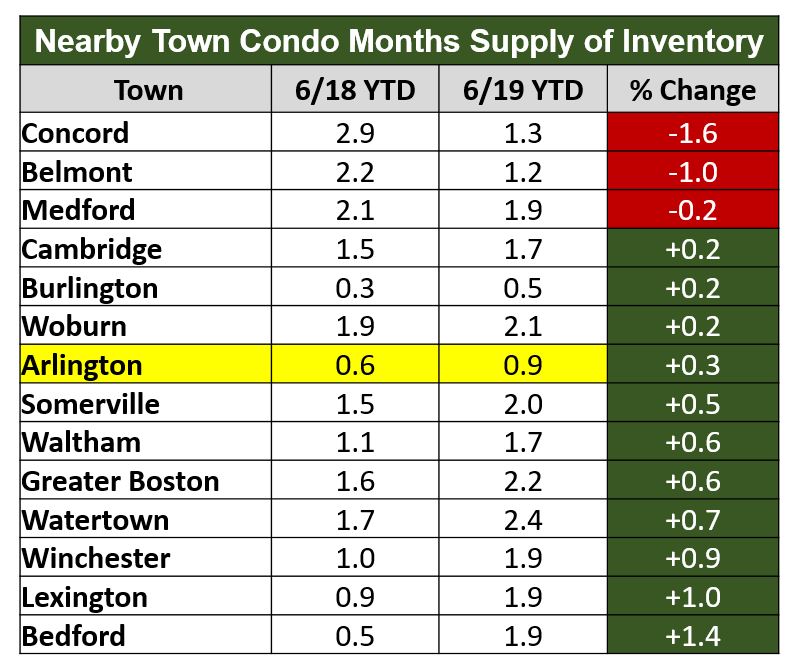
How about months supply of inventory as a measure of supply? Keeping in mind that six months supply represents a balanced market, where the respective bargaining positions of sellers and buyers are roughly equal, we see that for Arlington single family homes there was less than two months supply at the end of June 2019 (1.7 months). This was up a bit from end of June 2018 (1.1 months) and also from year-end months supply in the preceding several years, but still shows that a strong seller's market continues to exist in Arlington. Months supply of condos was also up a bit in June 2019 versus June 2018, but remained at less than one months supply (0.9 months). Arlington supply has had trouble keeping up with demand for some time now.
|
|
Arlington single family months supply of inventory in June 2019 was lower than in many other nearby towns (and the Greater Boston area as a whole), showing Arlington still to be among the most favorable towns for sellers. But unlike some of these towns where months supply declined year over year, Arlington's went up somewhat. The small build up of inventory in Arlington, the Greater Boston area, and towns such as Lexington and Cambridge may be a sign that the market in starting to slow down in those areas.
While months supply of single-family inventory in nearby towns was a mixed bag, with inventory in some towns increasing and in other towns decreasing, months supply of condos was more one-sided, with inventory increasing in the majority of towns, including Arlington. When there are changes afoot in a local real estate market, the changes tend to appear first in the condo segment of the market, so this increase in inventory may be significant. But at least as far as Arlington goes, condo inventory, while showing a slight increase year over year, was still tighter than in practically all nearby towns.
|
|
Buyer Demand Softened
What about the demand side of things? There are three useful measures of demand. There’s days on market, which is a measure of the time between when a property is listed and when it goes under agreement. The more demand, the shorter the days on market, as properties don’t stay on the shelves very long in the face of very high levels of demand. Then there’s the difference between the price at which a property sold and the original list price. If properties sell for more than their original list price, it’s fair to say there’s a high level of demand. Buyers don’t pay more than asking price unless they face stiff competition from other buyers. And lastly, there’s the size of price reductions. Higher price reductions can be a sign of softening demand.
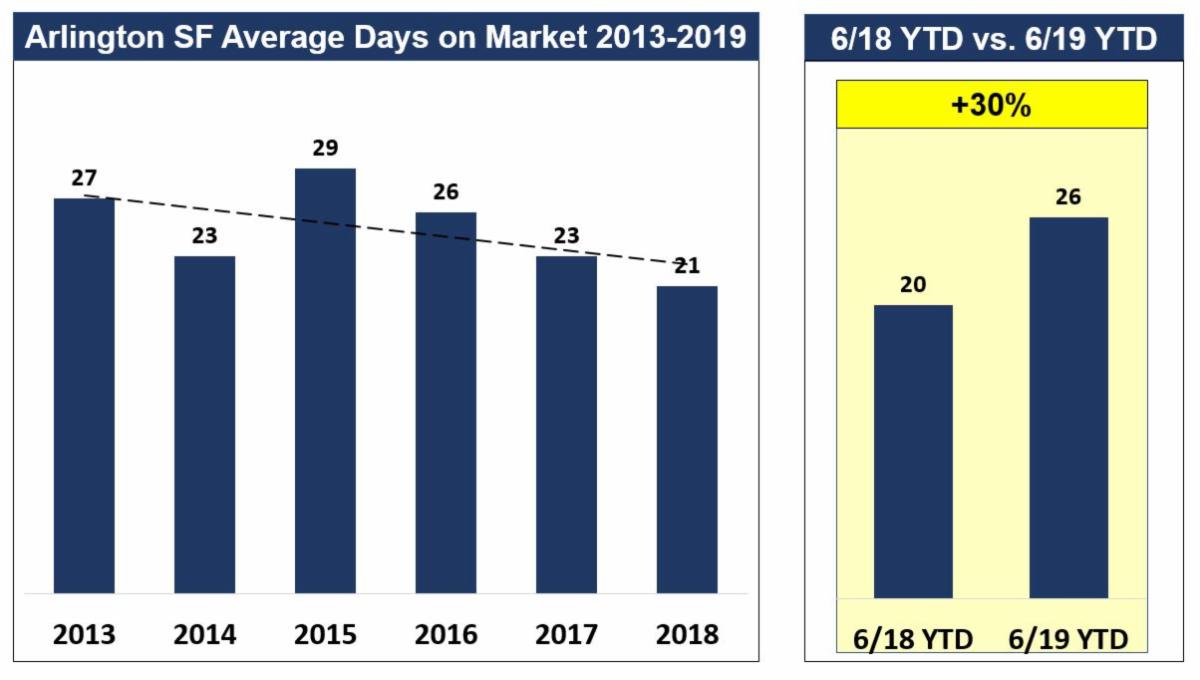
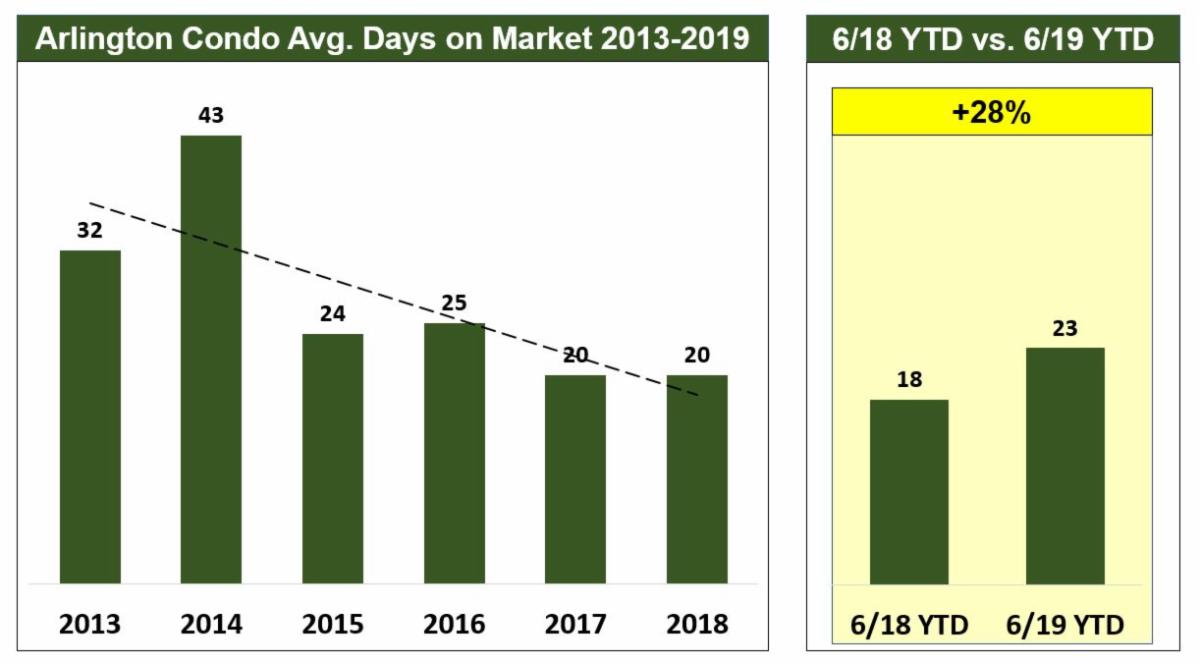
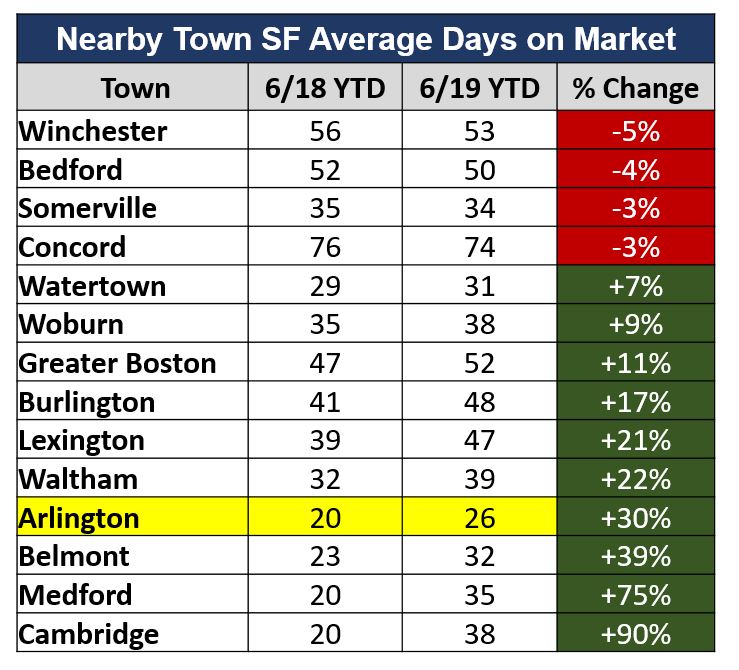
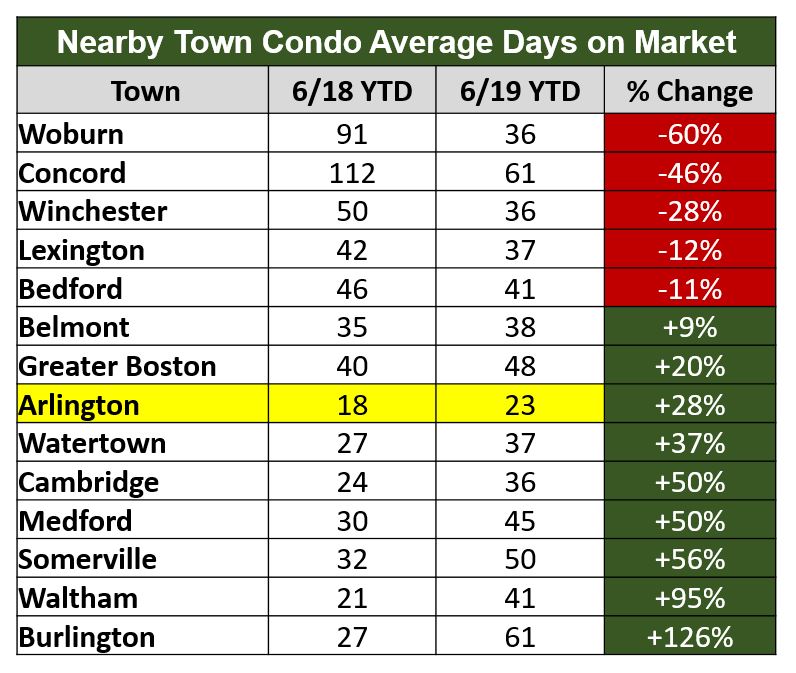
Through June 2019 Arlington single-family and condo days on market both increased versus the same period last year (26 DOM vs. 20 DOM for single-family homes, and 23 DOM vs. 18 DOM for condos). On the surface, this would appear to be is a clear sign of some softening of demand.
|
|
However, two things should be mentioned. One is that 26 or 23 DOM is still a very short amount of time for a property to be on market, reflecting continued high demand. The other is that Arlington single-family and condo DOM was shorter than DOM in every other nearby town, shorter than even red-hot Cambridge (38 DOM single-family/36 DOM condo), Medford (35/45 DOM), and Belmont 32/38 DOM). Demand for homes in Arlington continues to be stronger than in most other nearby (competing) communities. But it should also be mentioned that in virtually all other neighboring communities, DOM did not increase as much as in Arlington (for single-family homes), and in some cases, DOM decreased, showing that demand in these communities may be on its way to catching up to Arlington. This is also the case, to a lesser extent, for condo DOM in these other communities.
|
|
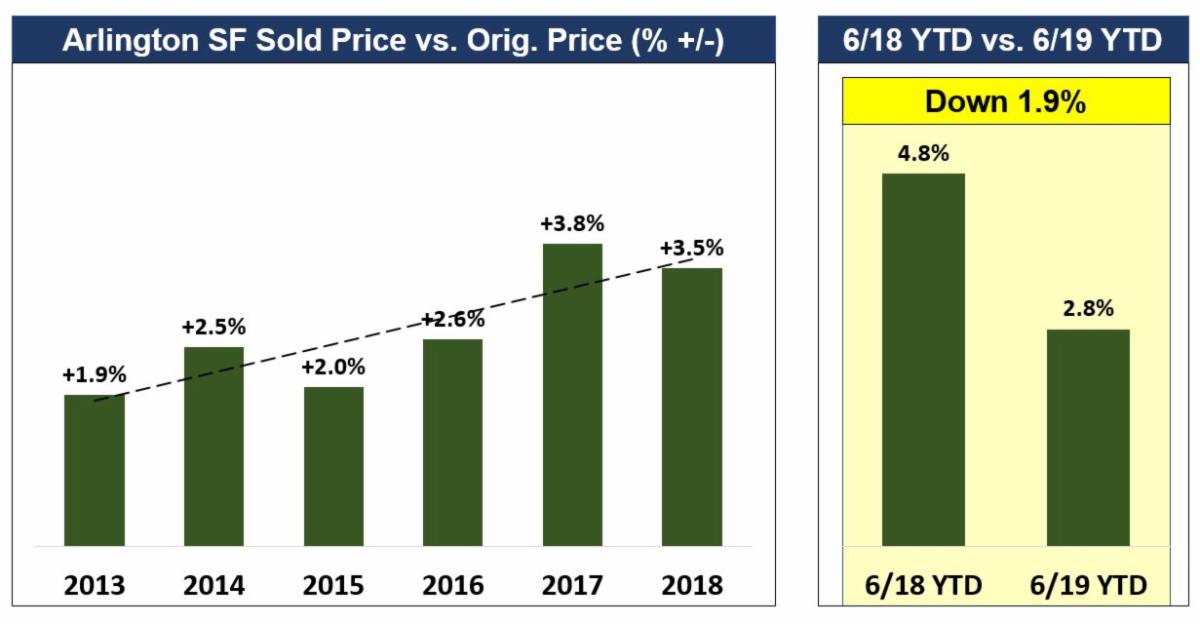
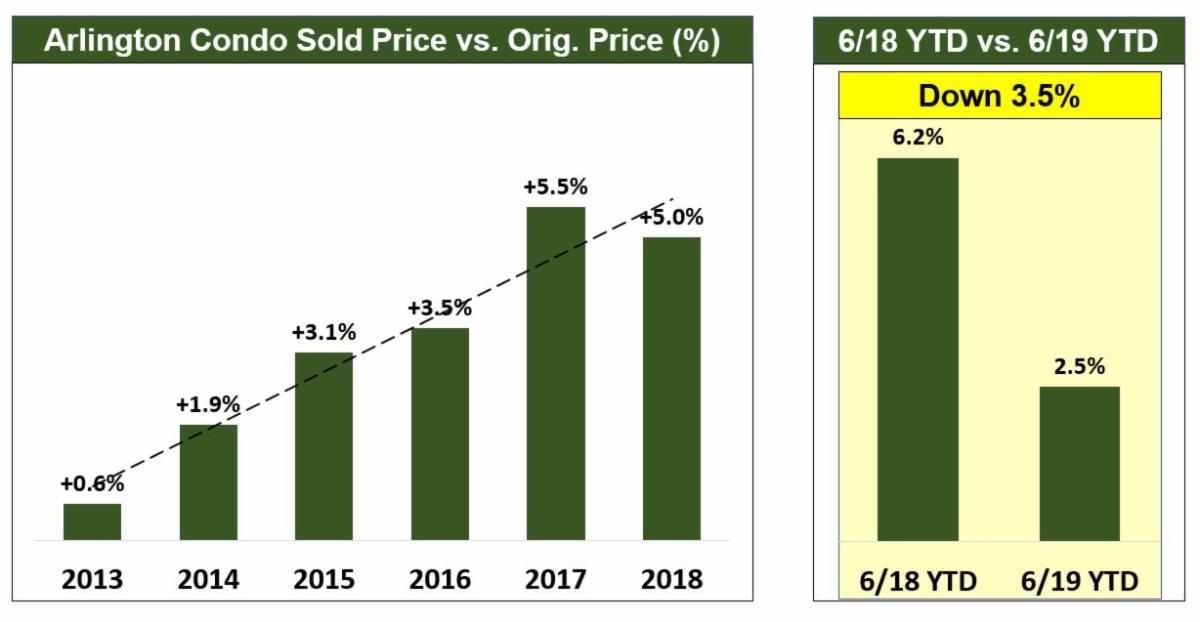
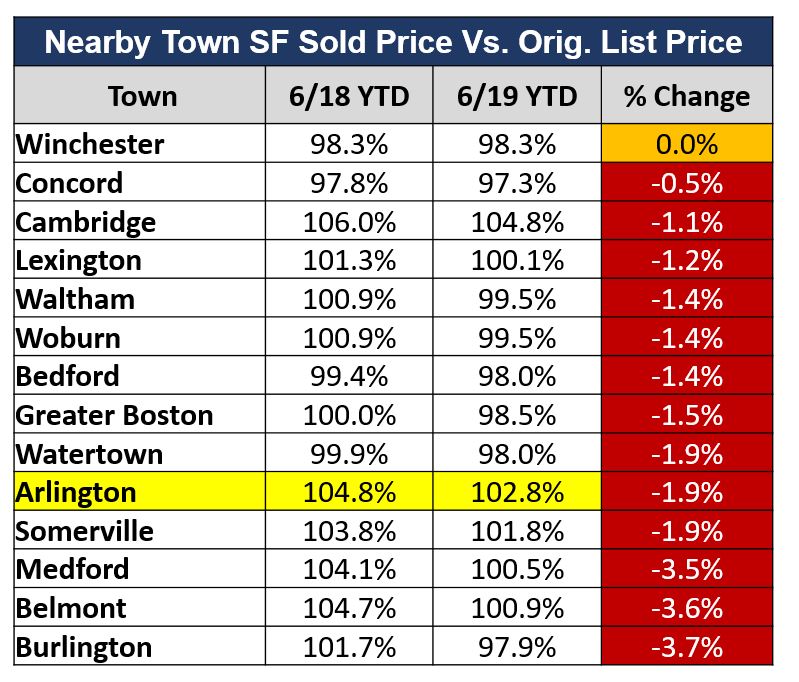
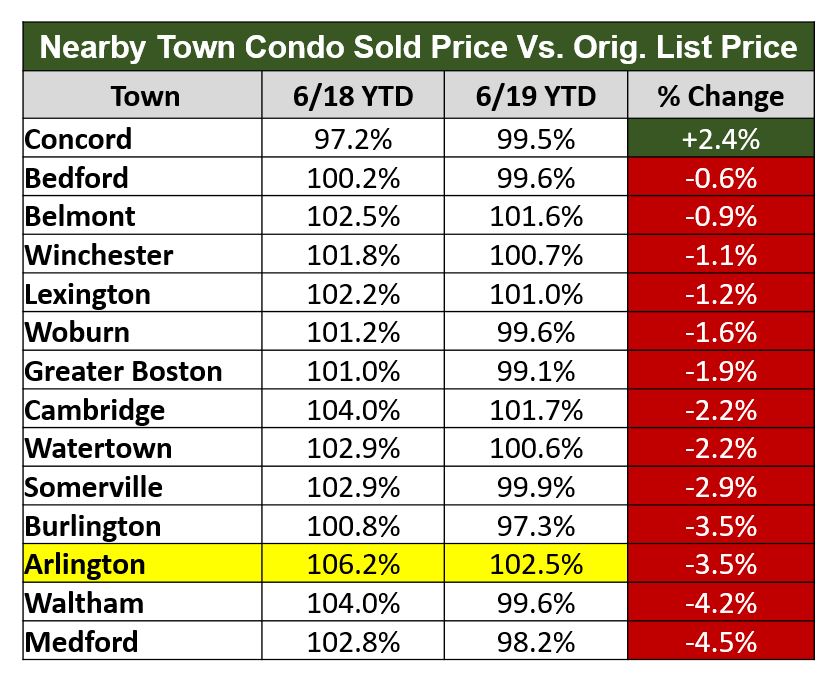
Arlington single-family homes and condos sold for over original list price, but by not nearly as much as during the same time period in 2018, with single-family homes selling for 102.8% of list in 2019 vs. 104.8% of list in 2018, and condos selling for 102.5% of list in 2019 vs. 106.2% of list in 2018. Demand has slipped from red hot to just hot.
|
|
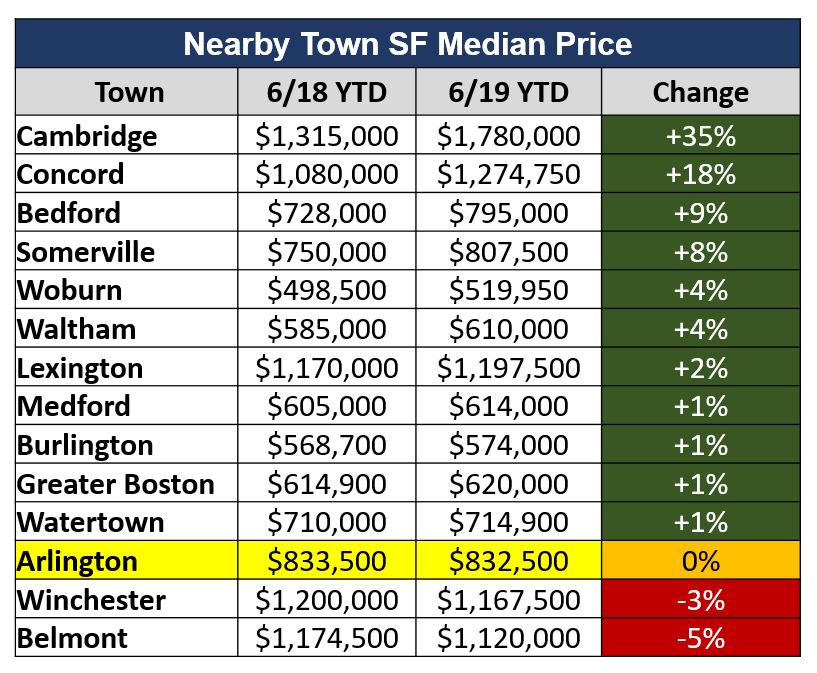
However, demand for homes in Arlington as reflected by the premium over list price (102.8% for single-family and 102.5% for condos) is still higher than demand in virtually all other nearby towns. Single family homes sold for a higher premium over list price only in stratospheric Cambridge (104.8%), whereas homes in nearby upscale communities such as Lexington (100.1%), Belmont (100.9%), and Winchester (98.3%) sold for a smaller premium versus list or even at a discount versus list. Similarly, there was no nearby town in which condos sold at a higher premium to list price than condos sold for in Arlington. And condos in communities such as Somerville (99.9%), Bedford (99.6%), and Medford (98.2%) sold at a discount to list. What all this may mean is that demand may be softening across the board in the greater Boston area (as reflected in the data for Greater Boston in the tables below).
One caveat should be noted about this metric. It relies on sellers (with the help of their agents) setting a realistic original asking price. Only then can we read any significance to the market showing a variance from that asking price. But in the hottest sectors of the market, it is not unusual for sellers to set an asking price below what they expect the property to sell for in the hope that a lower than market value asking price will attract a larger pool of potential buyers who will submit multiple offers, thus creating a bidding war that will drive the final selling price to a point beyond what it would otherwise reach.
And it is also the case that sellers in very hot markets may set an overly optimistic high price with the expectation that the market will continue to soar to unrealistic heights. Then, when they need to sell for a lower price, it looks like the market is softening, when it is just correctly for unrealistically high list prices.
Even with those factors in mind, sold price versus original list price is still a useful metric, particularly when looked at to corroborate other metrics of demand.
|
|
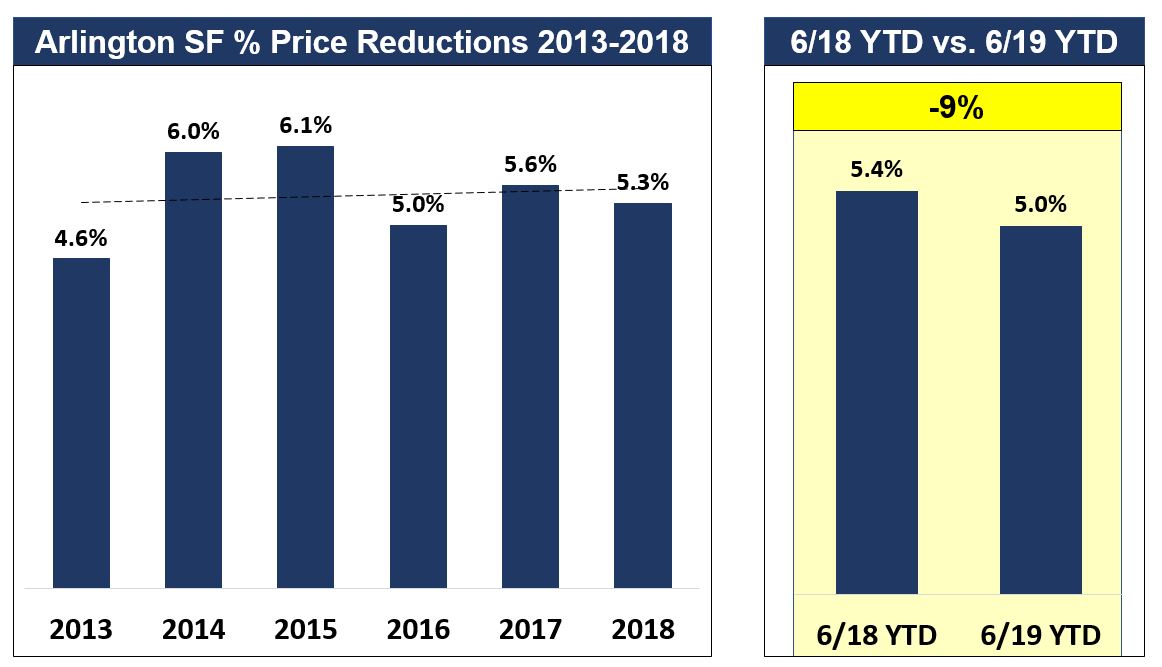
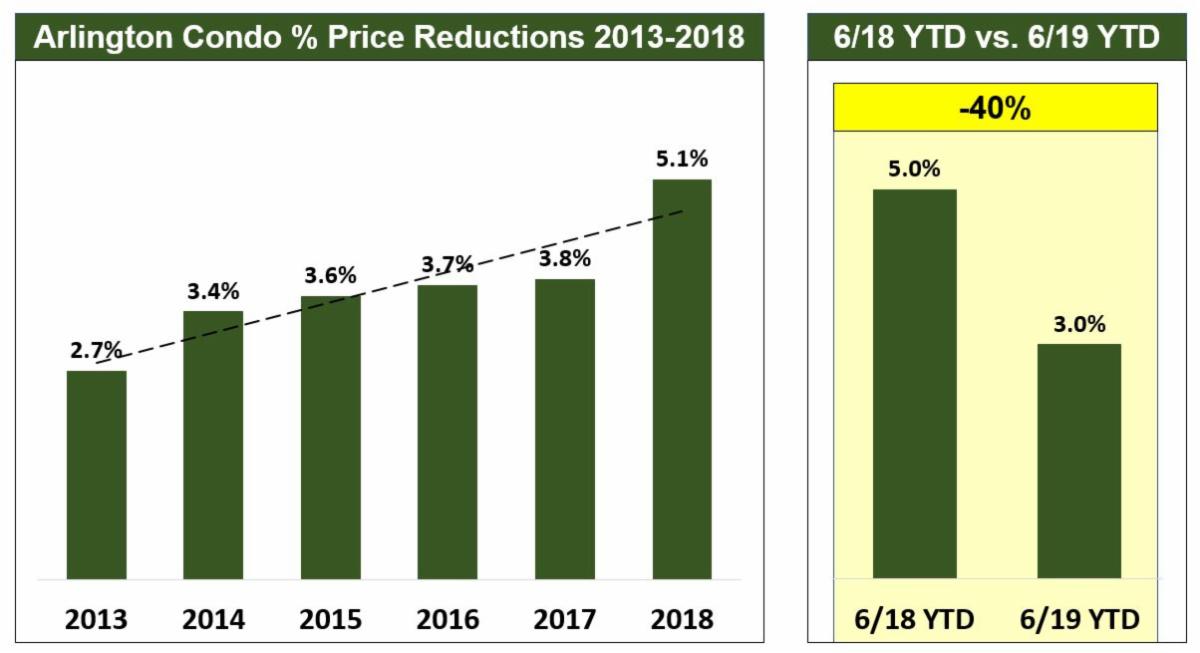
The magnitude of price reductions is another measure of strength of demand. The amount by which asking prices need to be lowered so as to attract offers can be seen as a reflection of the level of buyer interest in the properties on market.
The average amount of single-family price reductions decreased by 9% year over year (from 5.4% through June 2018 YTD to 5.0% through June 2019 YTD), hardly a significant amount, but, still, an indicator of a continued strong market and a good sign for sellers.
And the picture was even better for sellers of condos, where average price reductions decreased by 40% (from 5.0% through June 2018 YTD to 3.0% through June 2019 YTD), showing a strength of buyer demand that was not evident in the days on market and sold price vs. list price data.
|
|
As with sold price vs. list price data, some caution needs to be exercised when determining the significance of the price reductions data. If the magnitude of price reductions went up it could because buyer demand went down. But it could also be because some sellers, seeing how hot the Arlington market has been of late, became overly optimistic about the prices their homes would fetch. They might have overshot the market and needed to adjust their price when the market spoke. There is no magic formula for setting an asking price. Sellers, with the advice of their agents, decide what price to ask, and emotion often plays a significant role in the decision.
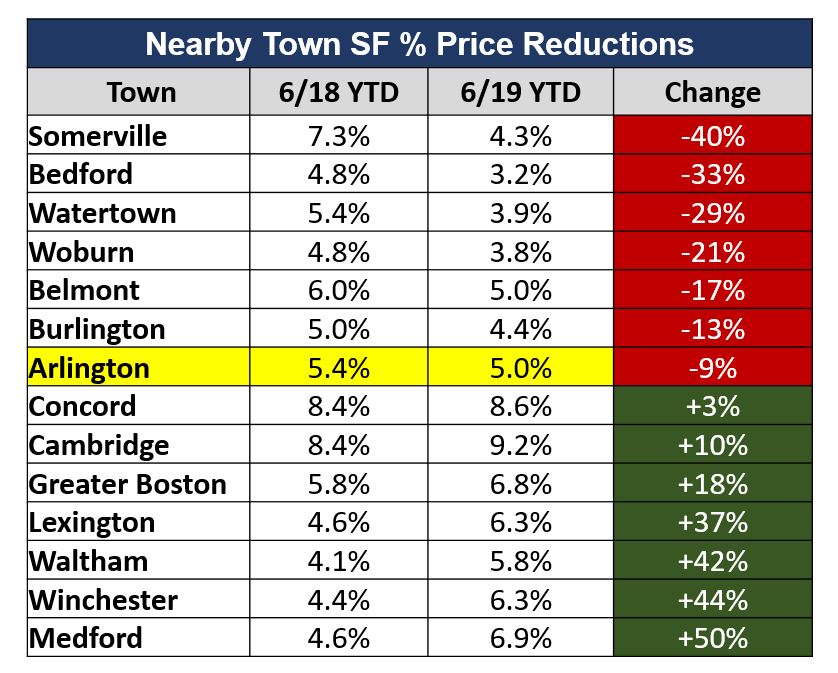
Let's look at Arlington's situation compared to that of other nearby towns. While this might not shed light on whether sellers overshot the market when deciding on their list prices or on whether price changes were due to changes in buyer demand, it still could tell us how buyer demand in Arlington compares to nearby (competing) communities.
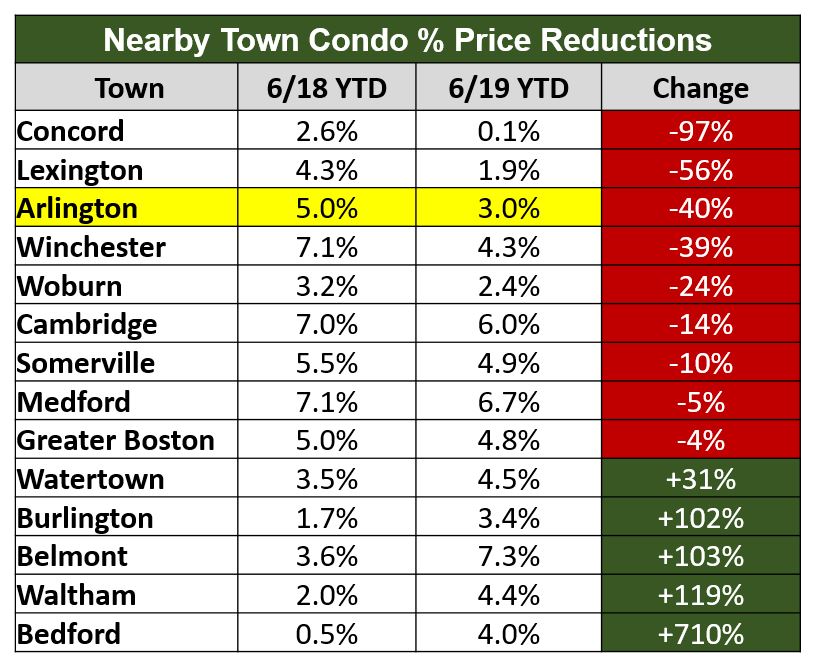
Arlington single-family homes, with average price reductions of 5.0% in June 2019 YTD, did not require the same level of price reduction to get sold as did homes in the greater Boston area (6.8%), or in nearby towns such as Cambridge (9.2%), Medford (6.9%), Lexington (6.3%), or Winchester (6.3%). Similarly, the average price reduction needed to get Arlington condos sold (3.0%) was less than the reduction needed in the greater Boston area (4.8%) or in nearby towns such as Belmont (7.3%), Medford (6.7%), Cambridge (6.0%), or Winchester (4.3%).
And yet in several of these nearby communities the price reduction needed to get single-family homes sold decreased to a greater degree than in Arlington, suggesting a greater growth in buyer demand in those towns than in Arlington. We can conclude that while buyer demand in Arlington remained strong, year over year, demand in some nearby communities was on its way to catching up.
|
|
Summing up the demand side of things: demand for Arlington single-family homes and condos softened a bit through the first half of 2019 versus the same time period in 2018. The situation is not quite as crazy as it has been in recent years, where many homes attracted multiple offers without any strings attached (such as the right to conduct a home inspection). There are now fewer multiple offer scenarios, buyers can better protect their rights, they can be a little bit choosier, and they often don't have to pay a premium over list price. With all that said, in comparison to the situation in many nearby communities, the demand for homes in Arlington is still quite strong (though the strength of buyer demand in some of those communities is starting to catch up to Arlington's).
|
|
Single-Family Home Prices Stay at All-Time Highs
Changes in supply and demand affect price. But it's not a perfectly efficient market and it can take some time before a change in either supply or demand is reflected in a change in price. Also, when changes in supply and demand are fairly small, as they were in Arlington in the first half of 2019, the resulting impact on price can also be small. The single-family home median price over the first half of 2019 was virtually identical to the median price in the first half of 2018.
And there was a similar situation in the Arlington condo market. The median price for the first half of 2019 was just about the same as the median price over the same period in 2018.
So the rate of price rises has slowed or even leveled off. Nevertheless, it can't be denied that both Arlington single-family home and condo prices have risen every year since 2012, and over that period prices have risen by 57% for single-family homes and by 68% for condos, a
rate of price rise that makes Arlington one of the strongest real estate markets in the Boston area.
|
|
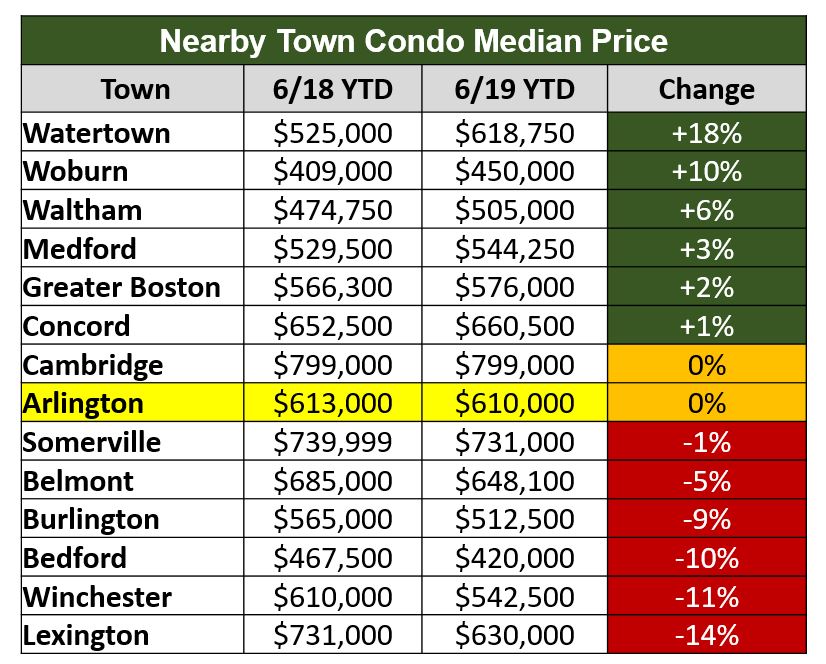
Still, the hotness of a market is a relative thing. And while the rate of price rise of Arlington single-family homes during the first half of 2019 versus the same period in 2018 was just about the same as the price rise in Greater Boston, it was anemic in comparison to the steep price rises in a number of nearby communities, such as Cambridge and Concord for single-family homes, and Watertown and Woburn for condos. The strengthening of demand in these communities has manifested itself in a rise in median prices, with the condo market in Watertown in particular booming this year (due to a combination of good location and upgraded housing stock).
|
|
It is useful to check the median price data against price per square foot figures. If there is not a close correspondence between the two it would suggest some price band is having an disproportionate influence on the results. Typically, the larger (and more expensive) the house the lower the price per square foot. A number of factors go into this, including house value to land value ratios, marginal cost, and so on, but the rule of thumb holds true.
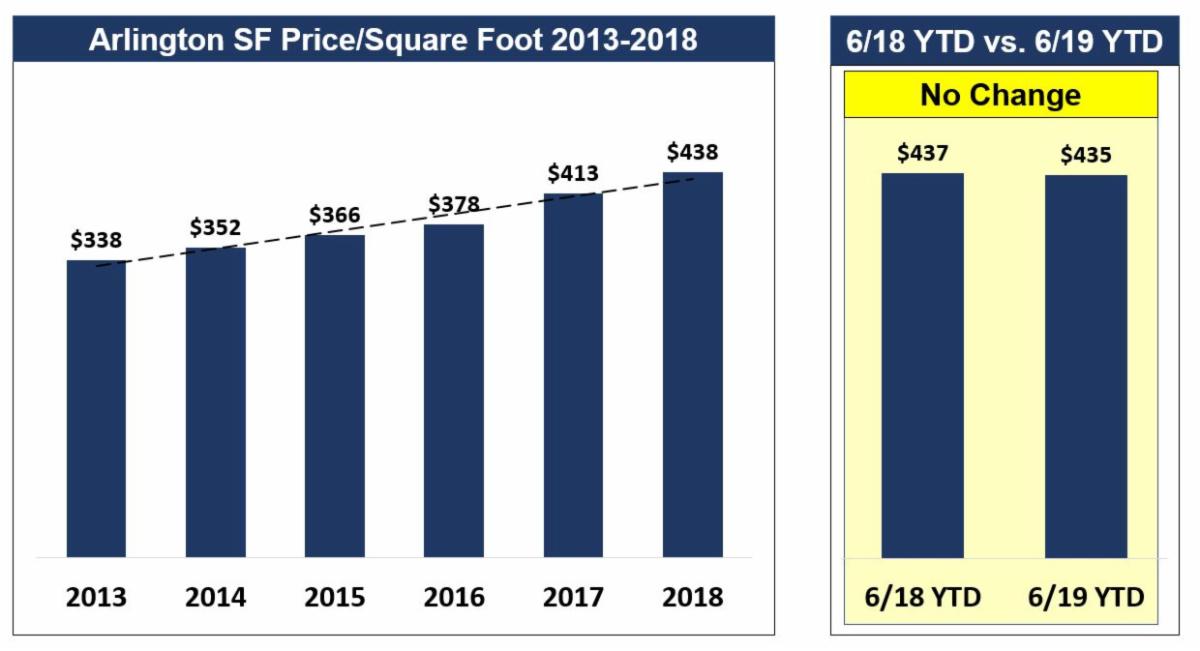
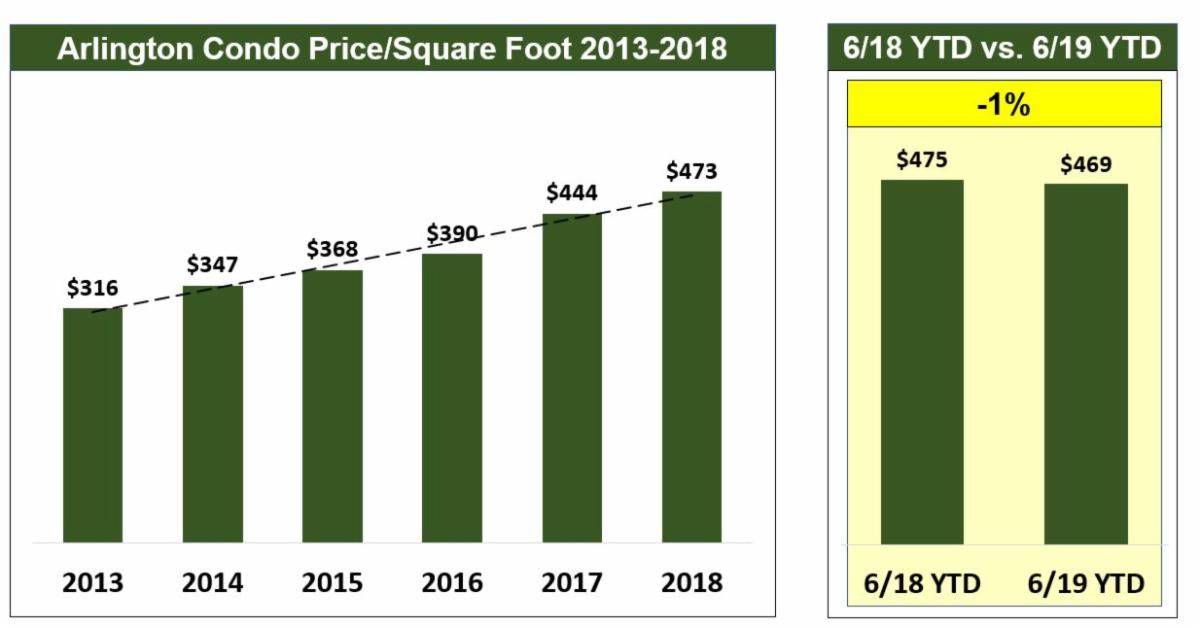
Per square foot prices in 2019 through June for both Arlington single-family homes and condos were essentially flat versus the same period in 2018. This tracks closely to the situation for median prices, underscoring the conclusion that the Arlington market has leveled off.
|
|
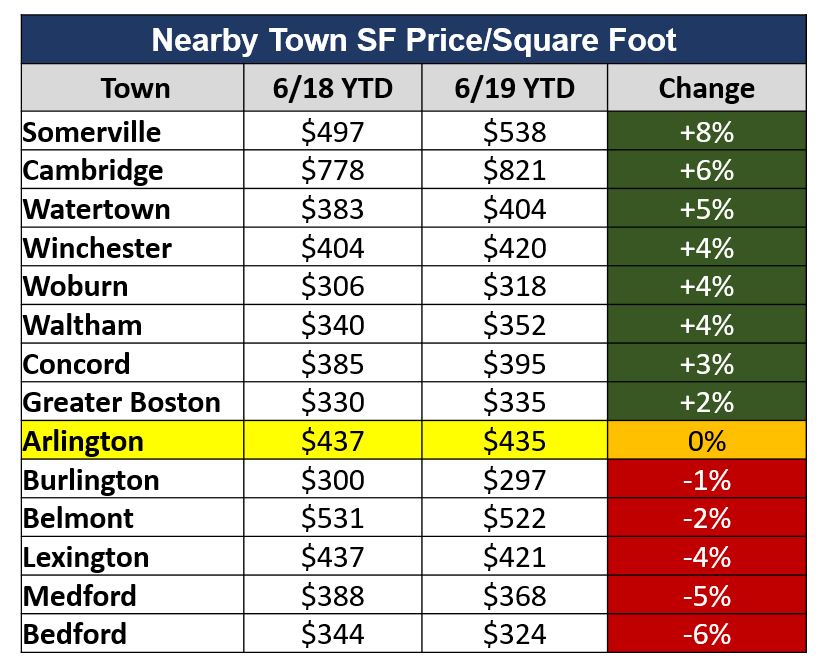
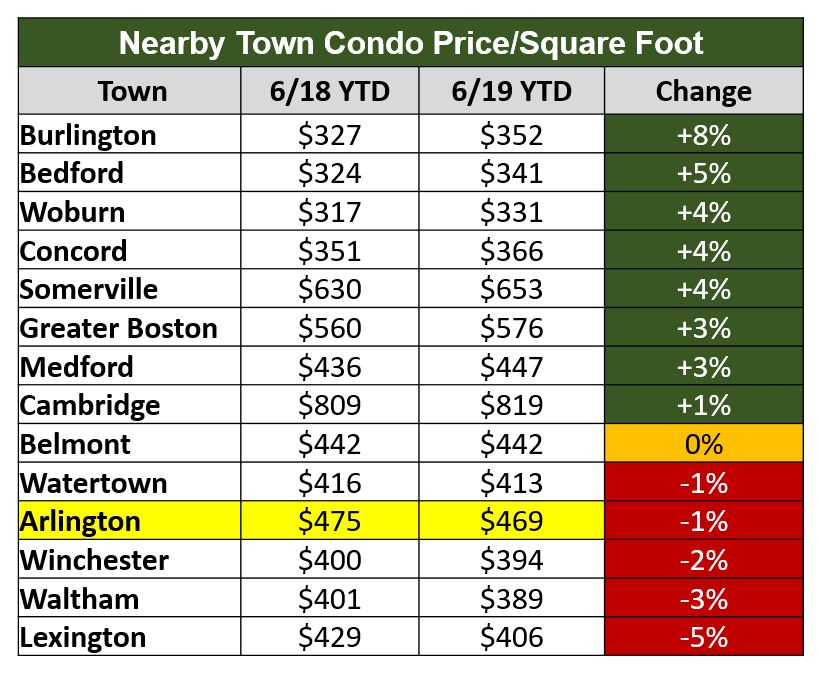
And when we look at the situation in nearby towns, we see that there were healthy rises in prices per square foot in some of these towns, indicating that the market in those towns could be strengthening versus Arlington's.
The silver lining in this is that buyers may find more value in Arlington than in certain other nearby towns. For example, the average per square foot price for Arlington single family homes ($425/sq. ft.) was lower in the first half of 2019 than in Cambridge ($821/sq. ft.), Somerville ($538/sq. ft.), and Belmont ($522/sq. ft.).
As for condos, the average per square foot price ($469/sq. ft.) was considerably lower in the first half of 2019 than in Greater Boston ($576/sq. ft.) (weighted heavily by the top-end condos in the City of Boston) and also nearby Cambridge ($819/sq. ft.) and Somerville ($653/sq. ft.).
This shows that, from a buyer’s point of view, Arlington single-family homes and condos are a good value in comparison to homes in some nearby towns, and, from a seller’s point of view, that the Arlington market will continue to attract buyers priced out of some neighboring markets. Many residents of Cambridge and Somerville have found Arlington an attractive place to move to when their growing families needed more living space and they could not afford what it would take to move up in size in their current towns.
|
|
Arlington home owners should be aware that the average size of single-family homes sold in Arlington has been considerably smaller than in other nearby communities that have had higher median sales prices. It may be that the lower sales prices in Arlington are more due to house size than to other factors, such as location. In that case, it may be advantageous for owners of smaller homes in Arlington to consider investing in renovation and expansion projects that could pay off when the home is sold down the road.
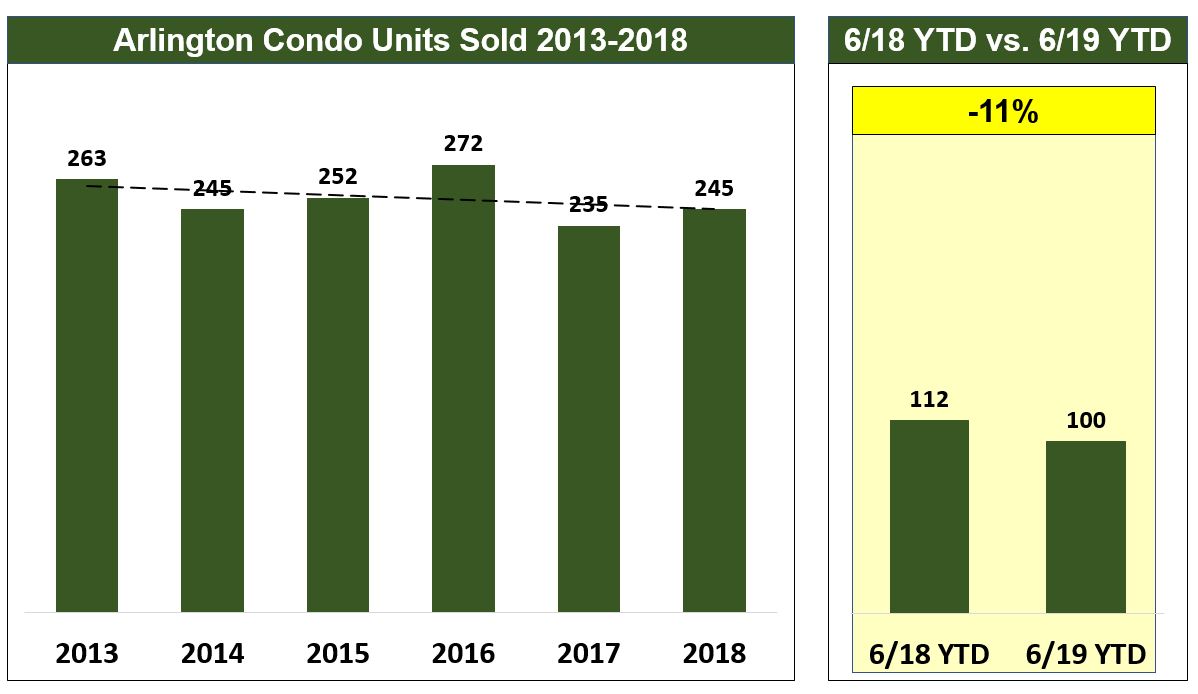
There is one last measure to examine related to the interplay between supply and demand: number of housing units sold. Number of sales is driven by both the number of new listings (supply) and the ability of the market to absorb those new listings (demand). If the number of sales goes down, this could be just as much due to a reduction in supply as a decrease in demand. So it’s important to look at what is going on with new listings in determining the significance of changes in number sold.
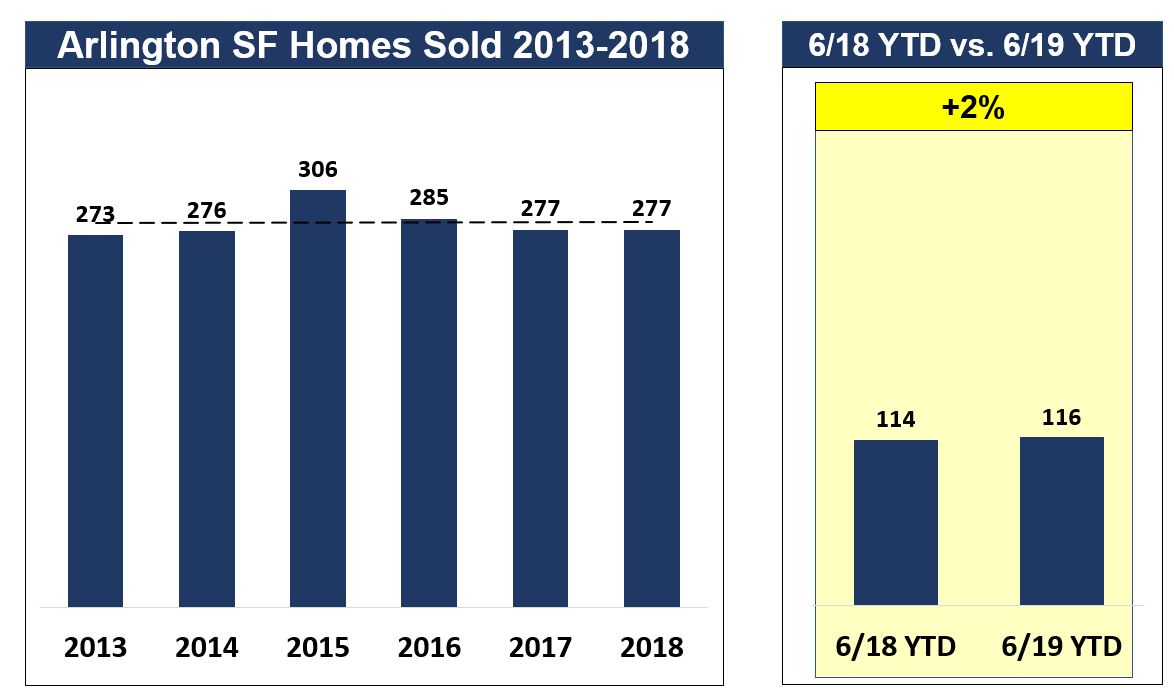
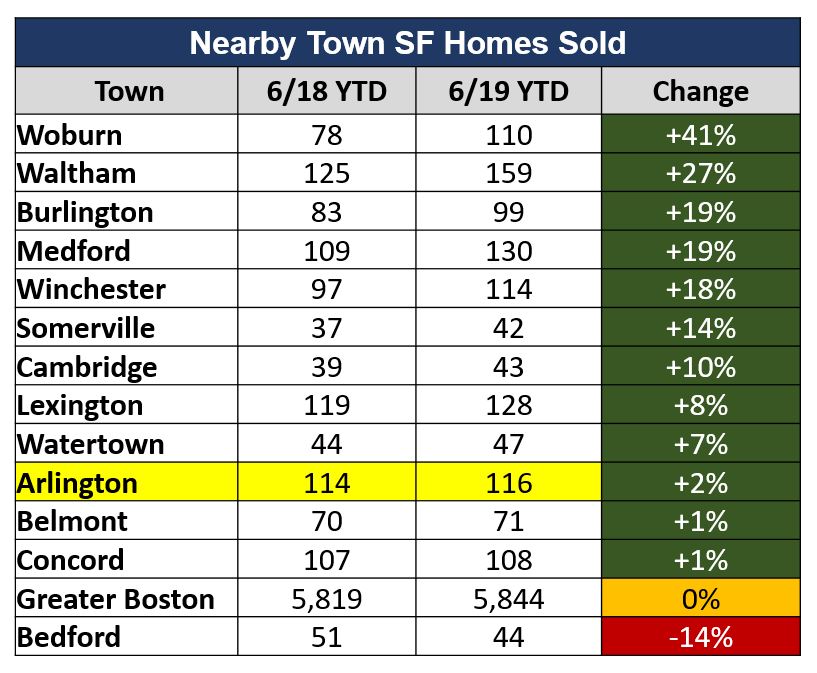
The number of single-family homes sold in the first half of 2019 (116) was virtually identical to the number sold during the same period in 2018 (114). Supply increased somewhat (5%) over this period, so one can conclude that the rate of home sales did not keep up with the pace at which homes were newly coming on market.
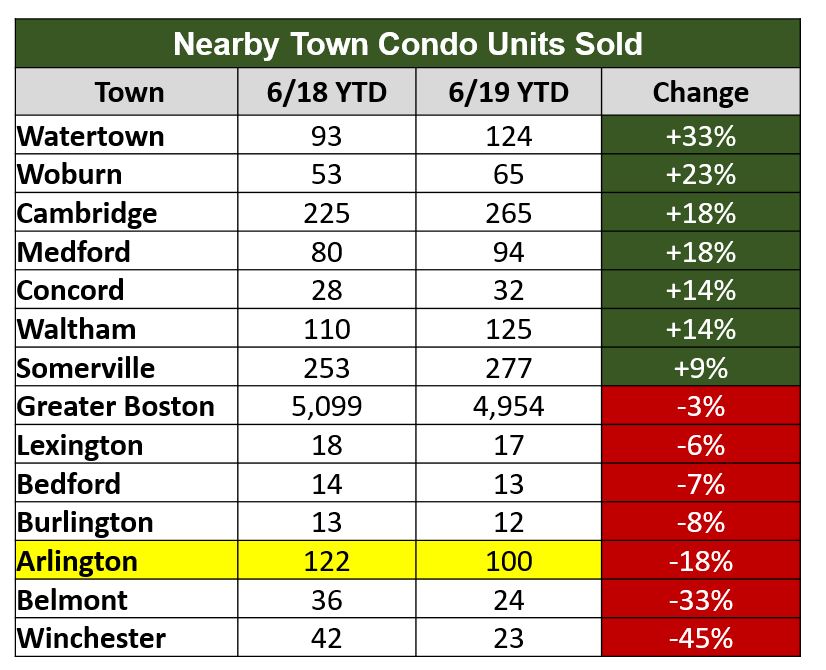
There was a similar dynamic in the Arlington condo market. The number of condos sold in 2019 went down to 100 versus 112 in 2018 while the number of new listings stayed about the same. Sales did not keep up with supply.
It is fair to say that this metric confirms some softening or plateauing of the real estate market in Arlington this year.
|
|
And sales seem to have picked up on a number of neighboring towns (and the greater Boston area as a whole), confirming what we have seen in some of the other metrics: the market in a number of neighboring towns is strengthening while the Arlington market, at least for now, is leveling off.
Not surprisingly, the markets have significantly strengthened in towns with more affordable price points than found in high ticket towns such as Belmont, Concord, Lexington, or Cambridge. Woburn, Waltham, Burlington, and Medford lead the way with hefty jumps in single-family homes sold, and these towns all provide good value for buyers, with prices per square foot under $400/SF (by way of comparison, Arlington single-family homes sold for $435/SF). And while Arlington condos declined in number of sales, sales in towns such as Watertown, Woburn, Cambridge, and Medford were booming. Developers in these towns have been successful in building large condo developments and converting older single-family and multi-family homes into condos, bringing on to the market units situated in good commuting locations, and stacked with up-to-date features.
|
|
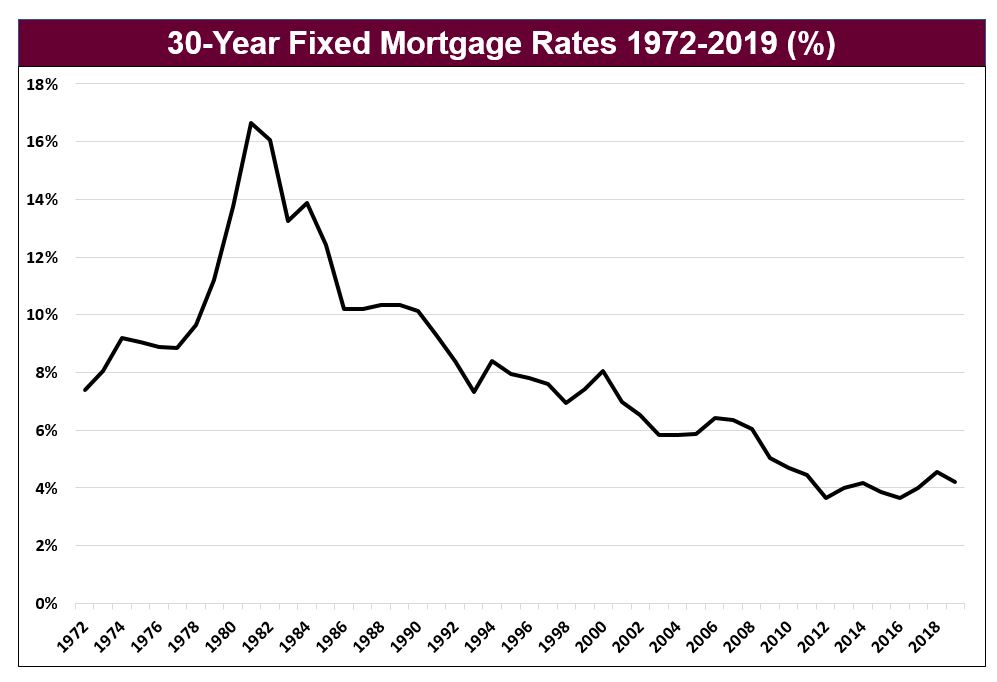
Mortgage Rates Are Dropping
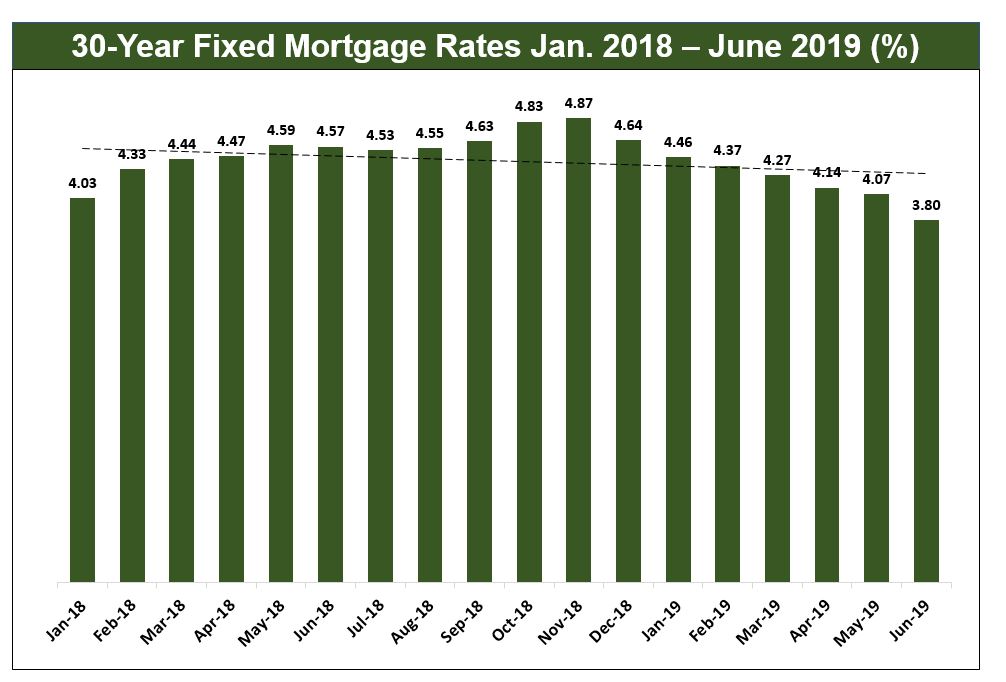
Mortgage rates went down in the first half of 2019, hitting 3.8% for 30-year fixed mortgages at the end of June. This followed on the heels of rising rates throughout most of 2018, when rates peaked at about 4.9%, causing some to conclude that the real estate market would cool of significantly. But with rates coming down again in 2019, homes became more affordable, offsetting the headwinds caused by rising supply and falling demand. Even if the homes were priced just as high as before, buyers were out of pocket a little less each month when it came time to pay the mortgage.
For the time being, low mortgage rates outweigh all other market factors and the market remains strong.
|
|
In historical context, the current 30-year fixed mortgage rate of 3.8% is close to a 50-year low. It is no surprise that we are in the midst of one of the strongest real estate markets in recent memory.
|
|
Implications for Sellers
Sellers of single-family homes and condos in Arlington enjoy one of the stronger seller's markets in the Boston area. While 2019 has started out slower than some other recent years, the fundamentals suggest the market will continue to be strong and that home prices will continue to go up. But homeowners thinking of selling may want to minimize the risk of a market downturn and sell sooner rather than later so as to lock in gains.
Certainly tailwinds, such as if interest rates should start rising again, a stock market correction, and local factors, such as the Proposition 2 1/2 override (raising Arlington property taxes in the face of an anticipated budget shortfall in 2020) and the large debt exclusion that will be needed to pay for the high school building project, could have a chilling effect on Arlington home prices (in the near term), though a new high school would likely make Arlington an even more attractive place to live, which could increase home prices down the road.
Nevertheless, as we get deeper into 2019 and Arlington prices begin to rise, getting closer to the price levels of Lexington, Belmont, and Winchester (towns whose median home prices suggest they are viewed as more desirable than Arlington), potential sellers of Arlington homes may want to think about whether it makes sense to invest in additions or improvements to their homes to make them more competitive against homes in these other towns. The average square footage of an Arlington single-family home is significantly smaller than the average square footage in these other towns, and some Arlington homes have not had the recent kitchen and bath updates that buyers have come to expect in Lexington and Winchester.
The same holds true for condos. While there is not much an owner can do to increase the size of their condo, they can certainly make sure that is has been updated and, when time comes to sell, that it is staged for maximum appeal.
Implications for Buyers
Buyers looking for a home in Arlington will continue to face a seller's market, often with several buyers competing for the same property. Buyers need to be prepared to move fast and put in competitive offers with as few strings attached as feasible. But, despite rising prices and tight inventory, 2019 Arlington single-family per square foot prices ($435/sq.ft.) were a relative bargain compared to Cambridge ($821/sq. ft.), Somerville ($538/sq. ft.), and Belmont ($522/sq. ft.).
And if Arlington prices are too high, buyers may want to consider other nearby towns. In the first half of 2019 the median single-family home price in Bedford ($795,000) was 5% less than that in Arlington ($832,500), in Watertown ($714,900) it was 14% less, in Medford ($614,000) it was 26% less, in Waltham ($610,000) it was 27% less, in Burlington ($574,000) it was 31% less, and in Woburn ($519,950) it was 38% less.
Arlington 2019 (June YTD) per square foot condo prices ($469/sq.ft.) were not as steep as those in Cambridge ($819/sq.ft.) or Somerville ($653/sq.ft.). And if Arlington prices are too high, buyers may want to consider alternatives such as Winchester where the 2019 (June YTD) median price ($542,500) was 11% than in Arlington ($610,000), Medford ($544,250) where it was also 11% less, Burlington ($512,500) where it was 16% less, Waltham ($505,000) where it was 17% less, Woburn ($450,000) where it was 26% less, or Bedford ($420,000) where it was 31% less.
|
|
Data were collected from MLS PIN, Massachusetts Association of Realtors, Great Boston Association of Realtors,and Freddie Mac. Data do not reflect private transactions. Berkshire Hathaway Home Services Commonwealth Real Estate and its sales agents make no representation as to the accuracy of the data and are not responsible for any actions taken as a result of use of or reliance on this information.
|
|
Steve Poltorzycki is a Realtor® with Berkshire Hathaway Home Services Commonwealth Real Estate. Email him at steve@stevepolt.com.
|
|
Steve Poltorzycki
617-308-6828
Please
contact me
if you have any real estate questions
|
|
Sign up to receive my real estate market newsletter in your email inbox:
|
|
|
|
|
|
|