|
Compiled by Ahmed Kabani, CEO & Founder, Kabani Hotel Group | July 27, 2026
Every hotel tells a story through its numbers. But if there's one figure that captures the whole narrative in a single glance, it's RevPAR, Revenue Per Available Room. It's the metric owners' chase; investors underwrite, and lenders' trust. Here's why it matters more than ever, and how technology is reshaping the way we grow it.
What Is RevPAR?
RevPAR is total room revenue divided by total available rooms, whether or not a room is sold. It blends occupancy and average daily rate (ADR) into one number, which is why it's truer measure of performance than ADR alone. A hotel can charge a premium rate, but if half its rooms sit empty, RevPAR reveals the gap ADR hides.
Why It's the Metric That Matters Most
-
Owners & Operators: RevPAR benchmarks pricing strategy and competitive positioning, spotting revenue gaps before they widen.
-
Investors: A rising RevPAR signals revenue-generating strength and profitability potential; a falling flag operational or market risk.
-
Lenders: RevPAR drives Net Operating Income, which drives Debt Service Coverage Ratio. A property trailing its competitive set is underwritten as higher risk, and a soft RevPAR trend can shrink loan proceeds before a deal ever closes.
The Six-Year Arc: 2019 to Today
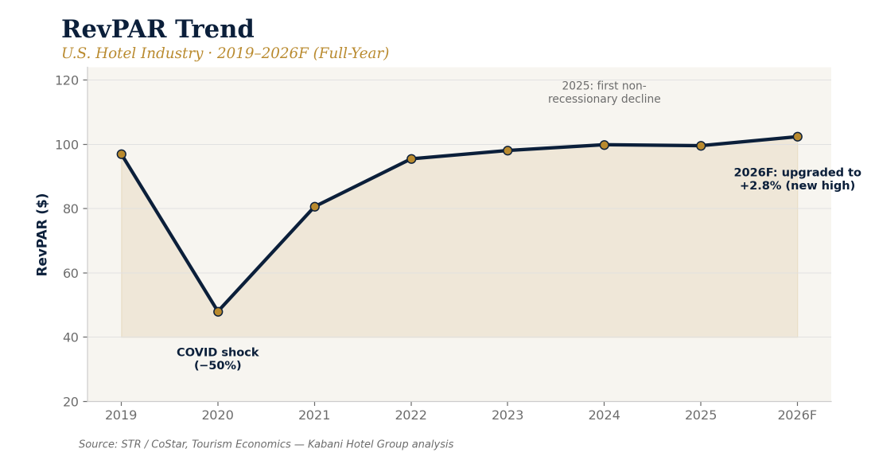
2019 set the pre-pandemic benchmark every recovery has been measured against since. 2020 brought the deepest shock on record, U.S. RevPAR fell as much as 80% year-over-year at the worst point, with full-year RevPAR down roughly 50%. 2021 remained a recovery year, closing at just 83% of 2019 levels. By 2024, national RevPAR hit a record nominal $99.94, though growth had cooled to roughly 1.4%. Then 2025 delivered a rare surprise: RevPAR declined 0.3% for the year, the first non-recessionary annual decline ever recorded.
2026 has turned that around and more strongly than expected. CoStar and Tourism Economics initially projected just 0.6% full-year growth but upgraded that outlook in June to 2.8% RevPAR growth, with occupancy reaching 62.8% and ADR up 2%. Individual weeks have run even hotter, with events like the FIFA World Cup and America's 250th anniversary pushing markets like Miami, San Francisco, and Las Vegas well above trend for short stretches. Looking to 2027, forecasters see continued, more moderate growth as the calendar normalizes.
New York City tells a different story worth noting it remains the highest-occupied and highest-priced market in the country 2025 RevPAR of $280.71, a record ADR of $333.71, and 84.1% occupancy, the nation's highest for three consecutive years. Because NYC is already running near capacity, its growth comes almost entirely from pricing power, not filling more rooms, a useful reminder that RevPAR growth means something different in a mature, high-barrier market than in an emerging or event-driven one.
Where RevPAR Is Strongest
Gateway and convention markets are pulling away from the rest of the country; the Top 25 Markets posted 2.7% RevPAR growth in 2024, triple the 0.9% gain elsewhere. CBRE expects San Francisco, Orlando, and San Jose to lead growth through 2026, powered by strong convention calendars and marquee events, while some Sun Belt secondary markets cool as new supply catches up with demand.
The AI Revolution in RevPAR Management
|