|
In this issue:
- New TNSDC Resources Aid Municipal 2020 Census Error Review
- Working, Retirement Age Population Increases Drove State Increases in 2021
- Annual Income, Poverty and Other 2021 ACS Data Released Sept. 15
- Southern Demographic Association Meets in Knoxville
| |
|
7,317 Permits for Multifamily Units
were pulled through July 2022 in Tennessee. Filings for new units are off 37 percent compared to last year when more than 11,500 new dwellings were on record by this point in 2021, according to the Building Permit Survey. Davidson County’s 62 percent decrease led the decline but was offset by slight accelerations in Montgomery, Wilson, Knox and Sumner counties.
| |  |
$2,000 Annual
Earnings Increase
was associated with workers obtaining an industry-certified manufacturing credential. The increase, measured over counterparts without similar training, was published in a new Census Bureau paper. The study linked records from post-secondary enrollment, IRS wage data and other census data, and also noted a higher likelihood of labor market participation post-certification.
| |
TNSDC Offers Resources to Help Communities Identify, Resolve Errors from the 2020 Census
The window to file 2020 Census challenges stays open until June 30, 2023
Data from the 2020 Census was released one year ago and the Tennessee State Data Center has released new tools to help communities identify and resolve Census Bureau processing errors.
The streamlined three-step process can be used by communities to conduct a detailed review their 2020 Census data and most of the required data and maps are provided. The review focuses on locating errors eligible for submission to two 2020 quality review programs that can result in corrected population counts being issued.
Fixing problems in the 2020 Census data that result in net population increases for a city or town can be a financial boost. That’s because several Tennessee state-shared revenue formulas reference the latest decennial population counts. When corrections are issued by the Bureau, they are incorporated into the state’s Certified Population Report – the official basis for the distribution.
To date, three Tennessee communities have challenged the Census results. This includes the City of Memphis which recently announced that it was doing so as well.
| |
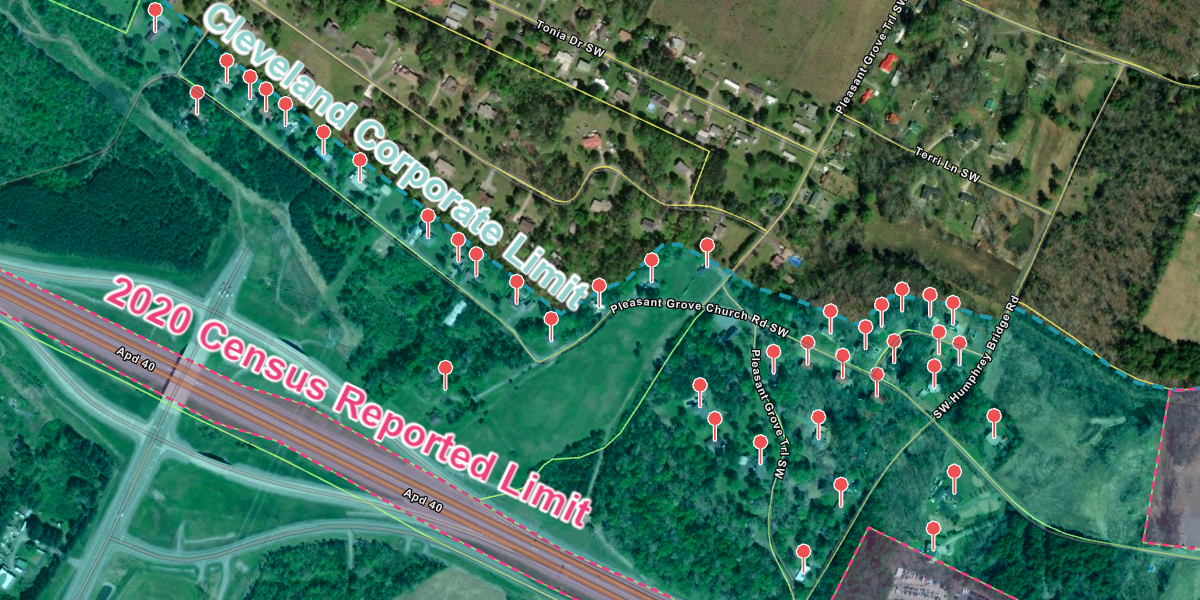
Error in Part 1 Boundary Review. A discrepancy in Cleveland’s city limits in the 2020 Census led to a number of housing units and associated population being incorrectly reported in the unincorporated portion of Bradley County. The Tennessee city challenged the error under the boundary provisions of the CQR program. If approved, a corrected count of housing units and population will be issued and new results will be published in the 2020 Census errata. | |
2030 Census Design Input is Sought | |
Rise Among Tennesseans of Working, Retirement
Age Increased State Population in 2021
Tennessee netted a 55,000-person population increase in 2021, but those gains were entirely from people age 20 years and older. The number of children in the state fell slightly.
An analysis of 2021 Census Bureau Population Estimate data showed that the largest population increases were among individuals over age 65. This group grew by almost 31,000 new residents last year; a level that was on pace with last decade’s annual average increase of about 32,000 people in this group.
Young adults age 20 to 44 netted the state an additional 29,000 new residents.
But two age groups saw decreases last year. The number of people age 45 to 64 fell by almost 4,400 people. There were also fewer children.
The number of people under 20 years of age in Tennessee was down by about 400, in large part due to contractions among the cohort of children age zero to four. This reflects both missed conceptions in the early months of the COVID-19 pandemic that pushed births in 2021 to their lowest totals since 2003, and the continued slide of state and national fertility rates.
| |
Tennessee Population Change by Age, July 2020 to July 2021 | |
Source: Vintage 2021 Population Estimates, U.S. Census Bureau. | |
Keep Reading on Our Website
- Information about population decreases in Davidson and Shelby counties
- How do Tennessee's changes last year compared to the national trends?
| |
Annual Income, Poverty and Other 2021 American Community Survey Data Set for Release Sept. 15 | |
Tennessee Economic Indicators | |
Southern Demographic Association to Meet in Knoxville | |
SDA’s long-awaited Knoxville conference will be held on October 17-19 in downtown Knoxville. The convening will include presentations focused on academic and applied demographic research. Since the group’s last Scruffy City visit in 2009, the area has seen a 50 percent employment increase in the arts, entertainment and hospitality sectors. So, there is plenty that’s new to see and do. | |
|
New Reports Highlight Tennessee Population Trends | |
|
In this section we normally highlight work by the Tennessee community, but some recent articles shined the light on some important trends that better help us understand the state’s population.
Declining Marriage Rates Vary by Race (July 2022)
New research featured in America Counts noted some interesting differences among racial groups, chiefly being the increasing rates of unmarried Black or African Americans in the country.
The report shows that growth in unmarried Black or African Americans adults in Tennessee was slower than the national average, but since 2017 has exceed 50 percent of the group’s total. In 2019, for the state as a whole, 30.6 percent of residents had never been married; a difference of 20 percentage points.
| |
Teen-to-Adult Migration Patterns Show Most Young Adults Remain in State (July 2022) | |
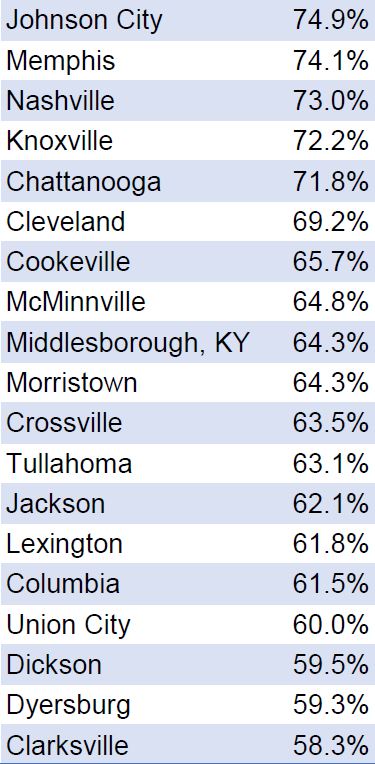
81 percent of 16-year-old Tennesseans still lived in the state at age 26, according to new Harvard/Census Bureau research which focused on a group born between 1984 and 1992. Across the state, 70 percent still resided within the same multi-county “commuting zone” that they did as a child – a level matching national-level trends showing most young adults remain close to home. An interactive map found at migrationpatterns.org provides additional detail. | |
Table 1: Percent of young adults residing in same commute zone at age 16 and 26. | |
|
Generational Wealth Concentration Continued According to 2019 Survey (August 2022)
The Census Bureau’s Survey of Income and Program Participation (SIPP) captures the details household assets and liabilities among other employment and income measure. An analysis of 2019 SIPP data highlighted some persistent inequality trends related to wealth:
- 41.2 percent of households don’t own a retirement account
- Homeowners had a median wealth of $305,000 versus $4,084 among those who rented
- Net worth of married households was five to seven times higher than unmarried male and female households
The article's headline spotlighted wealth concentration among the "Baby Boomer" generation (born 1946 to 1964) which was about nine times that of the "Millennial" group (born 1981 to 1986).
Do you have some work that you would like to share with the Tennessee data user community? Drop us a line at tnsdc@utk.edu.
| |
New Tennessee Census Bureau Data Dissemination Specialist
Welcome to Tim Sarko who will serve (at least in the interim) as the Census Bureau Data Dissemination Specialist covering Tennessee. He is Ohio-based, but is still available for consultation and custom training on the Bureau’s data and products.
Congratulations to Tennessee’s own Ron Williams, who previously served in that position, on his move to the Bureau’s Center for Enterprise Dissemination – the group responsible maintaining for data.census.gov, the Census API and other retrieval interfaces.
| |
FSCPE Steering Committee Election
TNSDC Director Tim Kuhn was elected to the Steering Committee of the Federal State Cooperative for Population Estimates (FSCPE) and will serve a two-year term in beginning in September. FSCPE was formed to promote cooperation between the states and Census Bureau in the preparation of nation’s population estimates. The seven-member committee helps determine priorities and coordinate activities of the group.
| |
About the Tennessee State Data Center Network | |
The State Data Center Program is a cooperative program of the State of Tennessee, The University of Tennessee and the U.S. Census Bureau. Data Centers in each state assist the Bureau by disseminating Census data, other federal data sets and information. | |
Data Center Affiliates
Each center has an internal statewide affiliate network to further assist in disseminating data to local users. These affiliates also have local information and expertise to offer. Visit tnsdc.utk.edu for a full listing of affiliates.
| |
916 Volunteer Blvd. | 713 Stokely Management Center
Knoxville, TN 37996
| |
| | | | |