|
Benchmarking Emergency Response Capability: Measuring Readiness, Driving Improvement, and Preventing the Next Industrial Event
| | |
|
JP Pennington, CSP®, CPP®, RPIH, CFEI, MIFireE
Operating Partner, IES Safety, LLC
| |
Abstract
Industrial emergency response teams and fire brigades are traditionally judged by how well they perform once an event is already underway. This article advances a different question, which is whether a team’s measured capability is improving over time, because the same disciplines that make a team ready to respond also make the facility less likely to need a response. Drawing on the Occupational Safety and Health Administration’s guidance on leading indicators and its Recommended Practices for Safety and Health Programs, the discussion connects periodic benchmarking of emergency response capability to the continual improvement philosophy embodied in recognized management system standards. A structured, repeatable evaluation instrument, the IES Safety Emergency Response Team Operational Readiness Score (ERT-ORS), is presented as a practical means of converting field observations into a defensible score, tracking that score across drill cycles, and directing resources toward the specific gaps that matter most. The approach is examined from the vantage points of executives, program managers, team leaders, and front-line responders, and the article closes with the regulatory reasons to begin benchmarking now.
Readiness Is a Measurement Problem, Not a Feeling
Ask a plant manager whether the site emergency response team is ready, and the honest answer is often a feeling rather than a figure. Confidence is not evidence, and a team that has never been measured against a consistent standard has no way to know whether it is getting stronger or quietly drifting. The Occupational Safety and Health Administration frames workplace safety as a proactive discipline and observes that finding and fixing hazards before they cause injury or illness is far more effective than the traditional reactive approach of acting only after a worker is hurt or an inspection finds a problem (OSHA, n.d.-e). The same logic applies to the response function itself. A team that is measured, benchmarked, and improved on a schedule is a team whose weaknesses are surfaced in a drill rather than during an actual release, fire, or rescue.
Benchmarking replaces impressions with data. It answers three questions that impressions cannot, namely where the team stands today, whether that position is better or worse than the last evaluation, and which specific gap should receive the next dollar and the next training hour.
Leading and Lagging Indicators for the Response Team
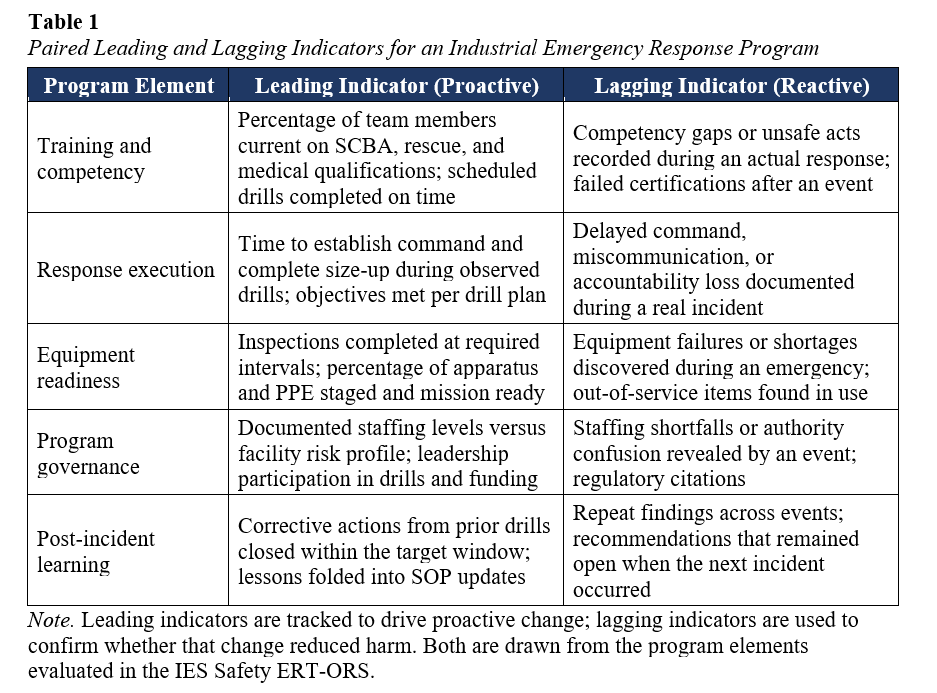
Most organizations already track lagging indicators for their response programs, such as response times captured during real incidents, responder injuries, equipment failures that occurred at the worst possible moment, and any citations that followed. Lagging indicators measure events that have already happened (OSHA, n.d.-d). They are necessary, but they arrive too late to prevent the incident that produced them.
Leading indicators are proactive, preventive, and predictive measures that reveal the effectiveness of safety and health activities before an incident occurs (OSHA, 2019). For a response team, leading indicators include the percentage of members current on self-contained breathing apparatus and rescue qualifications, the number of drills completed on schedule, the time required to establish command during an observed exercise, and the share of corrective actions closed within a target window. OSHA recommends that programs monitor performance using both leading and lagging indicators rather than relying on either alone (OSHA, n.d.-f). Table 1 pairs the two indicator types across the elements that a response program should manage.
| |
The ERT-ORS: Turning Observation Into a Score
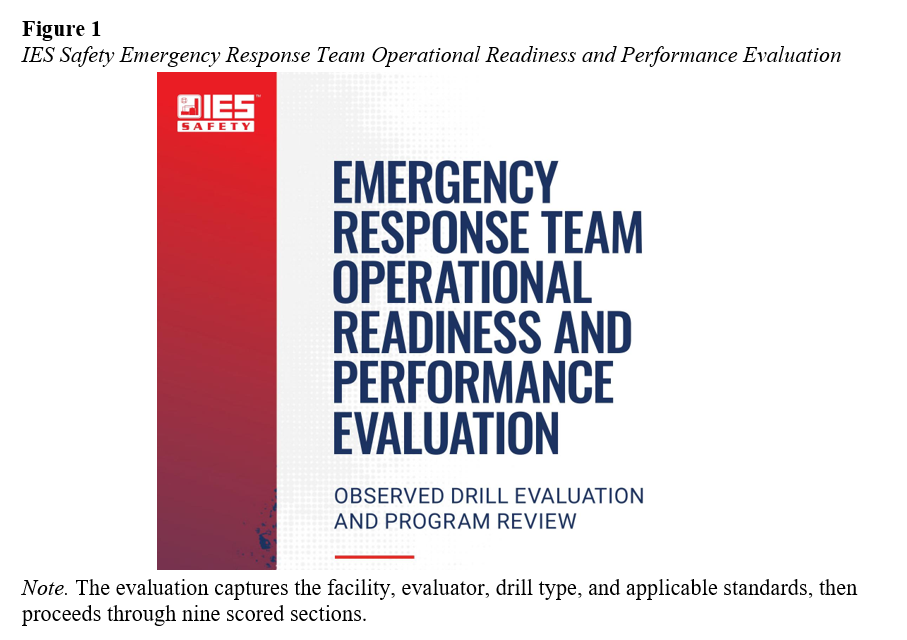
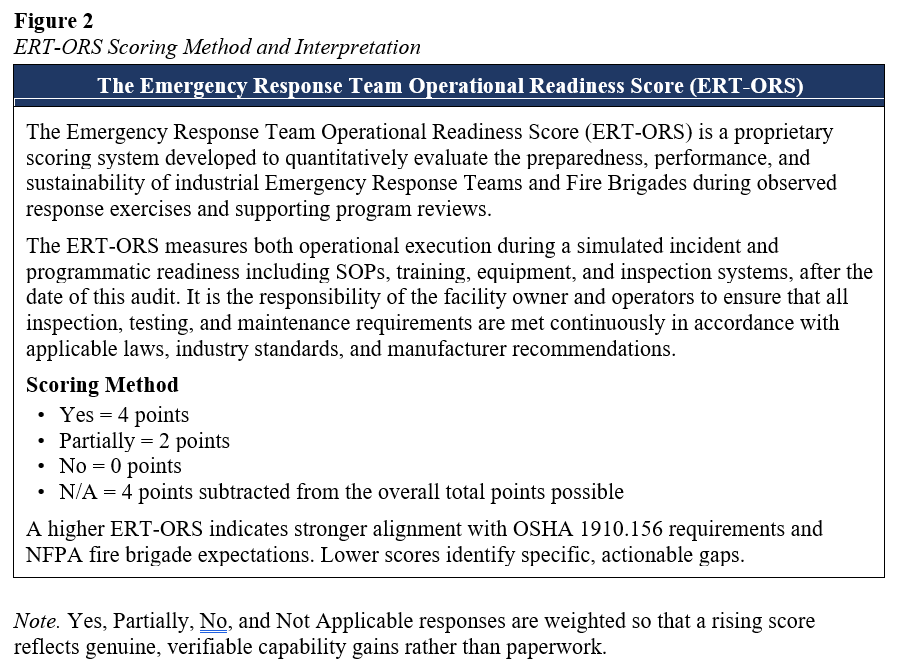
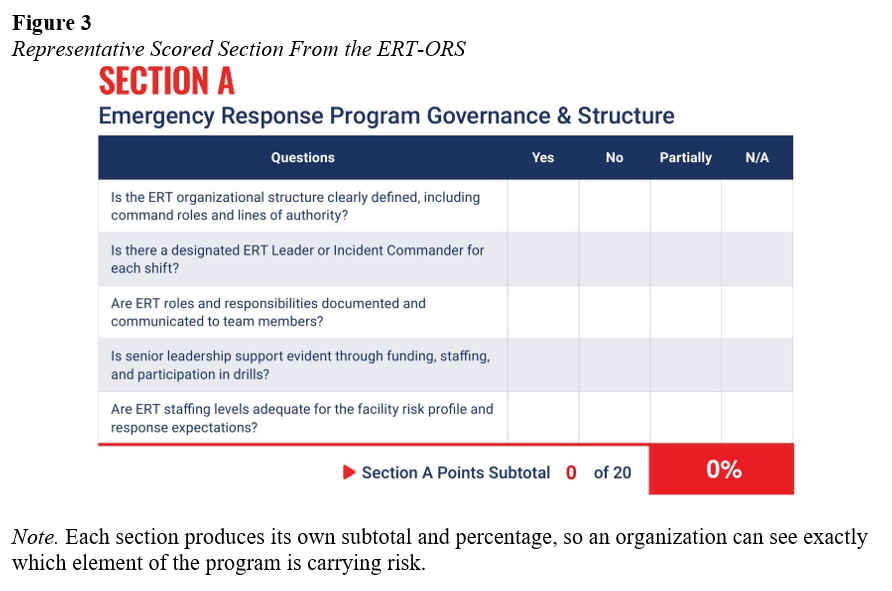
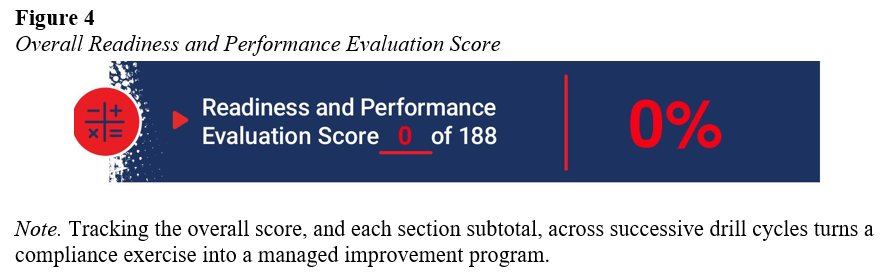
The IES Safety Emergency Response Team Operational Readiness Score (ERT-ORS) is a structured instrument that converts what an evaluator observes during a drill and program review into a single, defensible number. The evaluation is organized into nine sections spanning governance and structure, standard operating procedures and pre-incident planning, training and competency, response execution, personal protective equipment and personnel safety, equipment inventory and readiness, inspection and maintenance, drill design and safety controls, and post-incident review. Each question is scored as Yes, Partially, No, or Not Applicable, and the section subtotals roll up to a possible 188 points. A higher score indicates stronger alignment with the requirements of the OSHA Fire Brigades standard and with recognized fire brigade expectations (OSHA, n.d.-b).
| The scoring method is deliberately simple so that results are repeatable across evaluators and across years. Consistency is what makes the score a benchmark rather than a one-time opinion. When the same instrument is applied on a schedule, the number becomes a trend line, and the trend line is where the real value lives. | |
What the Score Reveals Across the Organization
A benchmark is most powerful when different roles can read their own priorities in it. For the executive or plant manager, senior leadership support is itself a scored item, so a low governance subtotal becomes a concrete argument for funding and staffing rather than an abstract request. For the safety or program manager, the section subtotals localize weakness; a low inspection and maintenance score points to a records and accountability gap, while a low training score points to lapsed qualifications. For the response team leader, the instrument separates what is documented from what is demonstrated, because competency is scored as it is actually performed during the drill. For the front-line responder, the personnel safety section keeps attention on the fundamentals that keep responders alive, including proper selection and use of protective equipment, breathing apparatus, and air management.
| |
From Score to Continual Improvement
A single score is a snapshot. Its purpose is to become the first point on a curve. The continual improvement cycle that underlies modern occupational health and safety management systems, often summarized as plan, do, check, and act, depends on exactly this kind of repeated measurement, and the recognized international management system standard for occupational health and safety, ISO 45001, is built on the same premise of never being finished. OSHA expresses the identical idea in its action items for program evaluation and improvement, which direct employers to verify that the program is genuinely implemented, to monitor progress using both leading and lagging indicators, and to correct shortcomings and identify opportunities to improve (OSHA, n.d.-f).
| |
In practice, the score from one evaluation sets the baseline. Corrective actions are assigned and tracked, drill outcomes are folded back into training and standard operating procedure updates, and the next evaluation tests whether those actions moved the number. When a subtotal climbs, the investment is validated. When it stalls, the gap is exposed before an incident exposes it instead.
Why Benchmark Now
The regulatory ground is shifting under industrial response programs. OSHA has proposed replacing the 1980 Fire Brigades standard with a broader Emergency Response standard that would extend coverage beyond firefighting to emergency medical services and technical search and rescue (OSHA, n.d.-a). Facilities that already benchmark their teams will adapt to expanded expectations far more easily than those starting from a blank page. Meanwhile, the Hazardous Waste Operations and Emergency Response standard already obligates employers that respond to hazardous substance releases to maintain a compliant emergency response plan and to train and equip responders to defined levels (OSHA, n.d.-c). A documented, repeated readiness benchmark is direct evidence of the due diligence these standards contemplate.
The deeper reason is the prevention dividend. A response team that is measured, benchmarked, and continuously improved does not only respond better. Its disciplines, including maintained equipment, current qualifications, tested procedures, and closed corrective actions, reinforce the facility safety management system as a whole and reduce the likelihood that the event happens at all. That is the true objective of emergency preparedness in the industrial setting, which is not merely to stop an event once it has begun, but to build the kind of organization in which the event is far less likely to begin in the first place.
References
Occupational Safety and Health Administration. (n.d.-a). Emergency response rulemaking. U.S. Department of Labor. https://www.osha.gov/emergency-response/rulemaking
Occupational Safety and Health Administration. (n.d.-b). Fire brigades (29 CFR 1910.156). U.S. Department of Labor. https://www.osha.gov/laws-regs/regulations/standardnumber/1910/1910.156
Occupational Safety and Health Administration. (n.d.-c). Hazardous waste operations and emergency response (29 CFR 1910.120). U.S. Department of Labor. https://www.osha.gov/laws-regs/regulations/standardnumber/1910/1910.120
Occupational Safety and Health Administration. (n.d.-d). Leading indicators. U.S. Department of Labor. https://www.osha.gov/leading-indicators
Occupational Safety and Health Administration. (n.d.-e). Recommended practices for safety and health programs. U.S. Department of Labor. https://www.osha.gov/safety-management
Occupational Safety and Health Administration. (n.d.-f). Safety management: Program evaluation and improvement. U.S. Department of Labor. https://www.osha.gov/safety-management/program-evaluation
Occupational Safety and Health Administration. (2019). Using leading indicators to improve safety and health outcomes. U.S. Department of Labor. https://www.osha.gov/sites/default/files/publications/OSHA_LEADING_INDICATORS.pdf
| | | | |