It was the best of times, it was the worst of times, it was the age of wisdom, it was the age of foolishness, it was the epoch of belief, it was the epoch of incredulity, it was the season of Life, it was the season of Darkness, it was the spring of hope, it was the winter of despair, we had everything before us, we had nothing before us, we were all going direct to Heaven, we were all going direct the other way - in short, the period was so far the like present period, that some of its noisiest authorities insisted on its being received, for good or for evil, in the superlative degree of comparison only. (Dickens, 1859, A Tale of Two Cities). Images of Gaza and New York City. | |
Market Update - August 2024 | |
- During July, small-cap, real estate, financial and utility stocks ripped higher as markets anticipated the first Federal Reserve rate cut. Techology stocks were down during July despite the last day rally in Nvidia.
- The markets are trying desparately to run ahead of a Fed rate cutting cycle, forgetting the sequence of events. Traders keep telling themselves "Markets rally when the Fed cuts rates, markets rally when the Fed cuts rates". This market folklore has some truth, because the markets do rally AFTER they fall and THEN the Fed cuts interest rates. So, you can see the problem with using rules of thumb. This little pullback in July is not the catalyst for a massive Fed rate cutting cycle.
- Key leading indicators continue to set records for length of time before recession onset. It is our view that we are going to experience at least a normal recession. Recession severity will depend on Fed policy, Congressional spending and geopolitics. Many of these factors won't be resolved until after the election.
| |
Table 1: Market performance estimate as of 7/31/2024 (LIMW) | |
The economy continues to slowly decelerate, yet maintains minimal growth | |
|
Our leading indicators like the Conference Board's Leading Economic Indicator (LEI), the inverted yield curve and Institute for Supply Management (ISM) Purchasing Manager Surveys (PMIs) continue to indicate economic weakness. Yet, each quarter for the last year, the economy has been able to grind out low, but positive growth.
Why this is the case is a long and boring story, but the short answer is that the United States is a service economy with low rates of manufacturing. Service industries are better able to raise prices and have less exposure to high interest rates than cyclical industries like real estate, transportation and consumer discretionary areas. We can see the pain in real estate and autos, but the government, health care and consumer staples businesses keep moving right along.
Additionally, government stimulus is still flowing heavily through the market and the wealthy are spending money.
Here are a few charts that paint the picture:
Late note: This morning's July ISM manufacturing was a disappointing 46.8, so lower.
| |
Figure 1: ISM Purchasing Manager Survey: Service sectors vs. Manufacturing sectors. Above 50% is growth; below 50% is contraction. (Institute for Supply Management) | |
Figure 2: US Bankruptcy filings through June 2024 are the highest since 2010, you know, the financial crisis (S&P Global) | |
|
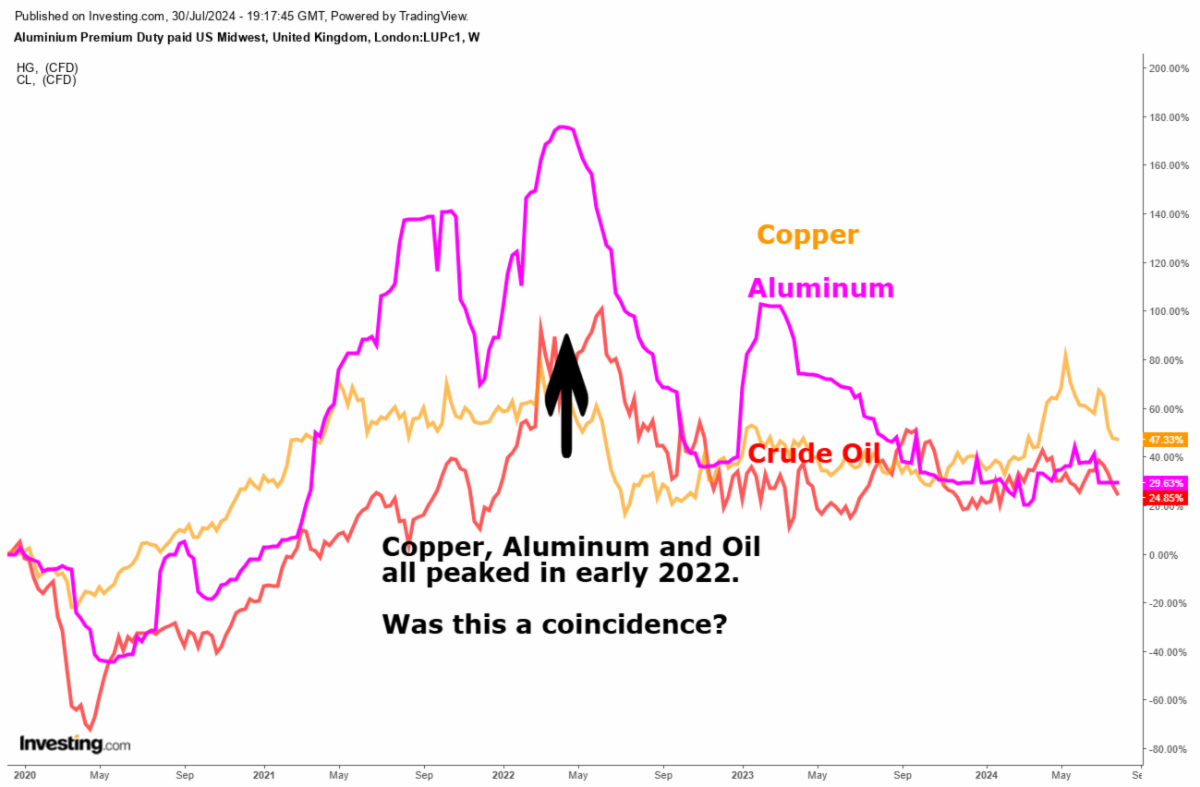
Inflation has been falling and commodities are acting like we are in a recession. So, if commodities are weak, why won't inflation fall? Because service industries like insurance and banks have massive losses that can only be paid off by raising prices to the consumer.
Figure 3: Crude oil, aluminum and copper. Not much inflation from these commodities (LIWM).
| |
The yield curve tells us the Fed is pressing on the brake pedal, but growth won't slow | |
|
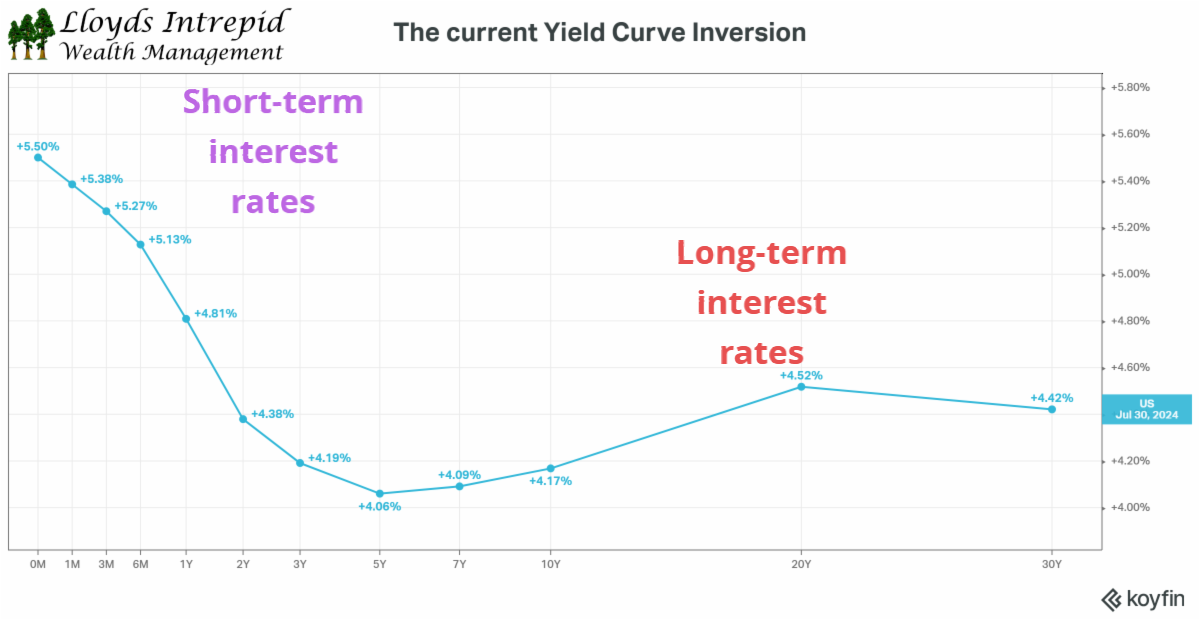
Here is a depiction of the yield curve and the current inversion that has analysts like us concerned. On the left are short-term interest rates; on the right are long-term interest rates. When the Fed raises rates, short-term interest rates are higher than long-term interest rates.
The shape of the curve determines whether lenders are incentivized to lend. When short-term rates are higher than long-term rates, lending money is unattractive. The lack of lending is being offset by higher government spending, but it is difficult to quantify the effects on the economy. It appears the record Federal stimulus spending is creating growth despite the Fed's efforts to slow things down.
| |
Figure 4: US Federal debt yields at important maturities (LIWM) | |
|
Looking at the shape of the yield curve over time gives us a sense for how big an impact Federal Reserve policies eventually affect the economy.
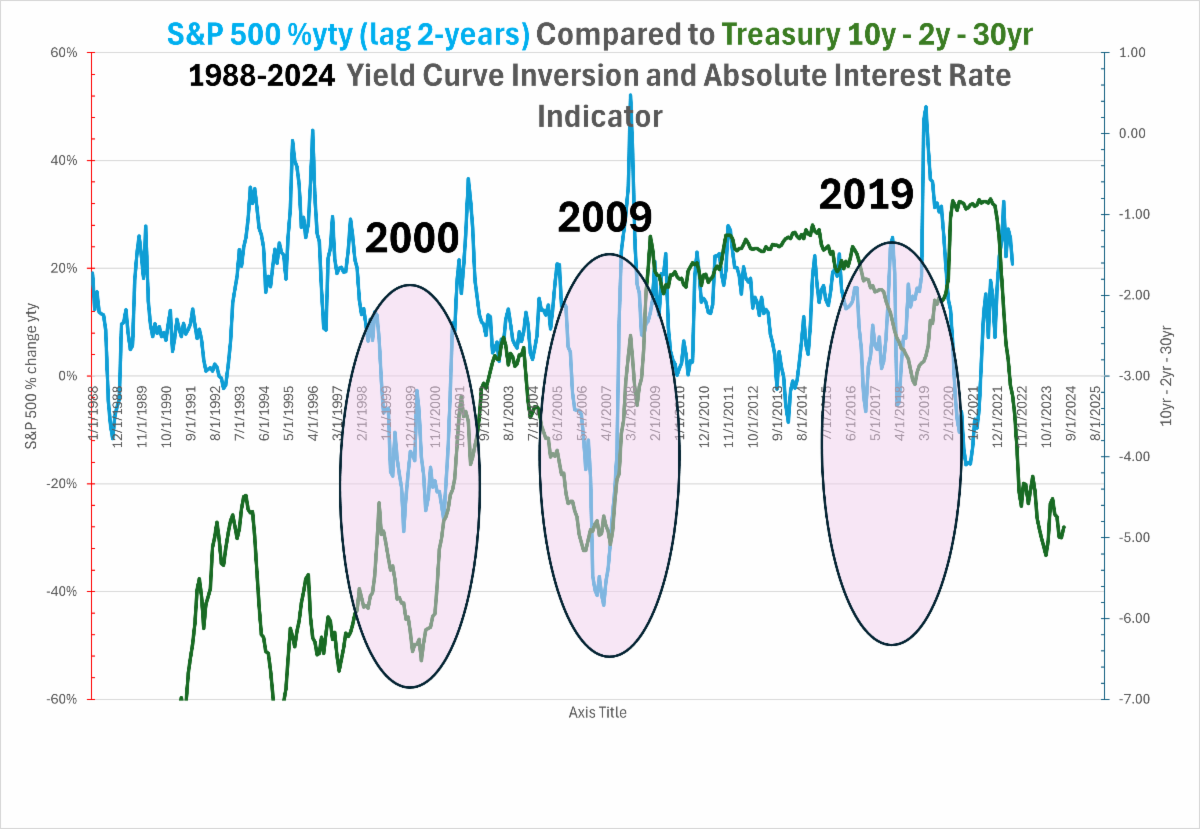
There are two main avenues interest rates affect growth. The first way is a relative comparison of short-term to long-term interest rates as just discussed. The second way is the absolute level of long-term interest rates. The absolute yield on 30-year Treasury bonds gives us a lot of information about long-term growth and inflation assumptions.
Let's look at a metric that combines these two features and see how it predicted stock market returns in the past. Here are the two metrics:
- Relative interest rates = 10-year yield minus 2-year yield (where inversion is bad)
- Absolute interest rate = 30-year yield (where higher rates are bad)
Combining these concepts we get: ([10-year yield - 2-year yield] - 30-year yield)
= 10yr - 2yr - 30 yr
To measure its predictive ability, we will use a statistical technique call "lagging" one of the data series. In this case, we will lag the S&P 500 index year-to-year % return by 2 years and compare it with the interest rate factor.
What do we see? This factor correctly predicted the 2000 and 2008 recessions and currently indicates that the S&P 500 may fall 30% after adjusting for today's interest rate environment. This is not a forecast, but a curious thought exercise.
| |
Figure 5: Yield Curve+Absolute Yield indicator versus S&P 500 % change 2 years later (LIWM) | |
Corporate earnings slowly chug along | |
|
Many Wall Street analysts and traders only look at earnings forecasts for the next 12-24 months. Stock then to move as their beat or miss these near term earnings expectations.
We can look at the same metrics for the broad indexes. Here is a depiction of the S&P 500 forward earnings for each of the last 40 years. You can see there is a broad underlying positive trend punctuated by the falling recessions of 1991, 2000, 2008, and 2020.
Two interesting things to note here. First, the dramatic rising profitability of large companies has happened alongside huge corporate tax cuts and falling interest rates. We like to think innovation and hard work have been big factors, but taxes and interest expense explain much of the growth. Higher taxes and interest rates will reverse some of this growth.
Second, the steep declines during recessions were frequently halted by emergency Fed action. This chart begins AFTER the inflationary 1970s, when emergency Fed stimulus was not able to save the day. It is not clear, yet, whether we are in a 1970s type of environment or whether the Fed will step in with stimulus in the next recession.
Figure 6: Calendar Year Earnings Estimates for the S&P 500 1985-2025 (Fidelity)
| |
The labor market is starting to crack | |
|
There are 3 main data points on the labor market that we follow:
- Weekly Initial Jobless Claims (reported by the states)
- Monthly payrolls data (reported by corporations to the federal government)
- Monthly unemployment (household surveys collected by the federal government)
While #2 continues to show relative stability, #1 and #3 is beginning to breakout to the upside in a way that historically indicated recession onset.
Late note: This morning's Initial Jobless Claim number was 249k, so higher.
Figure 7: Household unemployment rate versus Initial Jobless Claims 2015-2024 (LIWM)
| |
|
Over the last 5 years, the service economy has boomed. Education, health care, professional services and government jobs are where most of the job growth has popped up since 2019. This may explain why the Fed can't slow the economy: the sectors that are booming are not interest rate sensitive.
Figure 8: U.S. Employment growth since 2019 (Bancreek and LIWM)
| |
The bond market is bracing for lower interest rates | |
|
While most eyes are following the big tech stocks, underneath the surface of the market there have been tectonic shifts in interest rates. This is important because while the United States has a service economy, there are still millions of jobs in industries that depend on low inflation and low interest rates.
Here is a look at several key federal bond yields over the last 3 years.
Late note: This morning US 10-year Treasury yields fell below 4% on disappointing ISM and unemployment data (good news for bond investors).
Figure 9: Key federal interest rates 2021-2024 (LIWM)
| |
One group that follows interest rates closely are people getting ready to retire. The interest rates on corporate bonds play a direct role when trying to maximize company benefits. We have a long white paper on this if you are interested. Reply to this email if you would like to receive it. | |
Figure 10: Market yields that affect segment rates and pension lump-sum payouts (LIWM) | |
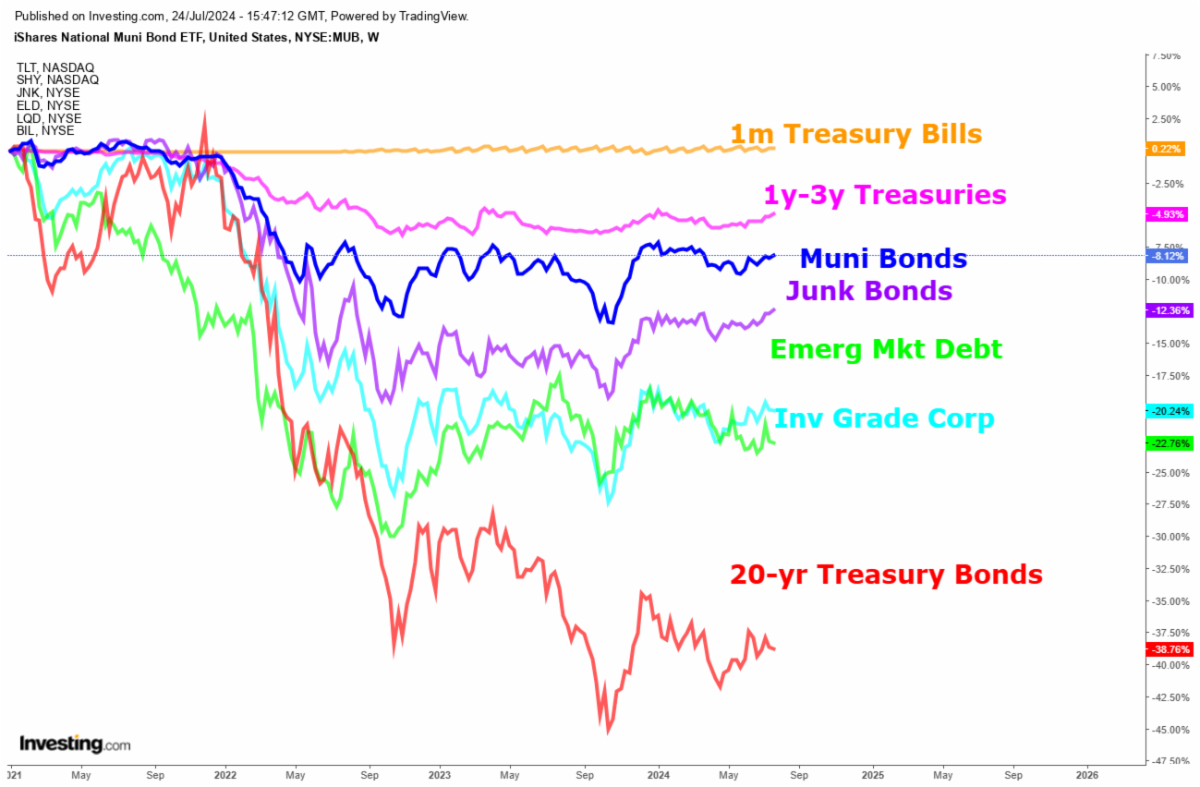
The bond world is divided into several different asset classes depending on risk, geography and tax status. The one thing they all have in common is a rounded bottom. This means bond prices may begin moving higher as interest rates fall. | |
Figure 11: Performance of various bond asset classes since the top in 2020 (LIWM) | |
|
If we look at the iShares 20 Year Treasury Bond ETF, we can see one of the most interest rate sensitive bonds as a stock chart. What does it tell us?
- It has suffered a horrible bear market.
- Prices are no longer falling.
- Falling volume indicates panic selling is ending.
- Are fundamentals and technicals indicating a bottom? Perhaps. Call to discuss.
| |
Figure 12: 20-year Treasury bond chart (LIWM) | |
The stock market appears to have put in a top | |
Let's not speculate on whether it is "the" top for this cycle and just observe that we are testing very weak short-term support. The market has experienced a very powerful run for a variety of reasons:
- Artificial Intelligence excitement and capex spending
- Moderating inflation and imminent Fed rate cuts
- Hopes for a soft-landing
- Resilient economy
However, let's not forget that the Fed hasn't cut any interest rates, yet. It's all talk. The leading indicators are pointing to a slowdown and higher interest rates are devastating those parts of the economy that are sensitive to rates.
Figure 18: S&P 500 uptrend lines (LIWM)
| |
Today's networking lesson | |
|
There is nothing like an old joke that teaches an important lesson. It's all about perspective and noticing that someone is saying or doing something that may be really useful. My compliments to the creator of this slide.
Figure 19: Networking 101 and The Princess Bride (creator unknown)
| |
|
It is our view that the economy is gradually falling into recession. Inflation is higher than desired, broad earnings are stagnant, and the labor market is weakening.
The Federal Reserve knows exactly what they are doing. On the one hand, they must appear sensitive to the needs of investors and politicians, providing stimulus for growth regardless of the inflationary risks. On the other hand, the Fed has a reputation to uphold and a legal requirement to use interest rate policy to suppress inflation. Chairman Jerome Powell has promised imminent rate cuts at each meeting since December 2023. Where are they? The stock market has rallied on these promises, but there have been no rate cuts.
Remember who the Federal Reserve serves: the banking system and the Treasury Department. Both of these constituencies want lower interest rates across the board. A recession after the election should push down interest rates and please both of these camps.
If you'd like to discuss any of our research, please feel free to reach out to us.
| |
|
Rob 281-402-8284
Chris 281-547-7542
| |
|
Christopher Lloyd, CFP ®
Vice President and Senior Wealth Planner
Lloyds Intrepid Wealth Management
1330 Lake Robbins Dr., Suite 560
The Woodlands, TX 77380
281-547-7542
Chris.Lloyd@lloydsintrepid.com
www.lloydsintrepid.com
| Lloyds Intrepid LLC is an Investment Advisor registered with the State of Texas, where it is doing business as Lloyds Intrepid Wealth Management. All views, expressions, and opinions included in this communication are subject to change. This communication is not intended as an offer or solicitation to buy, hold or sell any financial instrument or investment advisory services. Any information provided has been obtained from sources considered reliable, but we do not guarantee the accuracy, or the completeness of, any description of securities, markets or developments mentioned. We may, from time to time, have a position in the securities mentioned and may execute transactions that may not be consistent with this communication's conclusions. Please contact us at 281.886.3039 if there is any change in your financial situation, needs, goals or objectives, or if you wish to initiate any restrictions on the management of the account or modify existing restrictions. Additionally, we recommend you compare any account reports from Lloyds Intrepid LLC with the account statements from your Custodian. Please notify us if you do not receive statements from your Custodian on at least a quarterly basis. Our current disclosure brochure, Form ADV Part 2, is available for your review upon request, and on our website, www.LloydsIntrepid.com. This disclosure brochure, or a summary of material changes made, is also provided to our clients on an annual basis. | | | | |