March 2025

The Potential Carbon Sink in Boreal Forests

March 11, 2025

Aerial view of the Siberian Traps, a large region of volcanic rock in Siberia. This image was captured by NASA researchers flying over the region on their way to perform fieldwork in the boreal forests.

New research led by Landsat 8/9 Project Scientist Chris Neigh used Landsat and ICESat-2 data to investigate how much boreal forests could grow. As young boreal forests grow taller, they sequester carbon, paving the way for a substantial future carbon sink.

Growth Hotspots Up North
Brian Markham, with the support of Landsat Project Scientists Darrel Williams and Jim Irons, began an integrated approach to Landsat calibration that is still used today. Brian is pictured here inside a cartoon integrating sphere. Integrating spheres are used regularly for pre-launch radiometric calibration and spectral characterization. Artwork credit: Lane Payton

March 20, 2025

Data as Good as it Gets: A Discussion with Brian Markham


Why do we calibrate Landsat data? To find out, we spoke with Brian Markham, a key figure of Landsat calibration science for four decades.

Thumbnail for the Landsat Next Spectral bands explainer video. The background of the video is is a screenshot of the spectral bands of Landsat Next from the Band Comparison tool. The forefront of the image is text that says, "Beyond the Visible: Landsat Next’s New Spectral Bands."

March 14, 2025

Beyond the Visible: Landsat Next’s New Spectral Bands


Landsat Next’s enhanced spectral capabilities will provide scientists, farmers, and decision-makers with critical data to tackle global challenges.

Dwane Roth (right), a fourth generation grain farmer in Finney County, Kansas, stands with nephew Zion (left) in one of their corn fields. Roth’s farm became one of the first Water Technology Farms in Kansas around 2016, and he has been using OpenET data for the past few years to track evapotranspiration rates and conserve water. Photo courtesy of Dwane Roth

March 13, 2025

FARMing with Data: OpenET Launches new Tool for Farmers and Ranchers

Source: Milan Loiacono, NASA Ames


A NASA and USGS-supported research and development team, OpenET, is making it easier for farmers and ranchers to manage their water resources with the FARMS tool.

A satellite image of part of the Brazilian Cerrado from June 2024 shows light brown agricultural land amid areas of green vegetated land and irrigated farmland. Compared to the 2000 image, brown areas cover more of the image.

March 11, 2025

Spotting Disruptions to Earth's Vegetation

Source: Emily Cassidy, NASA's Earth Observatory


Using NASA data, researchers can track vegetation changes around the planet, not just in forests but also in grasslands and savannas like the Brazilian Cerrado.

February 26, 2025

NASA Open Data Turns Science into Art

Source: Lauren Leese, NASA Science


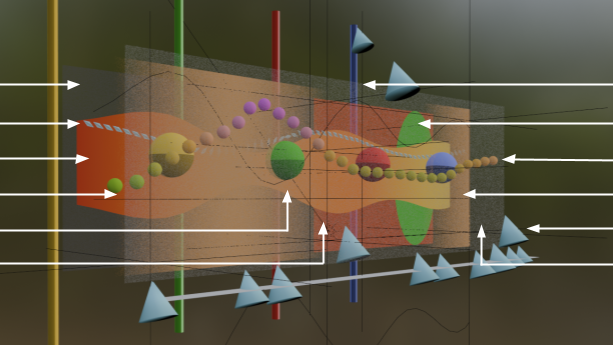
Numerous artists have incorporated NASA science data into their work, further engaging the public in science discovery. Data for the “Synchronicity” art piece included vegetation health data from Landsat.
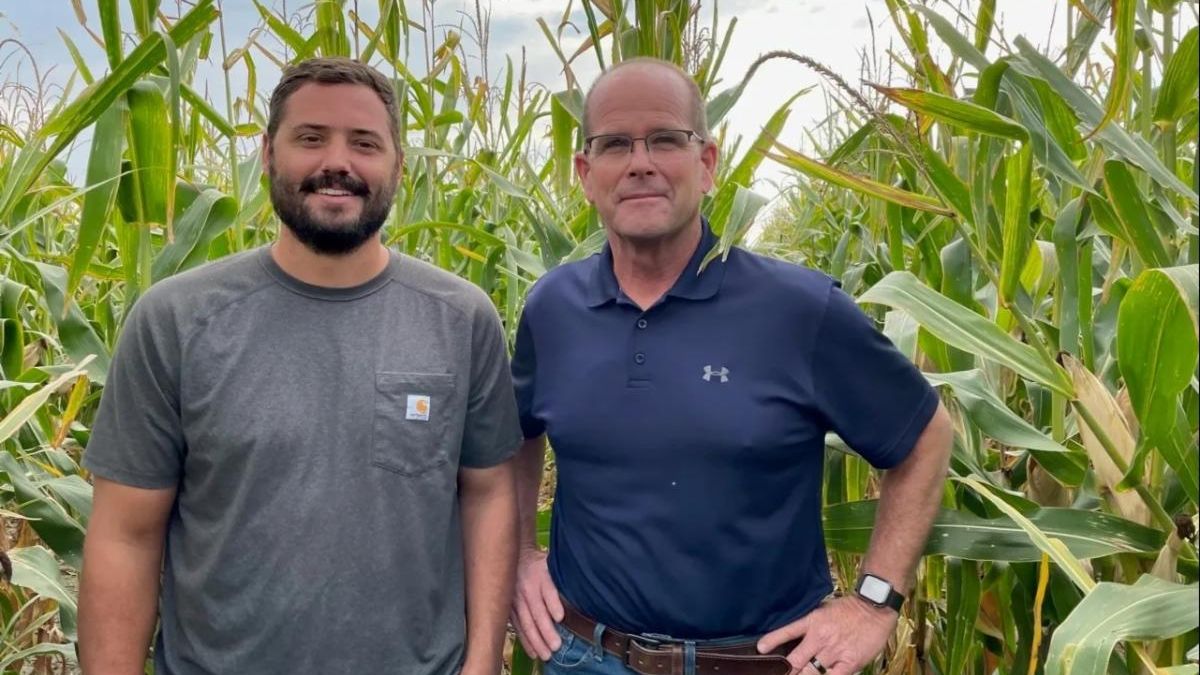
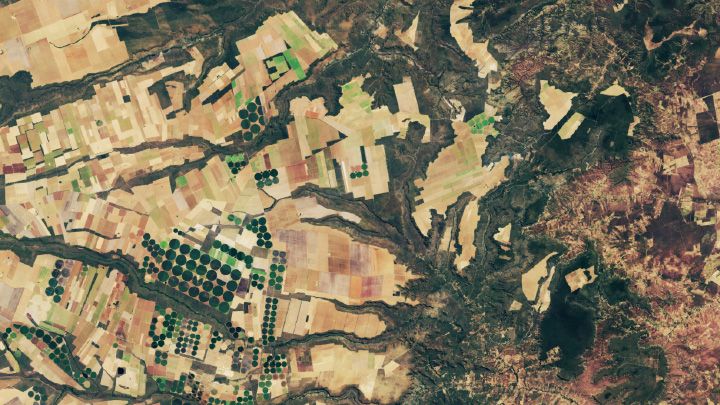
The satellite data from Landsat are one of the most important inputs to the ET models, which use the satellite data to measure patterns in land surface temperature and vegetation extent and condition at the scale of individual fields. 

OpenET: How it Works, March 13, 2025

OpenET website

Reaching Out

NASA Earth Science Division Director Karen St. Germain speaks to a group of attendees at Commodity Classic

March 24, 2025

Connecting Farmers with NASA at Commodity Classic


At Commodity Classic, the Landsat public engagement team spoke with farmers about how NASA data can help farmers do what they do best: farm. 

Upcoming Events

The Landsat Communications and Public Engagement Team will be at the following events in April 2025:
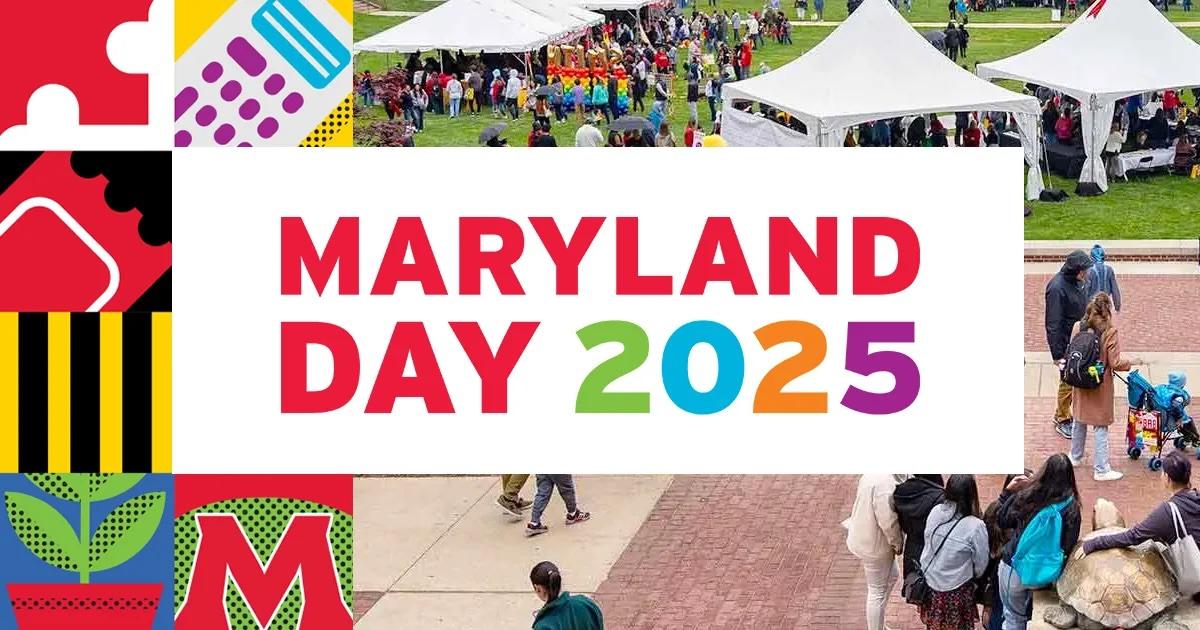
University of Maryland - Maryland Day 2025 logo

Maryland Day


April 26, 2025

University of Maryland

College Park, MD


The Landsat team will be at a table in the lawn in front of the Kirwan Hall.

It’s hard to overstate the impact of the Landsat program: Landsat data allows scientists to understand land use and land cover change, including processes such as urbanization, deforestation, crop monitoring, monitoring and management of natural disasters (such as floods and wildfires), and more."


The Oscillating Mirror that Changed Earth Science, March 13, 2025

Library of Congress Worlds Revealed Blog

PUBLICATION SPOTLIGHT


New coasts emerging from the retreat of Northern Hemisphere marine-terminating glaciers in the twenty-first century


| Kavan et al., 2025


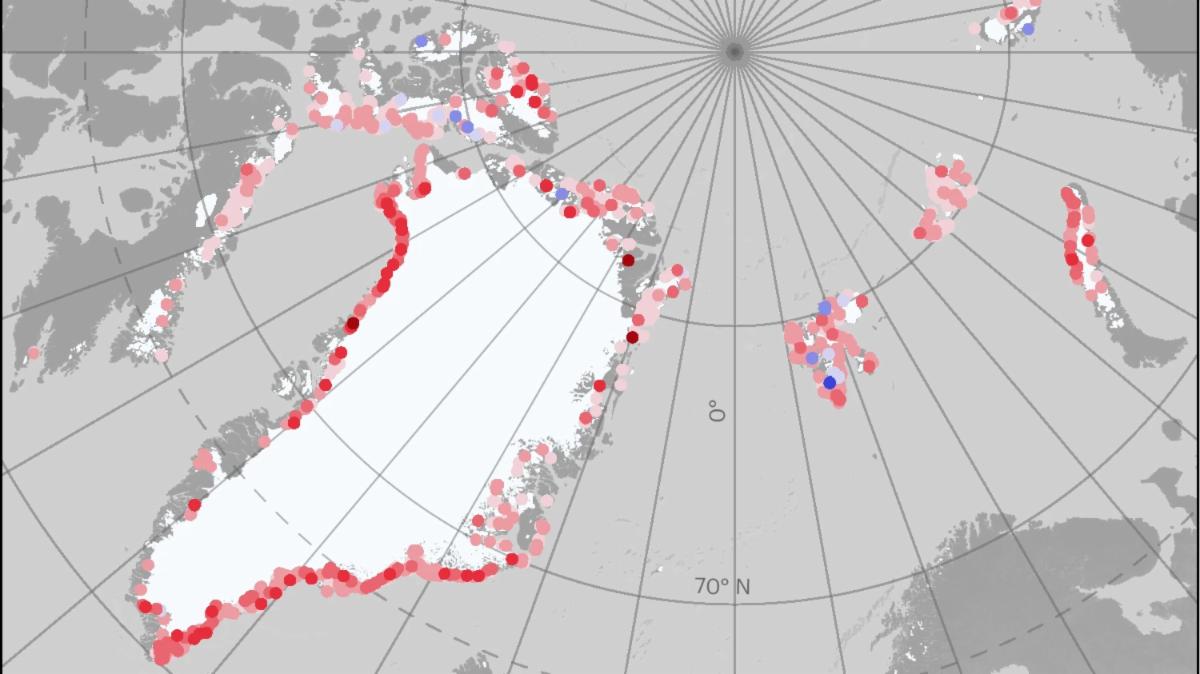
Across the Arctic, melting glaciers are exposing new coastline. This new coastline has important impacts on local ecosystems and human communities, but it’s been largely overlooked by researchers. In Kavan et al, 2025, published last month in Nature Climate Change, an international team of researchers identified nearly 2,500 km (over 1,550 miles) of new coastline created by glacial retreat between 2000 and 2020. Nearly two thirds (66%) of that coastline was exposed in Greenland. They also looked at glacial advance and coastline loss in the Arctic, finding that less than 55 km (34 miles) of coastline was lost due to growing glaciers. To map the Arctic’s changing coastline, the researchers used a dataset of all marine-terminating glaciers in the Northern Hemisphere. Then, they used false-color imagery from Sentinel-2 to identify the new shoreline and check glacier margin accuracy. To reach back in time to 2000, they used true-color imagery from Landsat 7, which allowed them to measure glacial advance and coastline loss. Emerging coastlines change the dynamics of this ice-dominated region, with varied ecological, economic, and geomorphological impacts.

Map showing the Arctic. Red dots around Greenland and other other Arctic landmasses indicate new coastline exposed as a result of glacial retreat.

Length of new and lost coastline in the Arctic from 2000-2020. Red dots represent the length of new coastline due to glacial retreat, with more new coastline represented by darker reds. Blue dots represent the length of lost coastline due to glacial advance, with greater loss represented by darker blues. Image credit: Kavan et al., 2025

Find more selected Landsat publications on our website.

Tracking Glaciers with Landsat

A false-color Landsat image of Alaska's Mendenhall Glacier. Vegetation is green, water is black, and ice is blue.

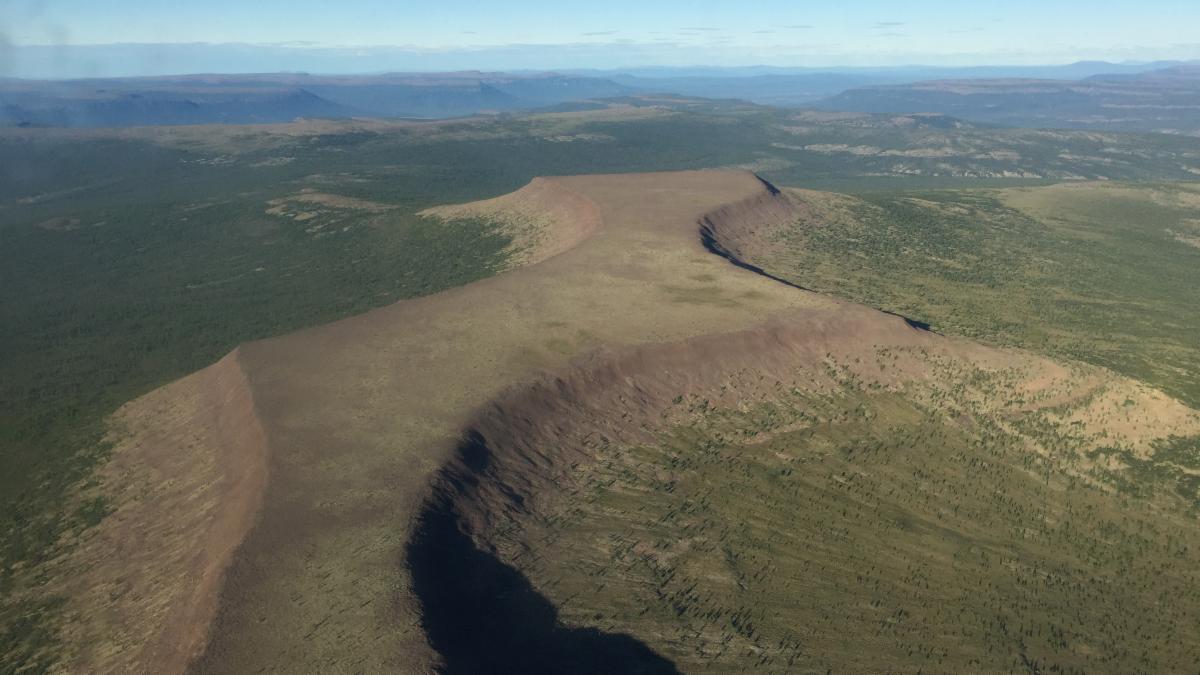
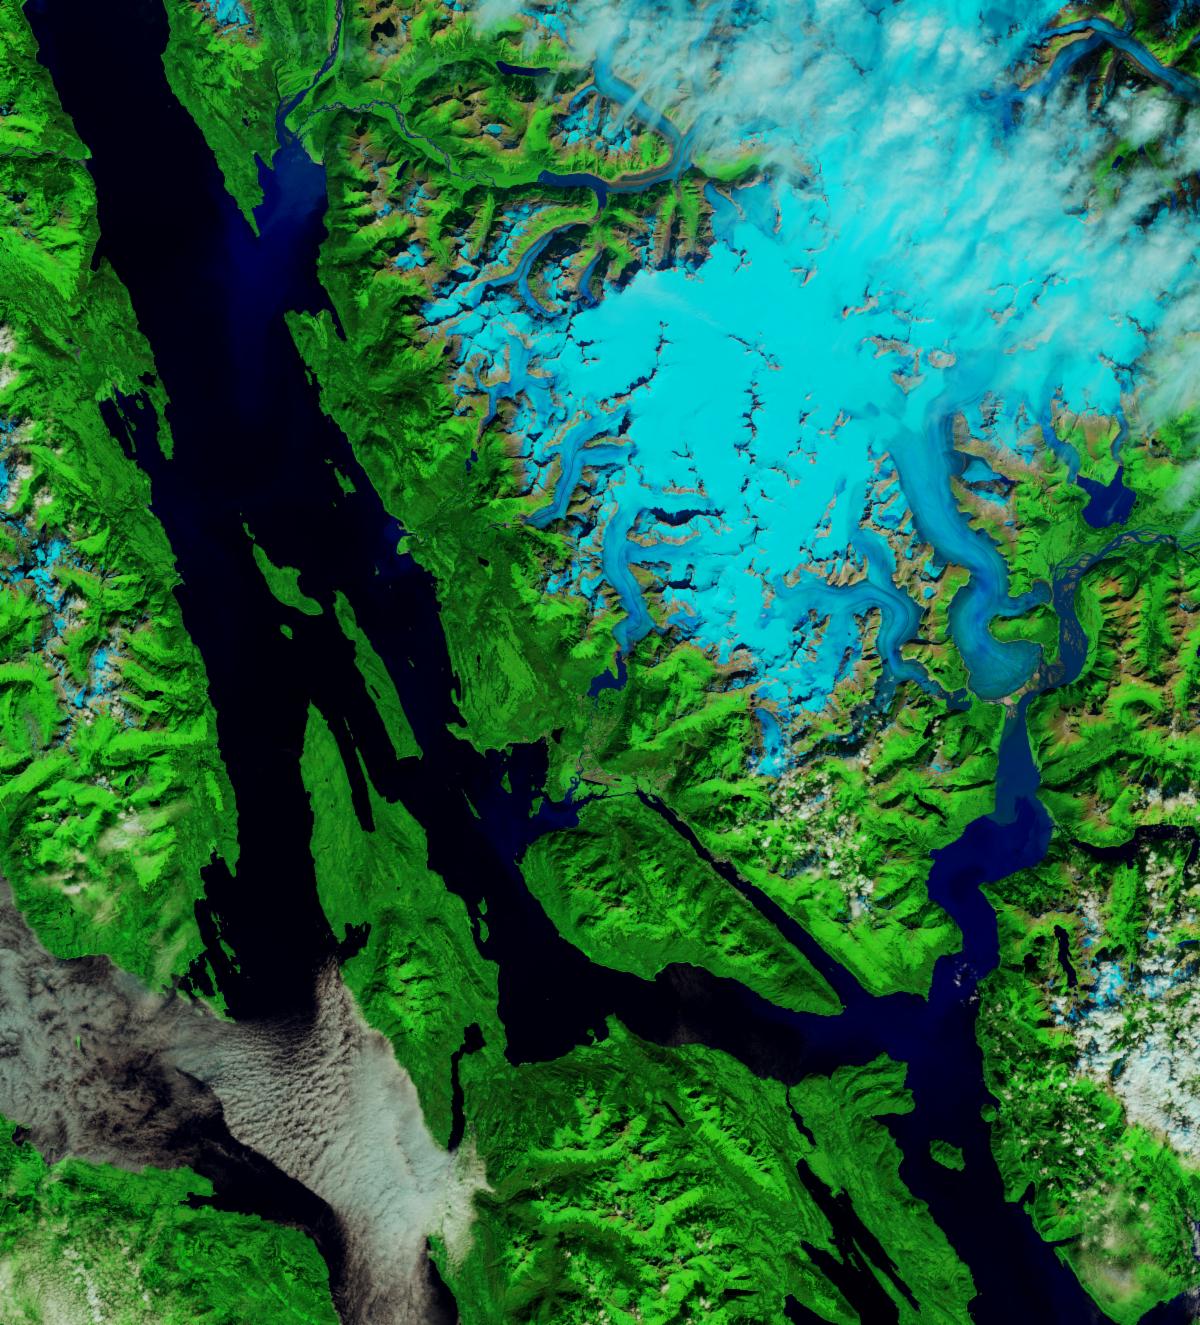
Landsat imagery shows how the size of Alaska's Mendenhall Glacier changed from 1986 to 2024, using infrared bands to differentiate ice, rocks & soil, and vegetation. The glacier has retreated about a mile, and in some places thinned by 2,000 feet.


Although Mendenhall’s retreat began centuries ago, warming have accelerated its decline. Between 2005 and 2019, the wider Juneau Icefield (Mendenhall’s source) lost 63 of 1,050 glaciers and 10% of its ice.


Satellites like Landsat help scientists track these changes over time, as seen in a recent reel on the NASA Climate Change Instagram.


+ Get reel

NASA Earth Observatory

Selected Landsat Images

March 20, 2025

An Asteroid's Bite in Australian Mountain Range


The asteroid that smashed into northern Australia and caused the Amelia Creek impact structure transformed mountain ridges in the blast zone.

A satellite image shows several curving ridges that are part of the Davenport Range in a desert landscape in northern Australia. Near the center of the image, the mostly parallel ridges become jumbled and cut abruptly toward the southeast. Geologists have assembled evidenced showing that the deformation was caused by an asteroid collision about 600 million years ago.

March 17, 2025

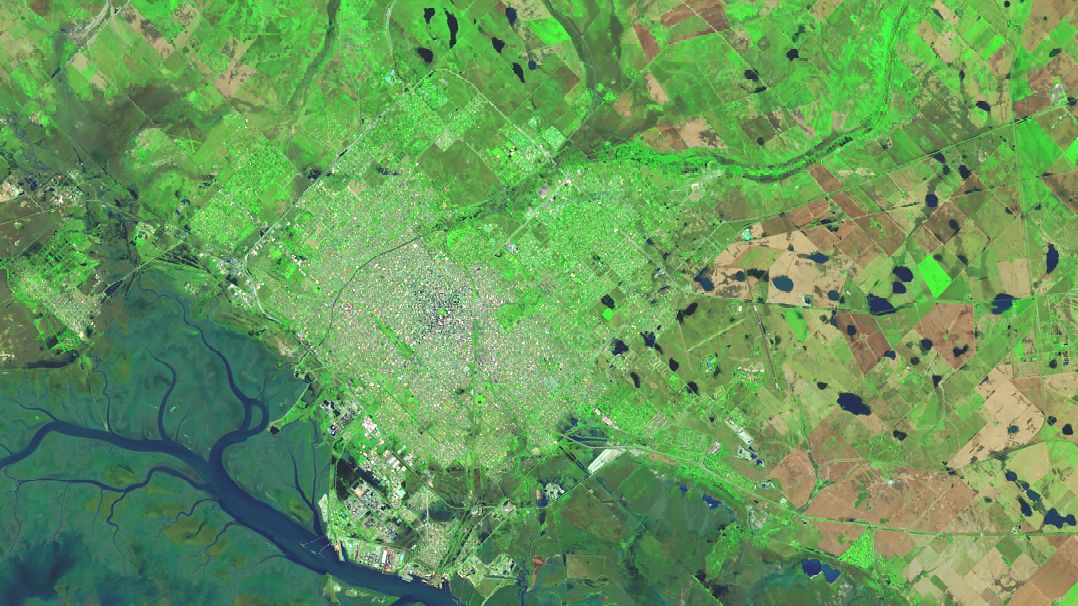
Bahía Blanca Inundated


Torrential rains set off dangerous flash flooding in the Argentinian port city.

A false-color satellite image shows the Argentinian port city, Bahía Blanca, after an intense rainstorm. Areas of flooding are visible within developed areas. Fields surrounding the city appear greener and have many areas of standing water. The estuary south of the city appears more saturated.

March 13, 2025

Nyamulagira Brings the Heat


Clouds parted to reveal fresh lava flows on the slopes of the East African Rift volcano.

A satellite image shows the wide crater of Nyamulagira Volcano. Light brown to black lava flows radiate from the crater, and the rest of the volcano’s slopes are green with vegetation. An infrared signature shown in red indicates an area of heat within the crater, and a gray volcanic plume drifts from it to the southwest.

March 5, 2025

A Proliferation of Lakes on the Tibetan Plateau


Satellites have documented lakes on the “roof of the world” becoming larger and more numerous over the past three decades.

A second image taken in 2024 shows the same area. The landscape is the same color except now there are dozens of new lakes visible. Lakes that were visible in the 1994 image are much larger.

A Fond Farewell


You will see a new name and face sending you the NASA Landsat Science News Digest next month. After 25 years with the Landsat Communication and Public Engagement Team, I am saying farewell. The newsletter is in expert hands. Expect great things! ~Laura E.P. Rocchio

You'll have a new face in your inbox next month! Farewell from Laura.

Did someone forward this newsletter to you? Subscribe here if you'd like to be on our mailing list.

landsat.gsfc.nasa.gov

Facebook  X