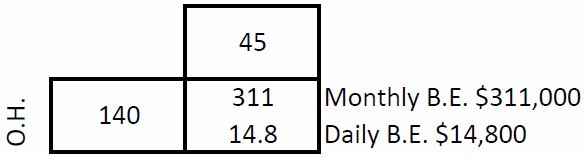
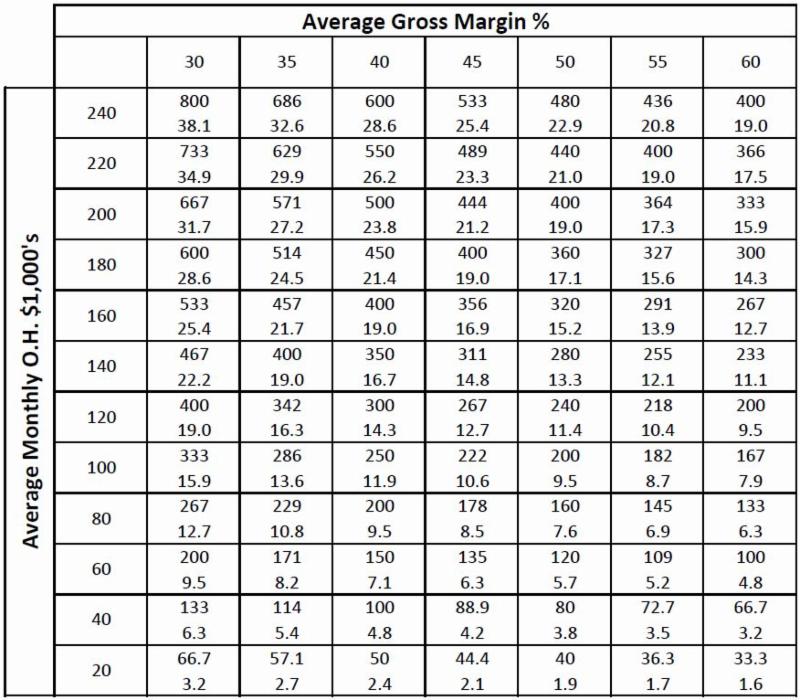
*It is ok to interpolate between the numbers*
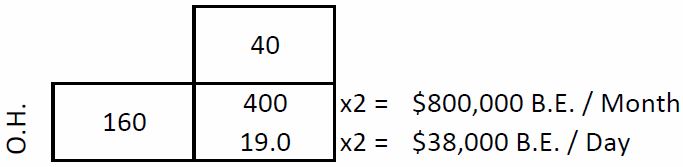
The O.H. on this chart only goes to $240,000 per month. If your O.H. is more than $240,000, go into the chart at 1/2 of your O.H., go across to your average G.M.%, drop down to B.E. $ and double it.
Example: O.H. $320,000; G.M. 40%