Information and interactive calculators are made available to you as self-help tools for your independent use and are not intended to provide investment, tax, or legal advice. We cannot and do not guarantee their applicability or accuracy in regards to your individual circumstances. All examples are hypothetical and are for illustrative purposes. We encourage you to seek personalized advice from qualified professionals regarding all personal finance issues. (57-LPL) | | |
The 2025 OUTLOOK is HERE!
In case you missed it, make sure to take a look at the...
2025 Outlook: Pragmatic Optimism
**IMPORTANT DISCLOSURES
This material is for general information only and is not intended to provide specific advice or recommendations for any individual. The economic forecasts may not develop as predicted. Please read the full OUTLOOK 2025: Pragmatic Optimism publication for additional description and disclosure. This research material has been prepared by LPL Financial LLC.
| | Fait Accompli \fe takɔ̃ˈpli\ noun: an accomplished fact; a thing already done | | |
Cornerstone Fait Accompli
Did you know that 35% of families use a college savings fund (such as a tax-deductible 529 plan) to save an average of $6,844 each.
| | Prior to investing in a 529 Plan investors should consider whether the investor's or designated beneficiary's home state offers any state tax or other state benefits such as financial aid, scholarship funds, and protection from creditors that are only available for investments in such state's qualified tuition program. Withdrawals used for qualified expenses are federally tax free. Tax treatment at the state level may vary. Please consult with your tax advisor before investing. (19-LPL) | | | | Did you see our latest post? | |
Never miss a Cornerstone announcement - make sure you are following us on Facebook!
When you follow us you'll get access to up to date market information, helpful financial planning tools like calculators, and all of the Cornerstone office happenings!
Click the button below,
make sure you're logged into your account and follow our Facebook page.
| | Click on the buttons below and don't forget to like, comment and share our posts! | | |
Can Earnings Catch Up to This Stock Market Rally?
First quarter reporting season was solid, but results didn’t offer much of a confidence boost in the outlook for the rest of the year. It wasn’t corporate America’s fault — tariff uncertainty makes it very difficult for most companies to offer an outlook that they can have confidence in. Analysts did get enough guidance to take estimates down for the rest of the year to credible levels, which is a positive step in restoring market confidence. And the top technology companies did their part by delivering very strong results while reiterating capital investment guidance that is key to driving growth in S&P 500 profits. Still, these results left us unsure as to whether earnings justify stock prices.
Solid, But Backward-Looking Results
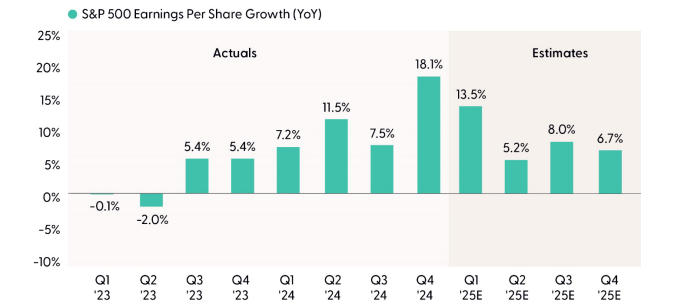
During more normal times, we would be celebrating these results. S&P 500 earnings per share (EPS) are tracking to a 13.5% year-over-year increase. The average company has delivered a very solid average upside earnings surprise of 8.3%, the best since Q1 2024. And an excellent 78% of S&P 500 companies beat consensus estimates. Index operating margins are tracking better than expected at a 0.6% quarter-over-quarter increase (15.1% to 15.7%). These numbers may get even better this week when chip giant NVIDIA (NVDA) reports after market close on Wednesday, May 28.
These results are particularly welcome because they set a higher base from which to absorb future tariff hits. Remember, the first quarter ended before most tariffs went into effect. That said, the pace of earnings growth is poised to slow as the economy slows and tariffs bite. While current estimates may be credible in a blue-sky tariff scenario, they are way too high for a more onerous tariff regime.
Earnings Growth Poised to Slow After Strong First Quarter
| |
Source: LPL Research, FactSet, 05/22/25
Disclosures: Indexes are unmanaged and cannot be invested in directly. Estimates may not materialize as predicted and are subject to change.
In terms of sectors, healthcare and communication (comm) services posted the strongest earnings growth, though healthcare’s 43% growth rate was inflated by big losses by Bristol Myers Squibb (BMY) and Gilead (GILD) in the year-ago quarter. Comm services’ 29% increase in earnings was driven largely by digital communications, notably Alphabet (GOOG/L) and Meta (META).
The top three contributors to overall S&P 500 EPS growth included healthcare, comm services, and technology, which drove about 11 percentage points of the 13.5% increase in S&P 500 EPS for the quarter. Comm services and utilities generated the biggest margin improvement year over year, with utilities benefiting from strong power demand.
Conversely, the only sectors that detracted from overall earnings growth were energy and consumer staples. Energy struggled with lower oil prices, as the average price of West Texas Intermediate (WTI) crude dropped 7% from Q1 2024 to Q1 2025, while weakness in refiners also weighed on the sector’s profitability. Consumer staples earnings were hurt by food companies struggling with inflation and trade tensions.
The tail end of reporting season, heavy on retailers, was mixed, with Target (TGT) struggling and Walmart (WMT) drawing the ire of the White House by talking about tariff-driven price hikes. Relatively upbeat commentary from the home improvement retailers about business trends in April and May was nice to hear. And auto parts retailers appear well positioned for this environment, so for stock pickers in search of consumer names, those industry groups may be worth considering. Comments from retailers reporting this week will be interesting.
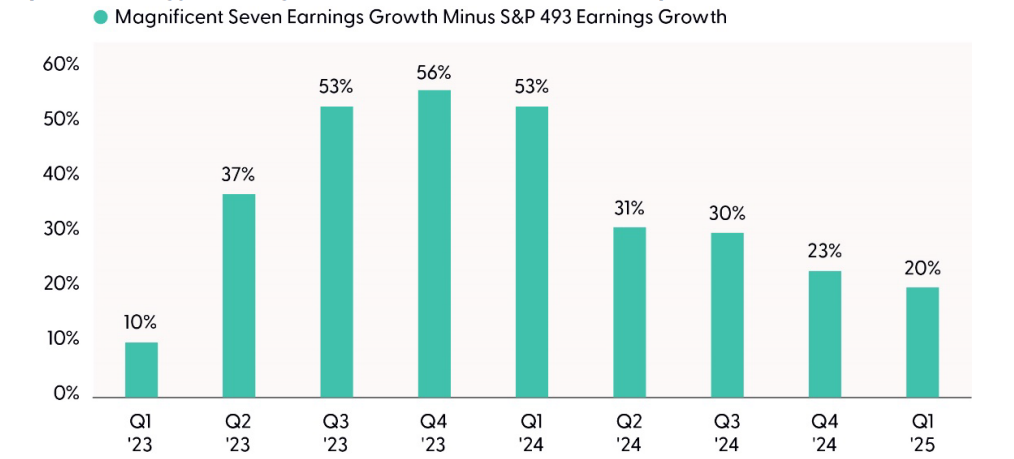
Magnificent Seven Continues to Carry the Load
Perhaps the biggest positive surprise this earnings season was the near-30% earnings growth from the Magnificent (Mag) Seven and that every one of them maintained their capital expenditures (capex) guidance for the year — or in Meta’s case, increased it. After NVDA reports this week, these seven companies will likely end up driving nearly half of the S&P 500’s EPS growth overall. This capex — totaling over $330 billion — is good for earnings overall because that spending is revenue for someone, and it can drive productivity gains over time, good for profit margins for the rest of the S&P 500 — the so-called 493. As shown in the “Mega Cap Technology Earnings Growth Continues to Far Outpace Rest of Market” chart, this group continues to dominate the earnings growth of the rest of the companies in the index. The gap is narrower than it was a year ago, and the 493’s earnings growth has improved to near 10%, but it’s a far cry from the near 30% growth from this impressive group of big tech companies.
Mega Cap Technology Earnings Growth Continues to Far Outpace Rest of Market
| | |
Source: LPL Research, Bloomberg, JPMorgan Chase, 05/22/25
Disclosures: Indexes are unmanaged and cannot be invested in directly.
Trade Uncertainty Remains a Big Wildcard
Good first quarter numbers are of course better than the alternative, but as investors, we are looking through the front windshield, not the rearview mirror. As we look forward, our vision is clouded by tariff uncertainty. Threats of higher tariffs on the European Union and Apple (AAPL) last week reminded investors that these rates could go higher. Even if tariffs stay at current rates, the overall weighted average global rate for U.S. imports would be around 13%, more than 10% above the rate when President Trump took office. Even this arguably best-case scenario would likely result in at least a 3% hit to S&P 500 EPS.
Earnings Estimates Are Now Credible, But Probably Only For Best Case Tariff Scenario
We have discussed ad nauseum how companies have such limited visibility into the margin environment for the rest of the year because of tariffs that they would either pull guidance or make it vague. Well, that’s generally what we got. Some companies gave conditional guidance depending on the economic environment. Some companies gave guidance excluding tariffs. Few companies pulled guidance, perhaps a silver lining, though we did get fewer companies providing outlooks than usual.
Another silver lining is this. Of the 251 S&P 500 companies that provided EPS guidance for the full year, 139 maintained previous guidance, 64 raised guidance, and 37 provided lower guidance (8 pulled guidance entirely). That ratio of raised vs. negative guidance, as data aggregator FactSet defines it, is quite good historically, although these statistics are inflated by first quarter upside.
A broader measure of earnings estimates revised up vs. down by Bloomberg for the second quarter reveals EPS estimates for S&P 500 companies getting cut at the highest rate in over a decade (39% down vs. 22% up). And we know forward estimates for the broad S&P 500 (bottom-up) have come down by about 3.5% since the end of the first quarter, even though some outlooks exclude tariffs and are therefore inflated. And tariffs or no tariffs, this economy is slowing, and consumers continue to struggle with inflation.
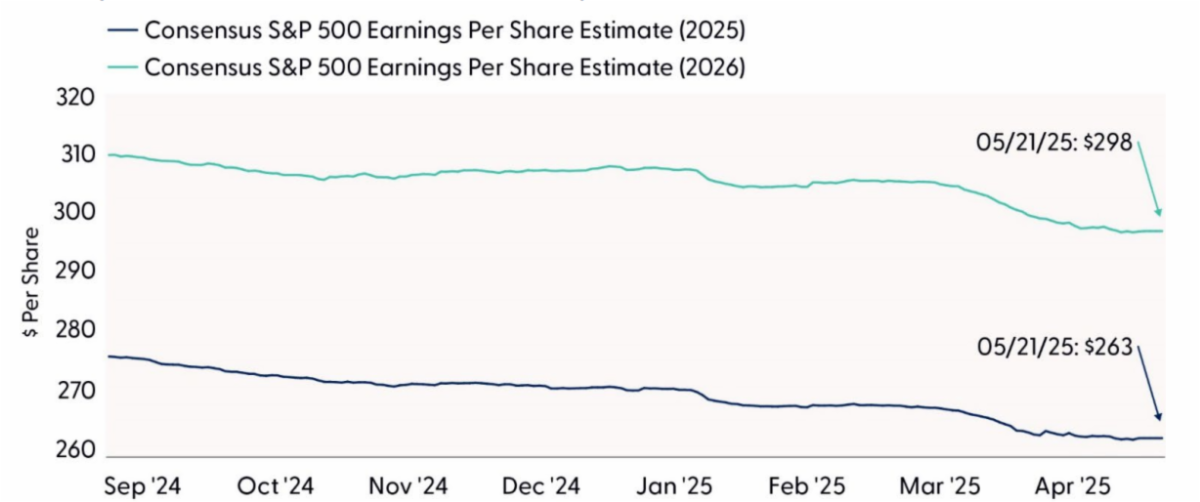
Bottom line, LPL Research still believes S&P 500 EPS in the $255 range for 2025 is a reasonable expectation, with possible upside to $260 if tariffs end up below current levels.
Earnings Estimates for 2025 and 2026 Are Likely Still Inflated
| |
Source: LPL Research, FactSet, 05/22/25
Indexes are unmanaged and cannot be invested in directly. Estimates may not materialize as predicted and are subject to change.
Conclusion
Good first quarter numbers are of course better than the alternative, but as investors, we drive looking through the front windshield, not the rearview mirror. As we look forward, our vision is clouded by tariff uncertainty. Even if tariffs stay at current rates, the overall weighted average global rate for U.S. imports would be around 13%, more than 10% above the rate when President Trump took office. Even this arguably best-case scenario would likely result in at least a 3% hit to S&P 500 EPS, leaving us questioning whether the earnings outlook justifies the latest rally.
Thankfully, corporate America’s foundation is strong as tariffs begin to hit. For those who believe Trump 2.0 will look more like 1.0 and the Art of the Deal (we have our doubts) and expect more tax cuts to help support earnings in 2026 (as we do), then the earnings outlook is strong enough to support stocks at current elevated valuation levels. The problem is visibility is low and margin risks from tariffs are high. We wish we could dismiss the risk of higher tariffs, but we can’t — at least not yet.
Asset Allocation Insights
LPL’s Strategic and Tactical Asset Allocation Committee (STAAC) maintains its tactical neutral stance on equities. Following the recent stock market rebound, the Committee does not rule out the possibility of a reversal lower amid ongoing tariff uncertainty and does not find the risk-reward trade-off for stocks particularly attractive in the short term. LPL Research continues to monitor tariff negotiations, economic data, earnings, the bond market, and various technical indicators to identify a potentially more attractive entry point to add equities on weakness.
During periods of policy uncertainty, LPL Research prefers to stray little from its benchmarks. In that spirit, the Committee recently upgraded emerging market (EM) equities to neutral, leaving regional preferences across the U.S, developed international, and EM aligned with benchmarks. Among sectors, the Committee favors just comm services and financials.
Within fixed income, the STAAC holds a neutral weight in core bonds, with a slight preference for mortgage-backed securities (MBS) over investment-grade corporates. In our view, the risk-reward for core bond sectors (U.S. Treasury, agency MBS, investment-grade corporates) is more attractive than plus sectors. We believe adding duration isn't attractive at current levels, and the STAAC remains neutral relative to our benchmarks. The Committee would get more interested in adding long-term bonds if the U.S. 10-Year Treasury yield got closer to 5%.
| | Etymology /edəˈmäləjē/ noun: the origin of a word and the historical development of its meaning. | | Game Theory: Game theory is the study of how and why individuals and entities (called players) make decisions about their situations. It is a theoretical framework for conceiving social scenarios among competing players. In some respects, game theory is the science of strategy, or at least of the optimal decision-making of independent and competing actors in a strategic setting. | | |
Have you taken advantage of
CAPS
yet?
Don't miss out!
Many of our clients ask how they benefit from taking action and initiating a Financial Plan for themselves.
When you sign up for our CAPS program, you will get access to:
A personalized financial plan, a place to keep all of
your accounts in one location and a secure place to store your
important documents.
Click Here to Learn More
| | Le commentaire \ˈkɒmɛnt\ masculine noun: a French word meaning a remark or comment | | |
Cornerstone Commentaire
"The future belongs to those who believe in the beauty of their dreams."
- Eleanor Roosevelt
| | Stay Safe, Stay Kind, Stay Strong, Stay Well | | |
P.S. Please feel free to forward this commentary to
family, friends, or colleagues.
+++++++++++++++++++++++++++
The highest compliment
you can give us would be the
referral
of your friends or family!
| | |
The information contained in this email message is being transmitted to and is intended for the use of only the individual(s) to whom it is addressed. If the reader of this message is not the intended recipient, you are hereby advised that any dissemination, distribution, or copying of this message or content is strictly prohibited. If you have received this message in error, please immediately delete.
Information and interactive calculators are made available to you as self-help tools for your independent use and are not intended to provide investment, tax, or legal advice. We cannot and do not guarantee their applicability or accuracy in regards to your individual circumstances. All examples are hypothetical and are for illustrative purposes. We encourage you to seek personalized advice from qualified professionals regarding all personal finance issues.
Securities and advisory services offered through LPL Financial (LPL), a registered investment advisor and broker-dealer (member FINRA/SIPC). Insurance products are offered through LPL or its licensed affiliates. To the extent you are receiving investment advice from a separately registered independent investment advisor that is not an LPL affiliate, please note LPL makes no representation with respect to such entity.
Important Disclosures
This material is for general information only and is not intended to provide specific advice or recommendations for any individual. There is no assurance that the views or strategies discussed are suitable for all investors or will yield positive outcomes. Investing involves risks including possible loss of principal. Any economic forecasts set forth may not develop as predicted and are subject to change.
References to markets, asset classes, and sectors are generally regarding the corresponding market index. Indexes are unmanaged statistical composites and cannot be invested into directly. Index performance is not indicative of the performance of any investment and do not reflect fees, expenses, or sales charges. All performance referenced is historical and is no guarantee of future results.
Any company names noted herein are for educational purposes only and not an indication of trading intent or a solicitation of their products or services. LPL Financial doesn’t provide research on individual equities.
All information is believed to be from reliable sources; however, LPL Financial makes no representation as to its completeness or accuracy.
All investing involves risk, including possible loss of principal.
US Treasuries may be considered “safe haven” investments but do carry some degree of risk including interest rate, credit, and market risk. Bonds are subject to market and interest rate risk if sold prior to maturity. Bond values will decline as interest rates rise and bonds are subject to availability and change in price.
The Standard & Poor’s 500 Index (S&P500) is a capitalization-weighted index of 500 stocks designed to measure performance of the broad domestic economy through changes in the aggregate market value of 500 stocks representing all major industries.
The PE ratio (price-to-earnings ratio) is a measure of the price paid for a share relative to the annual net income or profit earned by the firm per share. It is a financial ratio used for valuation: a higher PE ratio means that investors are paying more for each unit of net income, so the stock is more expensive compared to one with lower PE ratio.
Earnings per share (EPS) is the portion of a company’s profit allocated to each outstanding share of common stock. EPS serves as an indicator of a company’s profitability. Earnings per share is generally considered to be the single most important variable in determining a share’s price. It is also a major component used to calculate the price-to-earnings valuation ratio.
All index data from FactSet or Bloomberg.
This research material has been prepared by LPL Financial LLC.
| |
For public use.
Member FINRA/SIPC.
RES-0004065-0425 Tracking #745004 | #745006 (Exp. 05/26)
Securities and Advisory Services offered through LPL Financial, a Registered Investment Advisor. Member FINRA / SIPC .
Privacy Policy | LPL.com
| | | | |