Congress does not want to deal with our government spending problem. Even the widely reported spending cuts targeting fraud triggered by Elon Musk's DOGE team have not been able to move the needle. Compared to last year, spending is STILL increasing. Let's look at some of the data and discuss the implications. | | Market Update - April 2025 | |
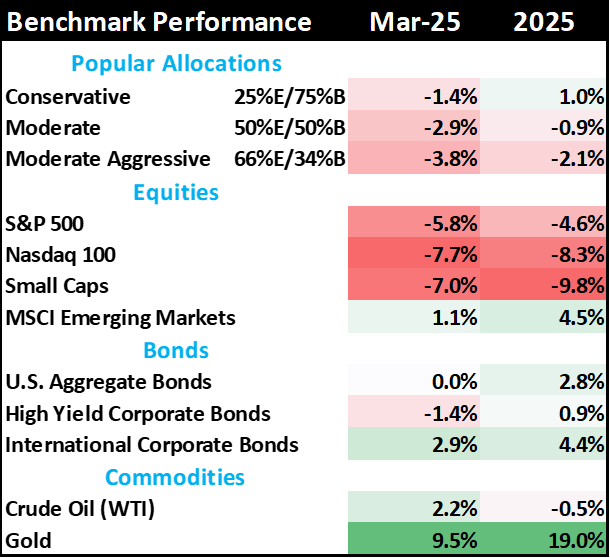
- In the equity market, there is a clear rotation from growth to value during March: Energy, Utilities, and Consumer Staples did well, while Technology, Consumer Discretionary, and Industrial stocks fell. This behavior signals investors getting ready for an economic slowdown.
- Bonds did not move much during March, but are up since the beginning of the year, especially international bonds. These investors do not seem to be worried about the inflationary aspects of government spending discussed below.
- While we don't see recessionary signs in the employment or earnings data, investors are very nervous about the implications of a tit-for-tat trade war with the rest of the world. President Trump is looking at this as the late 1800s, not the Smoot-Hawley era in 1930 as a planning template. The US used tariffs extensively during the 19th century.
| | Table 1: Market performance estimates as of 3/31/2025 (LIMW) | | GDPNow update: adjusted for gold imports | | |
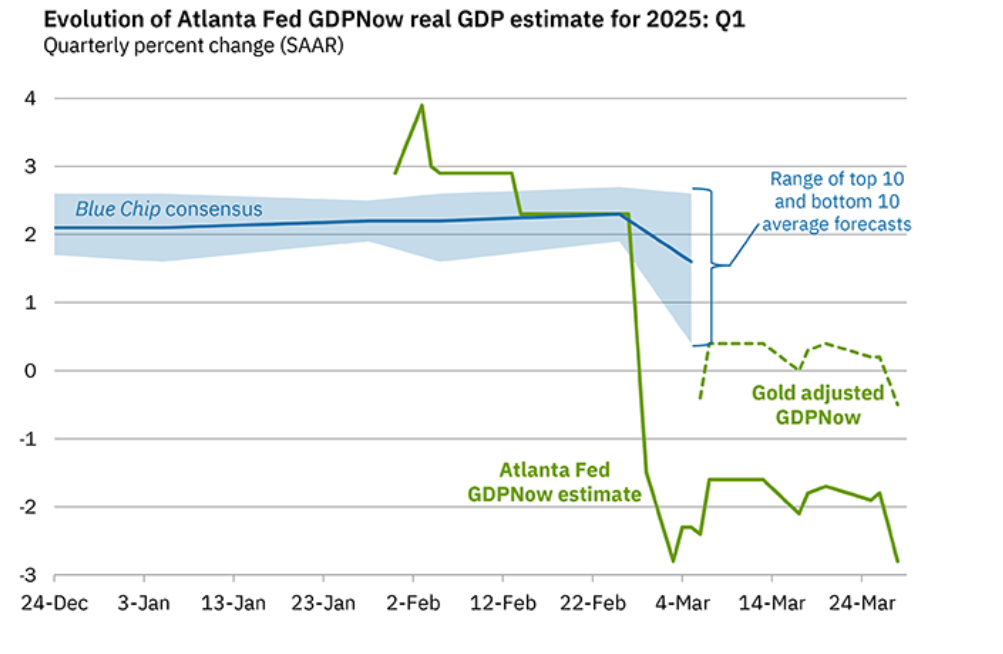
Last month I showed you the GDPNow forecast from the Atlanta Federal Reserve. This indicator pulls in reported data to provide an early estimate of the quarterly Gross Domestic Product (GDP) report using the 13 subcomponents that make up GDP: Durable Goods, Non-durable Goods, Services, Fixed Investment, Nonresidential Investment, Structures, Equipment, Intellectual Property, Change in Private Inventories, Exports, Imports and Government Spending.
Each component is reported before the official GDP calculation, so by pulling in recent data points, the Atlanta Fed is trying to get an early read on GDP before it is actually calculated. There is a long discussion about this HERE.
A few weeks ago, there was a dramatic reduction in the GDPNow estimate because of the massive amounts of European gold getting repatriated to the United States. This value transfer is showing up in the Import line of the GDP calculation: higher imports = lower GDP.
Now, why is all this gold leaving Europe? We outsiders can't be sure, but it could be any of the following recent policy changes:
- President Trump's tariff threats.
- European changes to banking laws reducing depositor protections.
- European's desire to start a war with Russia.
- An audit of US gold reserves is forcing gold loans to be called in.
The important point here is that even AFTER adjusting for the gold flows, GDPNow is estimating a NEGATIVE 1Q2025 GDP report in May.
Figure 1: GDPNow forecast for 1Q2025 (Atlanta Federal Reserve)
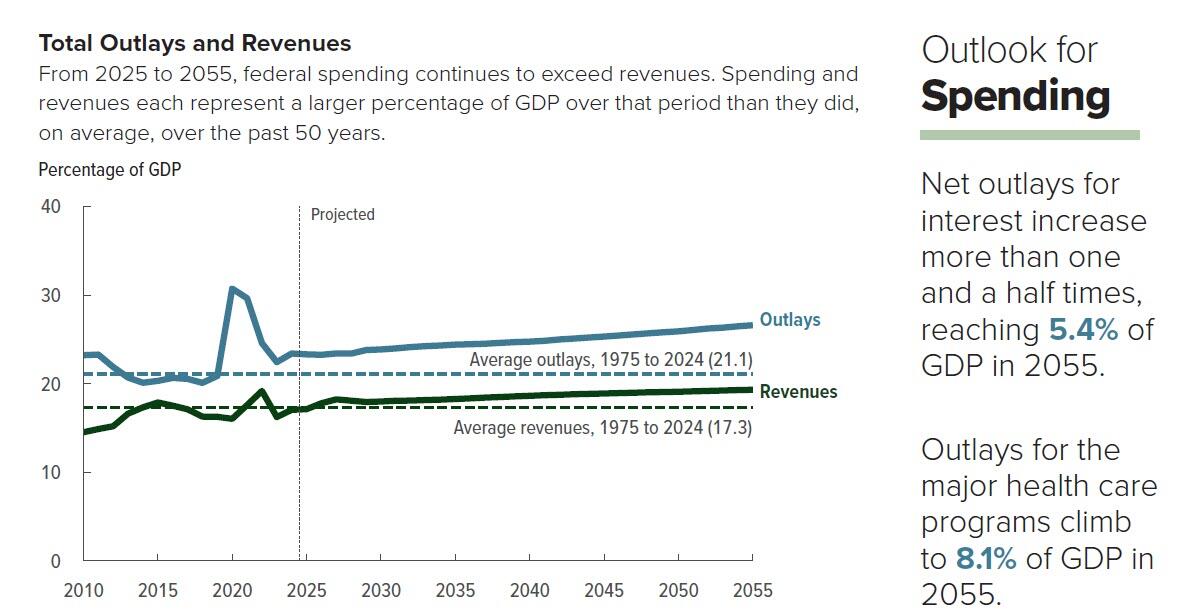
| | The following discussion on government spending is ONLY provided to allow us to analyze the economic and market impact of these policies. This is NOT a prescription for one policy over another, but an evaluation of likely outcomes given the current situation. | | Government spending is unsustainably high and getting worse | | Many of you are aware that the United States is running massive budget deficits as spending runs well ahead of the tax revenue. Congress is filling in this gap with borrowed money; ~$2 trillion in 2024 and on track for $2.7 trillion in 2025. As a nation, we seem numb to reports of reckless spending. However, the levels of foolishness are climbing to new and dangerous highs. | | Figure 2: Total outlays and revenues 2010-2055 (Congressional Budget Office CBO) | | |
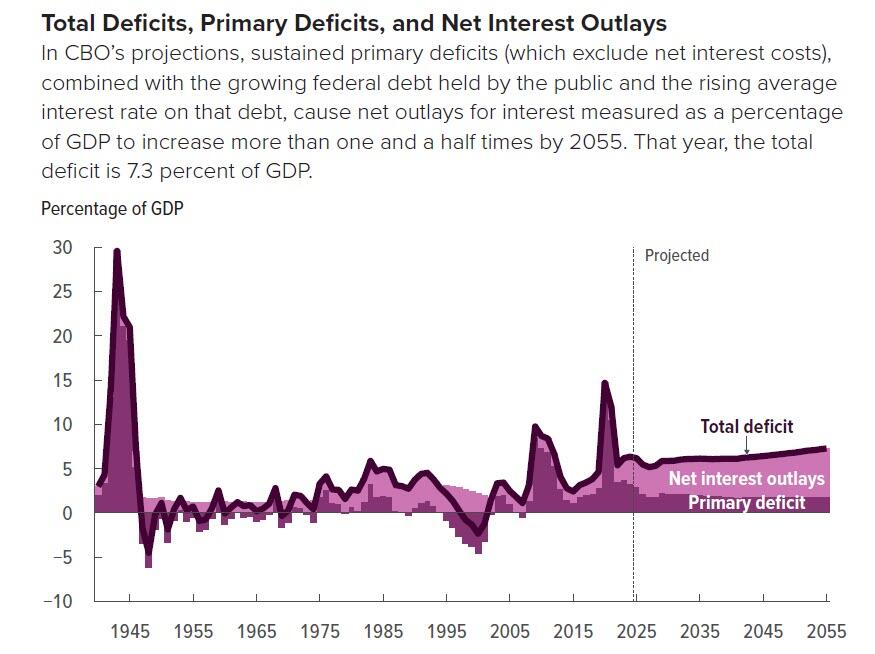
But it is even worse than depicted in the last chart because with higher interest rates, we are paying nearly a $1 TRILLION per year in interest expense. Some analysts are estimating this number will creep higher as the average yield on the national debt rises to the current market rates of 4.0 - 4.5% from the current 3.3%.
After the Financial Crisis, this wasn't a problem because interest rates were ultra-low. After the pandemic, however, interest rates rose dramatically, increasing the interest expense on the federal budget. This is becoming a giant risk for our nation.
Figure 3: Total Deficit, Primary Deficit and Net Interest Expense (CBO)
| | |
The United States had a similar run in with high interest expenses during the 1970s and 1980s. Let's see how today's situation compares.
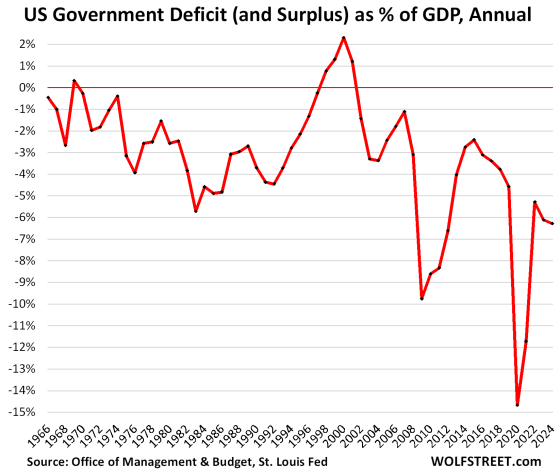
First, we can see that today's budget deficits as a % of GDP are bad, but only a little worse than recent years. The long-term deficit trend deteriorated gradually after 2000.
| | Figure 3: US Government Deficit as % of GDP (Wolfstreet.com) | | |
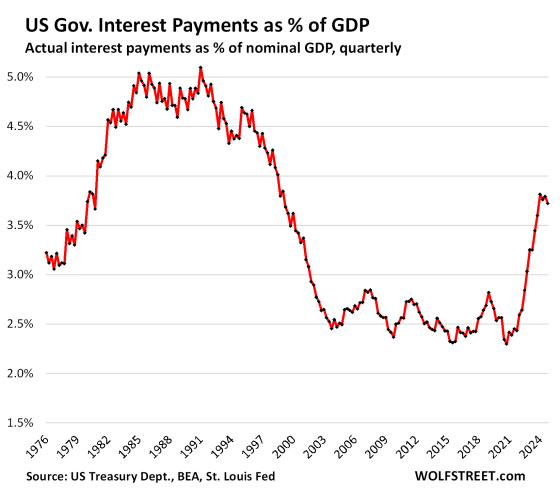
Even interest payments as a percentage of GDP don't look too bad compared to the 1970s and 1980s. Please note that our absolute debt to GDP levels are much higher than that time period, so the risk of a runaway inflation/debt/interest rate situation is also much higher.
For example, if the markets believed that the Federal government was not serious about controlling inflation and spending, they might stop buying US Federal Treasury bonds. That would drive up yields, slow the economy and collapse the currency. This exact scenario has happened to many countries over the last 100 years.
Figure 4: US Interest Payments as % of GDP
| | |
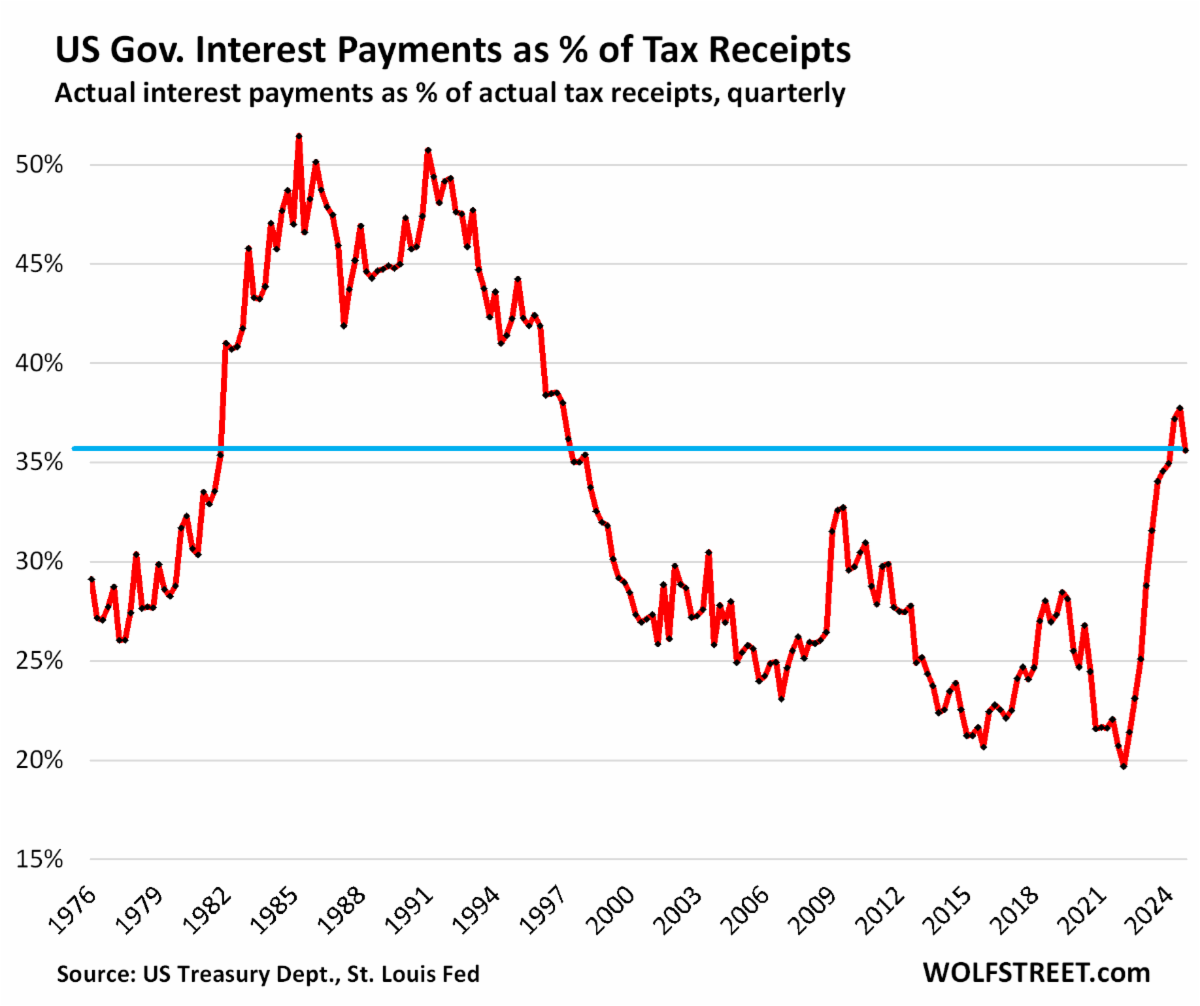
Comparing interest payments to tax receipts is also helpful. From a credit perspective, the United States today is in better shape than it was during the 1970s and 1980s with regards to ABILITY to pay the debt.
Figure 5: US Interest Payments as a % of Tax Receipts (Wolfstreet.com)
| | |
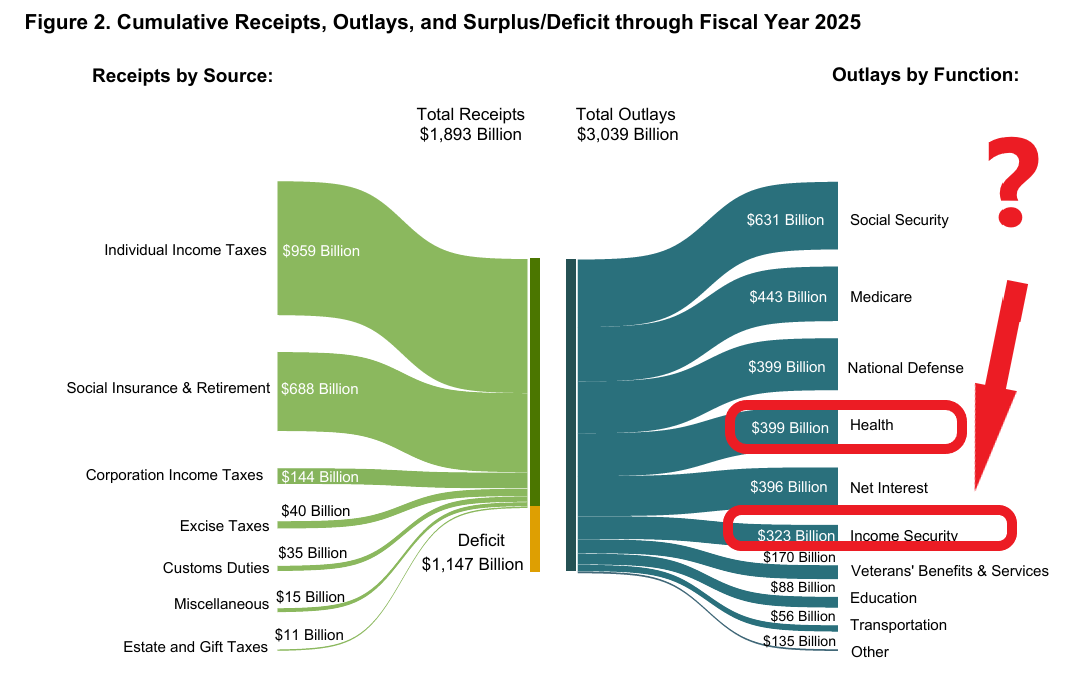
There are two gigantic line items in the federal budget that you probably don't hear much of: Income Security and Health.
The Income Security category is a catch-all for retirement, disability, unemployment, welfare, and similar programs, except for Social Security and income security for veterans, which are in other categories. It includes the Food Stamp, Special Milk, and Child Nutrition programs (whether the benefits are in cash or in kind); both federal and trust fund unemployment compensation and workers’ compensation; public assistance cash payments; benefits to the elderly and to coal miners; and low- and moderate-income housing benefits.
The Health category includes any physical or mental health expenditure, excluding Medicare, military health care, and research provided to individuals or families. These government programs pre-date the 2020 pandemic and were similarly large 5 years ago, so it's NOT all spending on illegal immigrants. The Health budget is as big as the National Defense budget.
Figure 6: Cumulative Receipts and Outlays FY2025 (Oct 2024-Feb 2025) (Treasury Department)
| | |
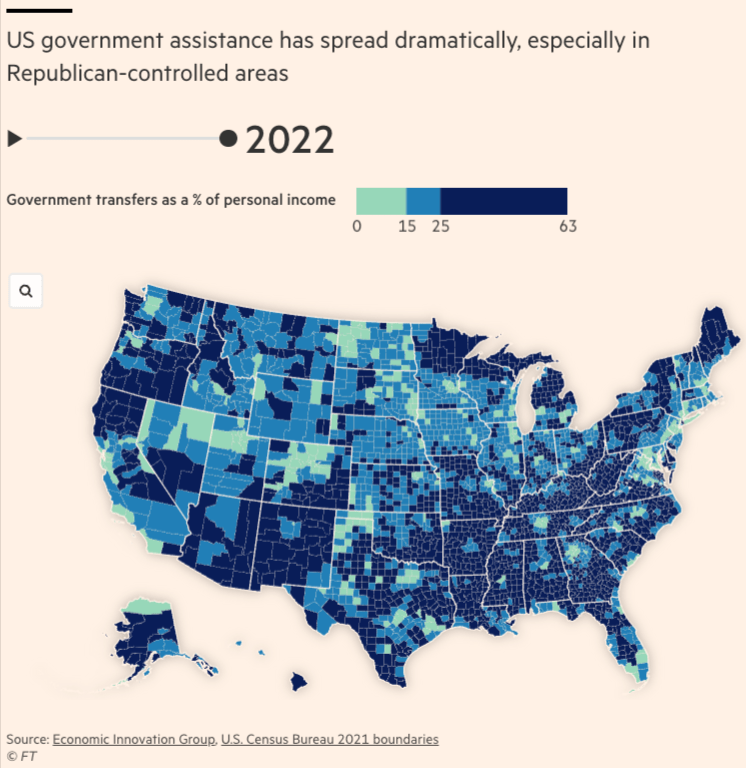
Here is an interesting analysis that shows the pervasive nature of government social spending. Most of the country is deeply dependent on government largess, even the conservative rural areas where President Trump is popular. Government payouts are a huge gravy train and many people are on it.
Figure 7: Government transfers as % of income (Economic Innovation Group, US Census Bureau)
| | |
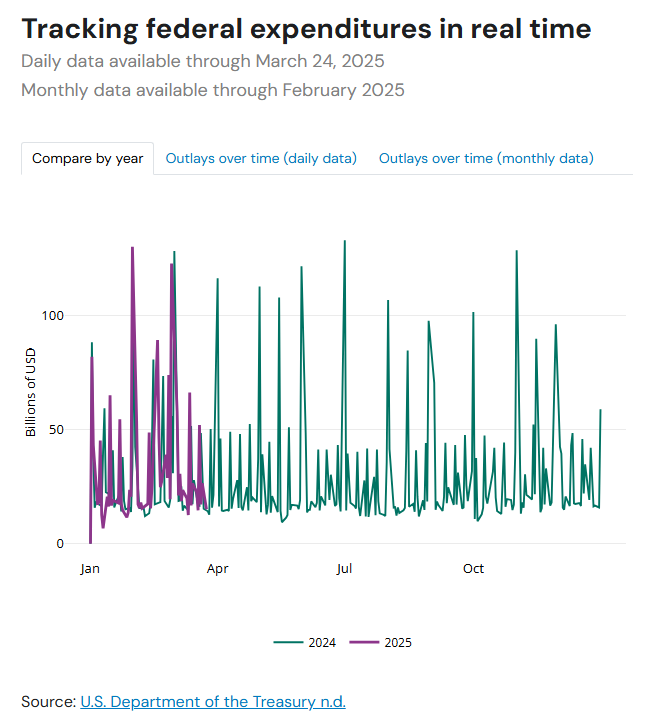
There was some hope that President Trump would encourage steps to control spending, but when we look at the daily expenditures from the Treasury department these last few months, we are tracking AHEAD of 2024. The DOGE budget cuts announced by Elon Musk aren't moving the needle at all on this spending freight train.
Figure 8: Federal Spending comparison 2024 versus 2025 (US Treasury)
| | |
The real question is what is the government's long-term strategy to control the outcome? There are three choices governments face in this situation and two are really popular:
-
Inflate the currency (Argentina 1977, 1991, 2001; Australia 1980; Brazil 1976; Canada 1967; Chile 1974; Colombia 1980; Egypt 1991; Finland 1982; France 1984; Germany 1980; India 1992; Italy 1983; Japan 1979; Korea 1991; Mexico 1978-1985; New Zealand 1984; Sweden 1980; United Kingdom 1981; United States 1951 and 1982.
-
Default/Restructure national debt (Australia 1932, Bolivia 1927, China 1932, France 1932, Greece 1932, Italy 1926, Italy 1934, Mexico 1932, New Zealand 1933, Peru 1931, Romania 1933, Spain 1936, United States 1933, United Kingdom 1932, Austria 1945, Germany 1948, Japan 1946, Russia 1947, 1957).
-
Paydown the debt by implementing austerity (none noted, although the German government has generally been a disciplined spender during the post WW2 period).
Source: The Liquidation of Government Debt (Carmen Reinhart & Belen Sbrancia)
You can see there is a tremendous incentive for the governments to create inflation to deal with the debt problem. If there is a war, outright defaults in addition to inflation will become likely.
Thus far, it looks like our government is taking option #1: Inflate the currency. This has negative long-term implications for bond investors.
| | President Trump's tariff strategy | | |
President Trump is determined to implement broad tariffs on imports. This is creating fears of high inflation and price increases that will hurt the broad consumer. This economic stress is a key driver of investor fear.
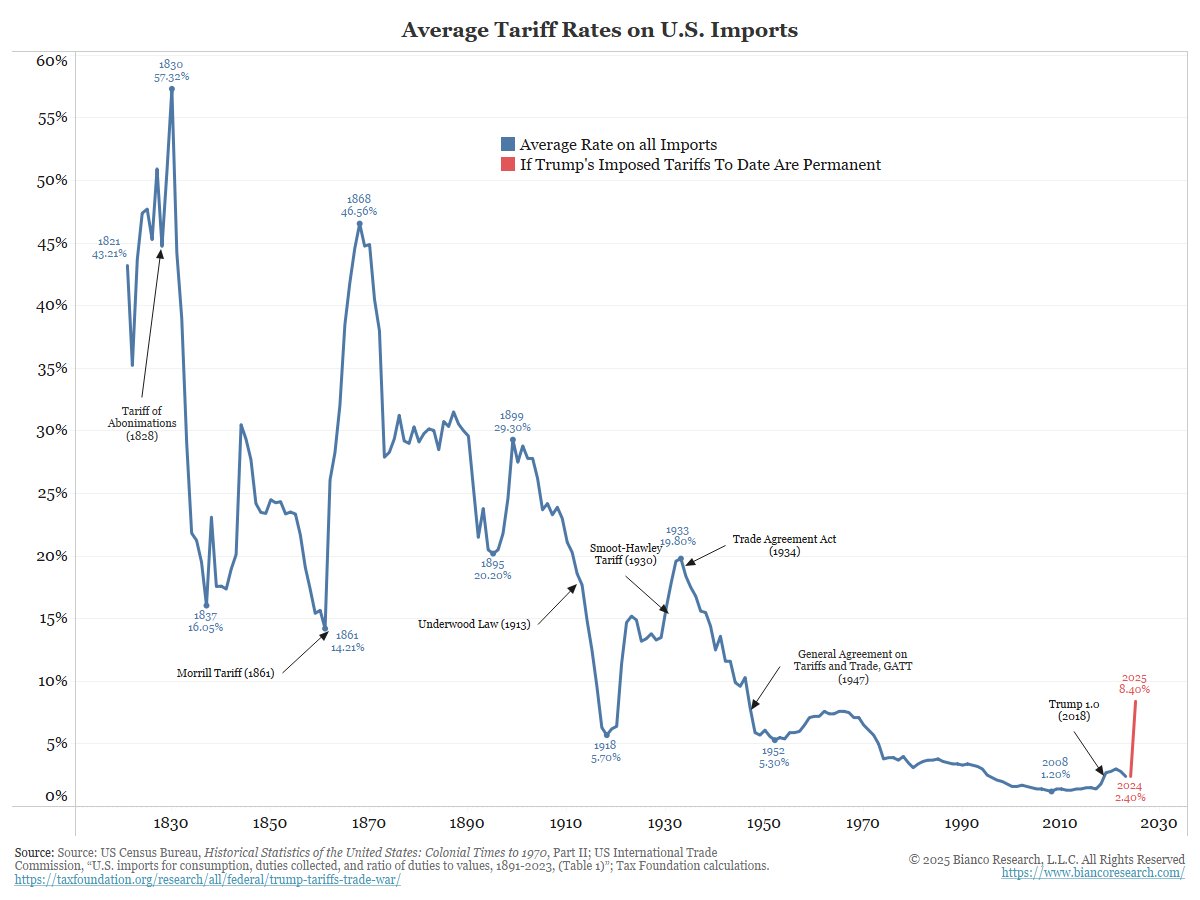
However, the United States has maintained a low-tariff regime even when our trade partners used tariffs against us. We have huge trade deficits as a result and have lost much of our domestic industrial production. Why should we import with no tariffs when our trade partners impose tariffs on our exports?
These new tariffs could change the global supply chain and be a tool to improve our national security. They could also be similar to the Smoot-Hawley tariffs that aggravated the Great Depression during the 1930s.
President Trump: "Tariffs are about making America rich again and making America great again. And it’s happening, and it will happen rather quickly,” Trump said during a prime-time address March 4th, the first such speech of his second term.
“There will be a little disturbance, but we’re OK with that,” Trump said. “It won’t be much.”
Fed Chairman Powell: "The new administration is in the process of implementing policy changes in four distinct areas: trade, immigration, fiscal policy, and regulation. It is the net effect of these changes that will matter for the economy, and for the path of monetary policy," he said March 19th. "While there have been recent developments in some of these areas, especially trade policy, uncertainty around the changes and their effects on the economic outlook is high.”
He also said he and his colleagues are "not in a hurry" to cut interest rates amid the uncertainty.
So, more tariffs, less fiscal stimulus and no interest rate cuts. This is the OPPOSITE of what stock investors want to hear.
However, this is EXACTLY what the bond market wants to hear. Policy makers want lower interest rates and this is the recipe. Congressional spending is the wild card.
Figure 9: Average tariff rates over time (Jim Bianco)
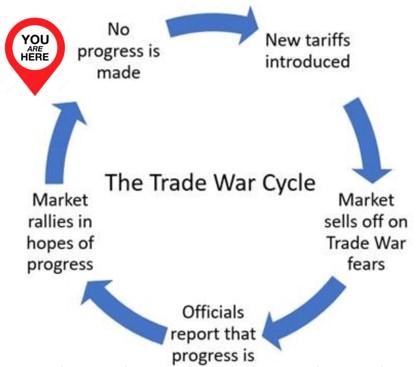
| | Figure 10: President Trump's on-again/off-again tariff strategy | | Consumer sentiment is weak | | |
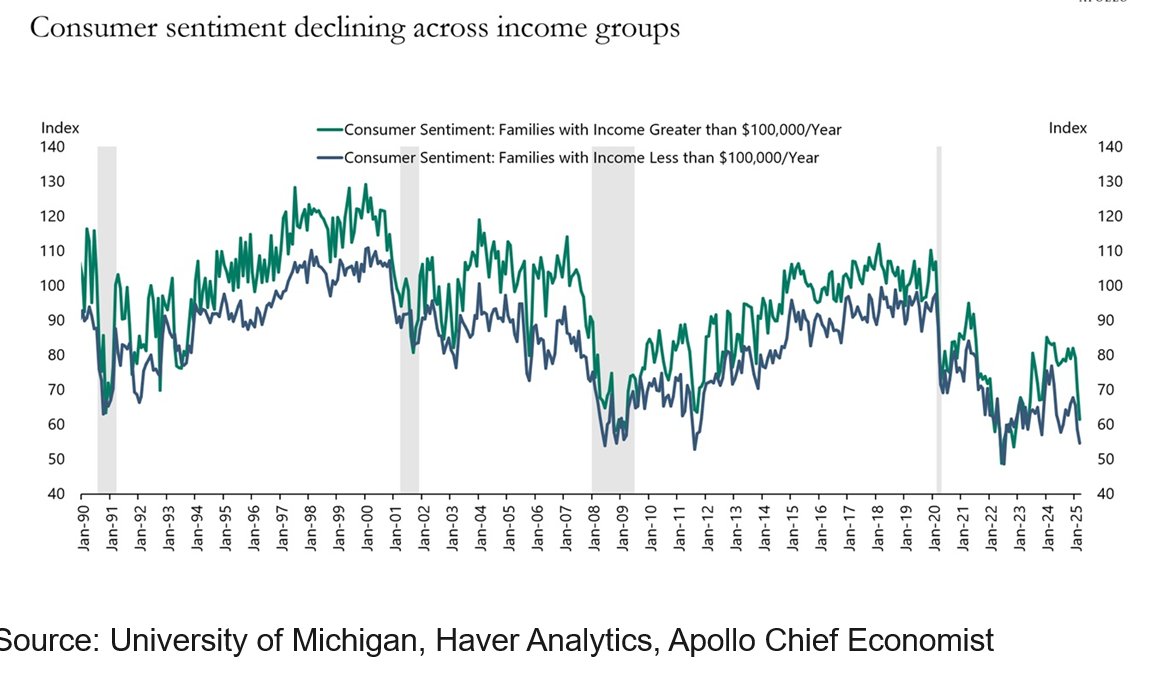
Even with strong government spending, consumer sentiment is weak. The private sector is not as healthy as the government sector in the US economy.
Figure 11: Consumer sentiment (University of Michigan, Haver Analytics)
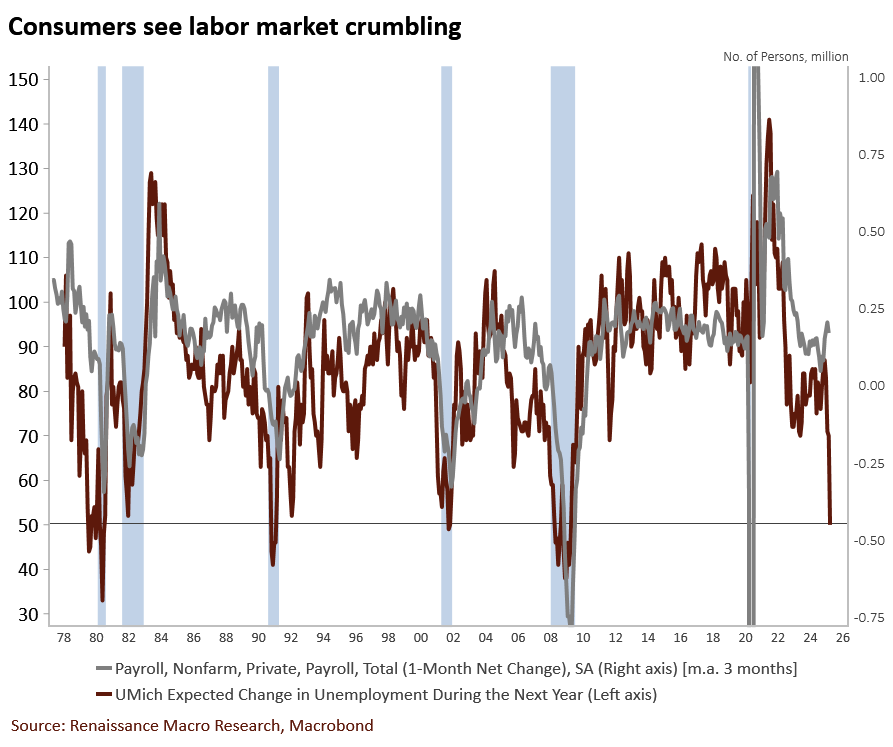
| | Figure 11: Consumer sentiment for jobs (Renaissance Macro, Macrobond) | | Tariffs are a problem for the stock market | | |
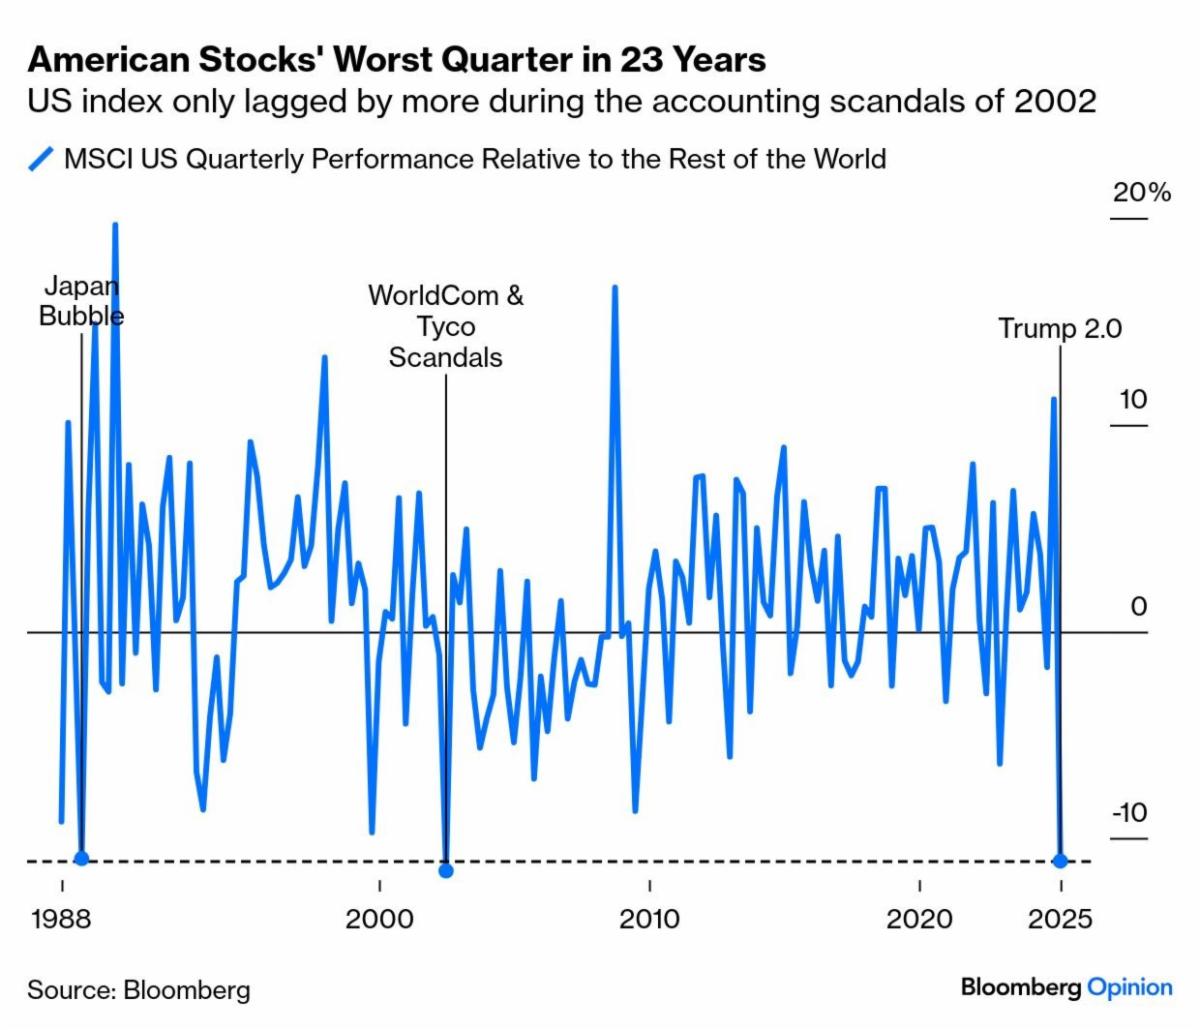
The first quarter of 2025 will go down as one of the worst performing quarters in the past 23 years. Policy uncertainty here and abroad is threatening to upend the global supply chain built up since the 1970s.
Stimulus money and recurring government programs continue to give a boost to the economy, lowering the odds of a recession.
Figure 12: Quarterly US stock performance versus non-US stocks (Bloomberg)
| | |
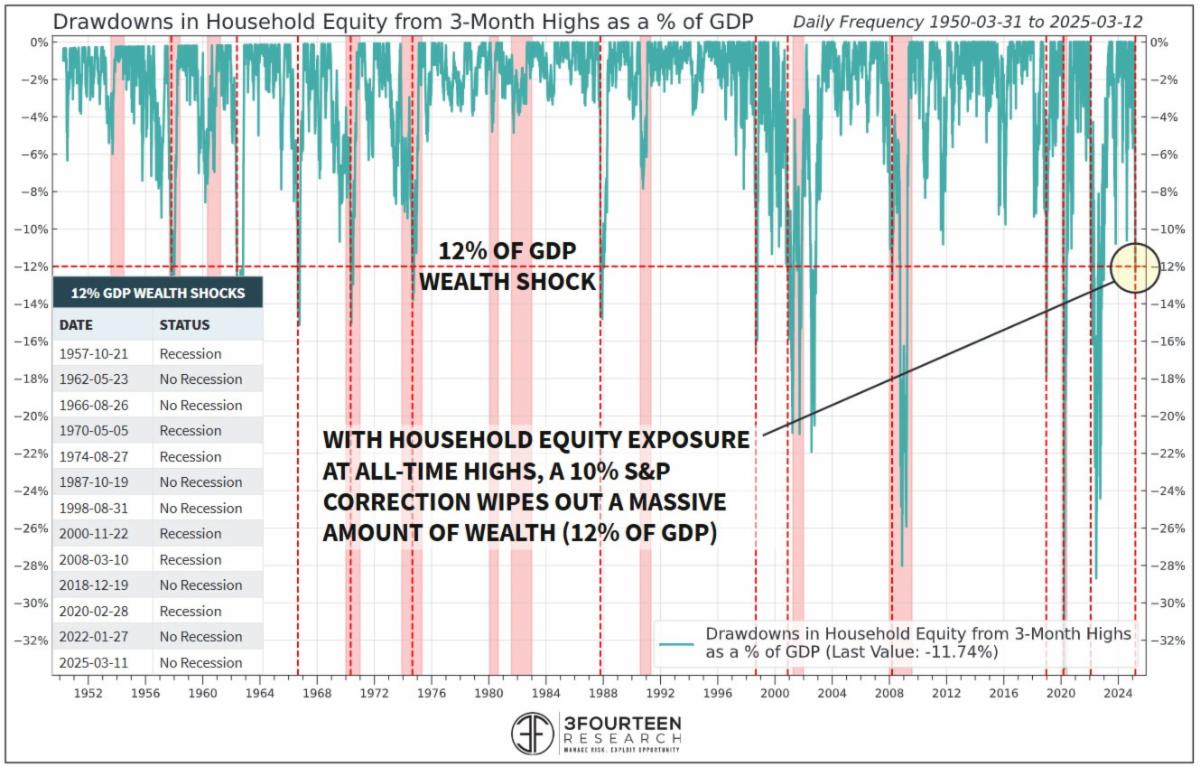
This recent pullback in the market is unusual because from a DOLLAR perspective, it is a significant proportion of GDP (Gross Domestic Product). Research shop 3Fourteen points out that pullbacks in excess of 12% of GDP create a negative "wealth shock" to the country, slowing consumer purchasing activity.
FIRST CUT: Of all 12%-of-GDP pullbacks since 1957 (excluding 2025), only 50% result in recessions. Whew!
but...
SECOND CUT: Of all 12%-of-GDP pullbacks preceded by a major Federal Reserve tightening cycle (i.e. interest rate hikes), 83% resulted in recessions (1957, 1970, 1974, 2000, 2007, and 2020).
In 2024, the Federal Reserve reversed its HIGHEST and LONGEST yield curve inversion since it was created in 1913. Now that is saying something! You don't hear any talk about this in the news anymore. The public is numb to it and many think the Fed just doesn't matter anymore.
So, maybe, just maybe, we'll see a normal recession as part of this cycle triggered by negative wealth effect, reduced government spending, and a powerful Fed interest rate cycle.
Of course, if Congress guns spending levels, all bets are off and the inflation cycle starts over again. STAY TUNED!
Figure 12: S&P 500 pullbacks as a % of GDP (3Fourteen Research)
| | |
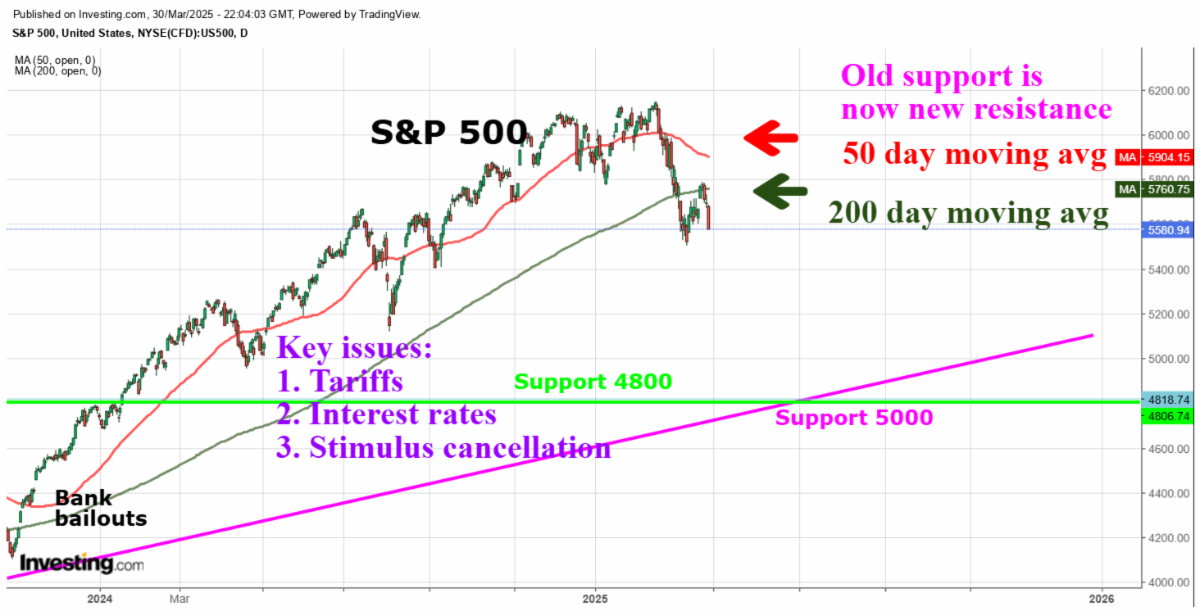
Here is what the daily stock market chart looks like. The market has broken through key moving average support with uptrend support around 5000 on the S&P 500. So far, we do not see weakness in the employment or earnings hard data, but soft data points like consumer sentiment and service PMIs are weakening.
Stocks are expensive, as mentioned before in other research notes, so when compared to money market and bond yields, stocks are unattractive on a valuation basis. The economy must grow to support high stock valuations.
President Trump seems unfazed by the market volatility which makes us think the market may chop quite a bit this year.
Figure 15: S&P 500 daily price chart (LIWM)
| | |
If you found this research report informative, would you please help us by leaving a review? The State of Texas recently changed their rules allowing us to collect testimonials from the families we serve. Online reviews are used by people to conduct due diligence and evaluate the advisers they do business with. A good review will help us grow our business. Think about the reviews you have viewed when shopping for some item and how that review influenced your decision. You may rate us anonymously or ask that your information be kept private.
Thank you in advance for your support!
Please leave us a review here!
As always, we welcome your feedback and are happy to discuss our research and how it applies to your situation.
| | |
Rob 281-402-8284
Chris 281-547-7542
| | |
Christopher Lloyd, CFP ®
Vice President and Senior Wealth Planner
Lloyds Intrepid Wealth Management
1330 Lake Robbins Dr., Suite 560
The Woodlands, TX 77380
281-547-7542
Chris.Lloyd@lloydsintrepid.com
www.lloydsintrepid.com
| Lloyds Intrepid LLC is an Investment Advisor registered with the State of Texas, where it is doing business as Lloyds Intrepid Wealth Management. All views, expressions, and opinions included in this communication are subject to change. This communication is not intended as an offer or solicitation to buy, hold or sell any financial instrument or investment advisory services. Any information provided has been obtained from sources considered reliable, but we do not guarantee the accuracy, or the completeness of, any description of securities, markets or developments mentioned. We may, from time to time, have a position in the securities mentioned and may execute transactions that may not be consistent with this communication's conclusions. Please contact us at 281.886.3039 if there is any change in your financial situation, needs, goals or objectives, or if you wish to initiate any restrictions on the management of the account or modify existing restrictions. Additionally, we recommend you compare any account reports from Lloyds Intrepid LLC with the account statements from your Custodian. Please notify us if you do not receive statements from your Custodian on at least a quarterly basis. Our current disclosure brochure, Form ADV Part 2, is available for your review upon request, and on our website, www.LloydsIntrepid.com. This disclosure brochure, or a summary of material changes made, is also provided to our clients on an annual basis. | | | | |