Greetings,
Geography is a big topic, and we have big plans to keep growing, experimenting, teaching, and learning. I can't wait to tell you more about what we're up to. And, as always, if you have an idea for us, please get in touch. |
|
Garrett Dash Nelson
Curator of Maps & Director of Geographic Scholarship
|
|
Are you sure you know Boston’s shore? |
|
Last week, WBUR featured a thought-provoking series about Boston’s shoreline and the challenges that lie ahead as sea levels rise. The series included an article from the Leventhal Center exploring Boston’s changing shoreline using eight maps from our collections. As we write in the article, you can't hope to plan for the future without understanding just how dramatically Boston's relationship to the ocean has changed in the past.
Do you know where the tombolo is on the outline of eighteenth century Boston? Read the article for the answer—and to discover how Boston’s shoreline has been constantly redrawn for hundreds of years.
|
|
Students reframe their worlds as Maptivists |
|
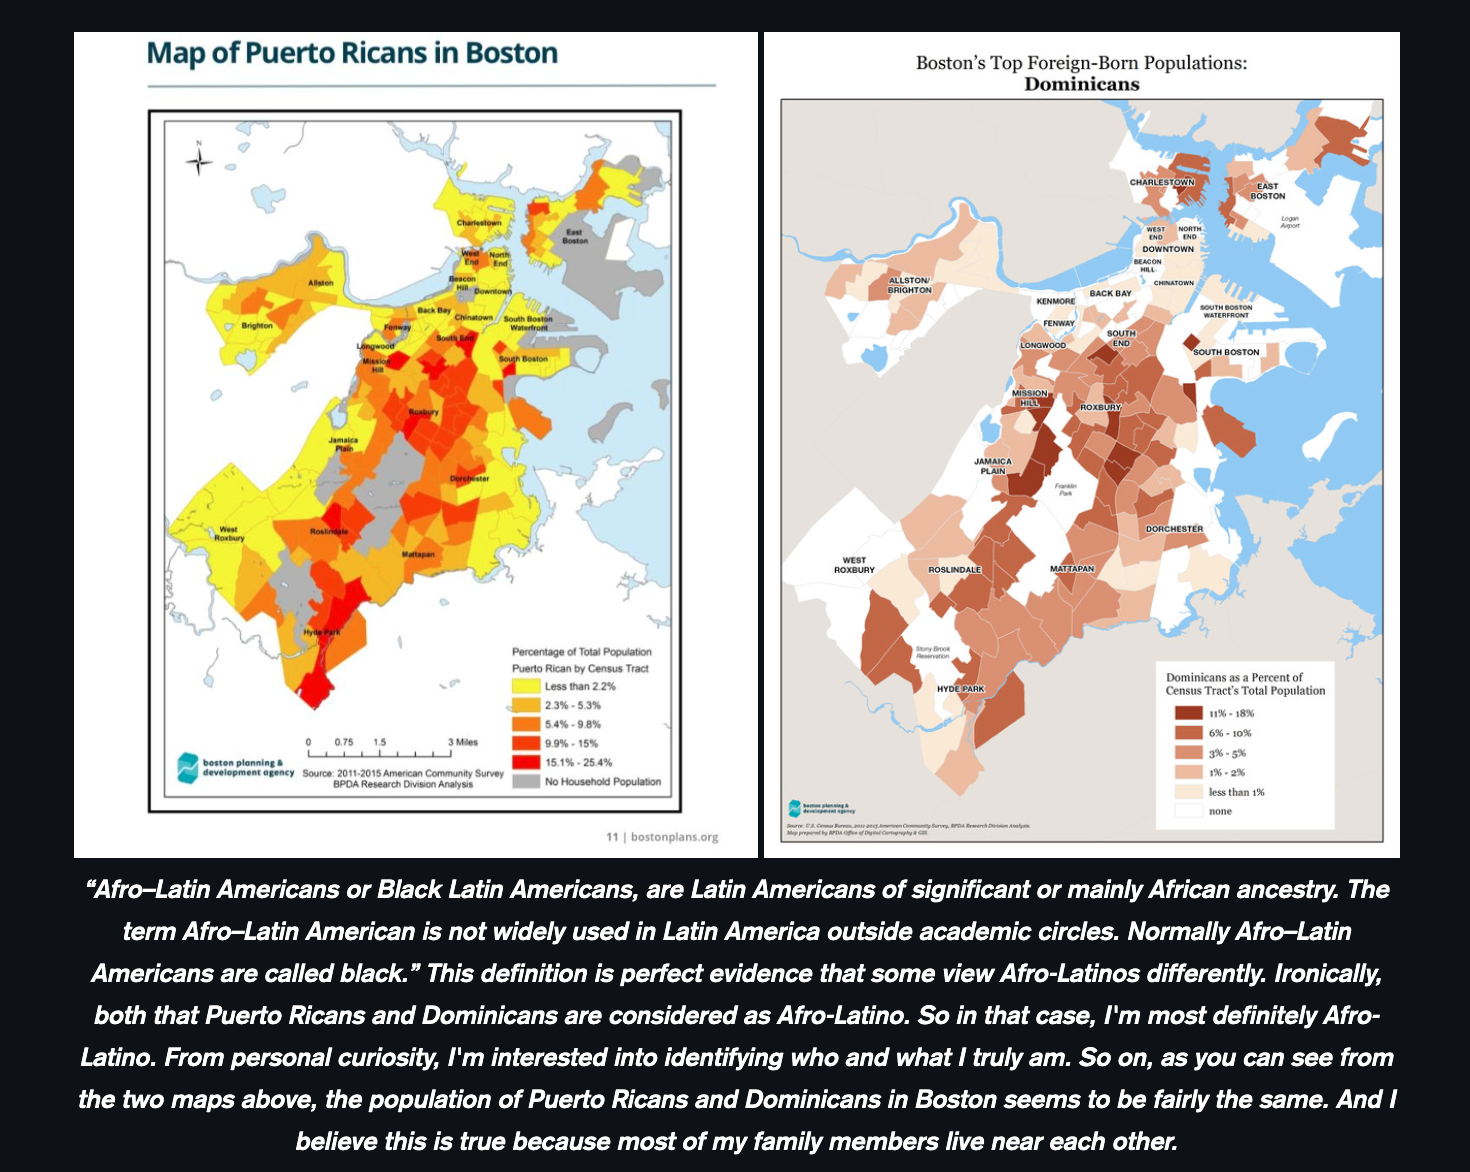
Two new features highlight the Center's groundbreaking work with K-12 students. Our Education Manager Lynn Brown writes about the projects created in the Maptivist elective, with students investigating the question of how racial ideas become spatial practice in Boston. Read more and learn about how one student began looking at Afro-Latinx identity on maps of Boston.
Next year, we'll be deepening our collaboration with the Data + Feminism Lab at MIT through a grant led by Eric Huntley designed to build interactive web tools for teaching critical data studies at the pK-12 level. Learn more about this project, supported by the Abdul Lateef Jameel World Education Lab. |
|
Documenting demolished Boston with Atlascope |
|
When Professor Amy Finstein brought her College of the Holy Cross undergraduate students in the "Making the Modern City" course to the Map Center for a virtual visit this winter, the wealth of materials suggested the possibility of an interactive class project. Working with our Atlascope tool, Finstein's students developed a digital humanities site that explores the buildings and communities that were displaced by the construction of the Central Artery through the heart of Boston in the 1950s.
|
|
Two staff vacancies open now
|
|
|
|
Our staff is growing. Maybe you or someone you know would like to grow along with us? Apply by June 28 for full consideration.
|
|
Looking again at Revolutionary maps |
|
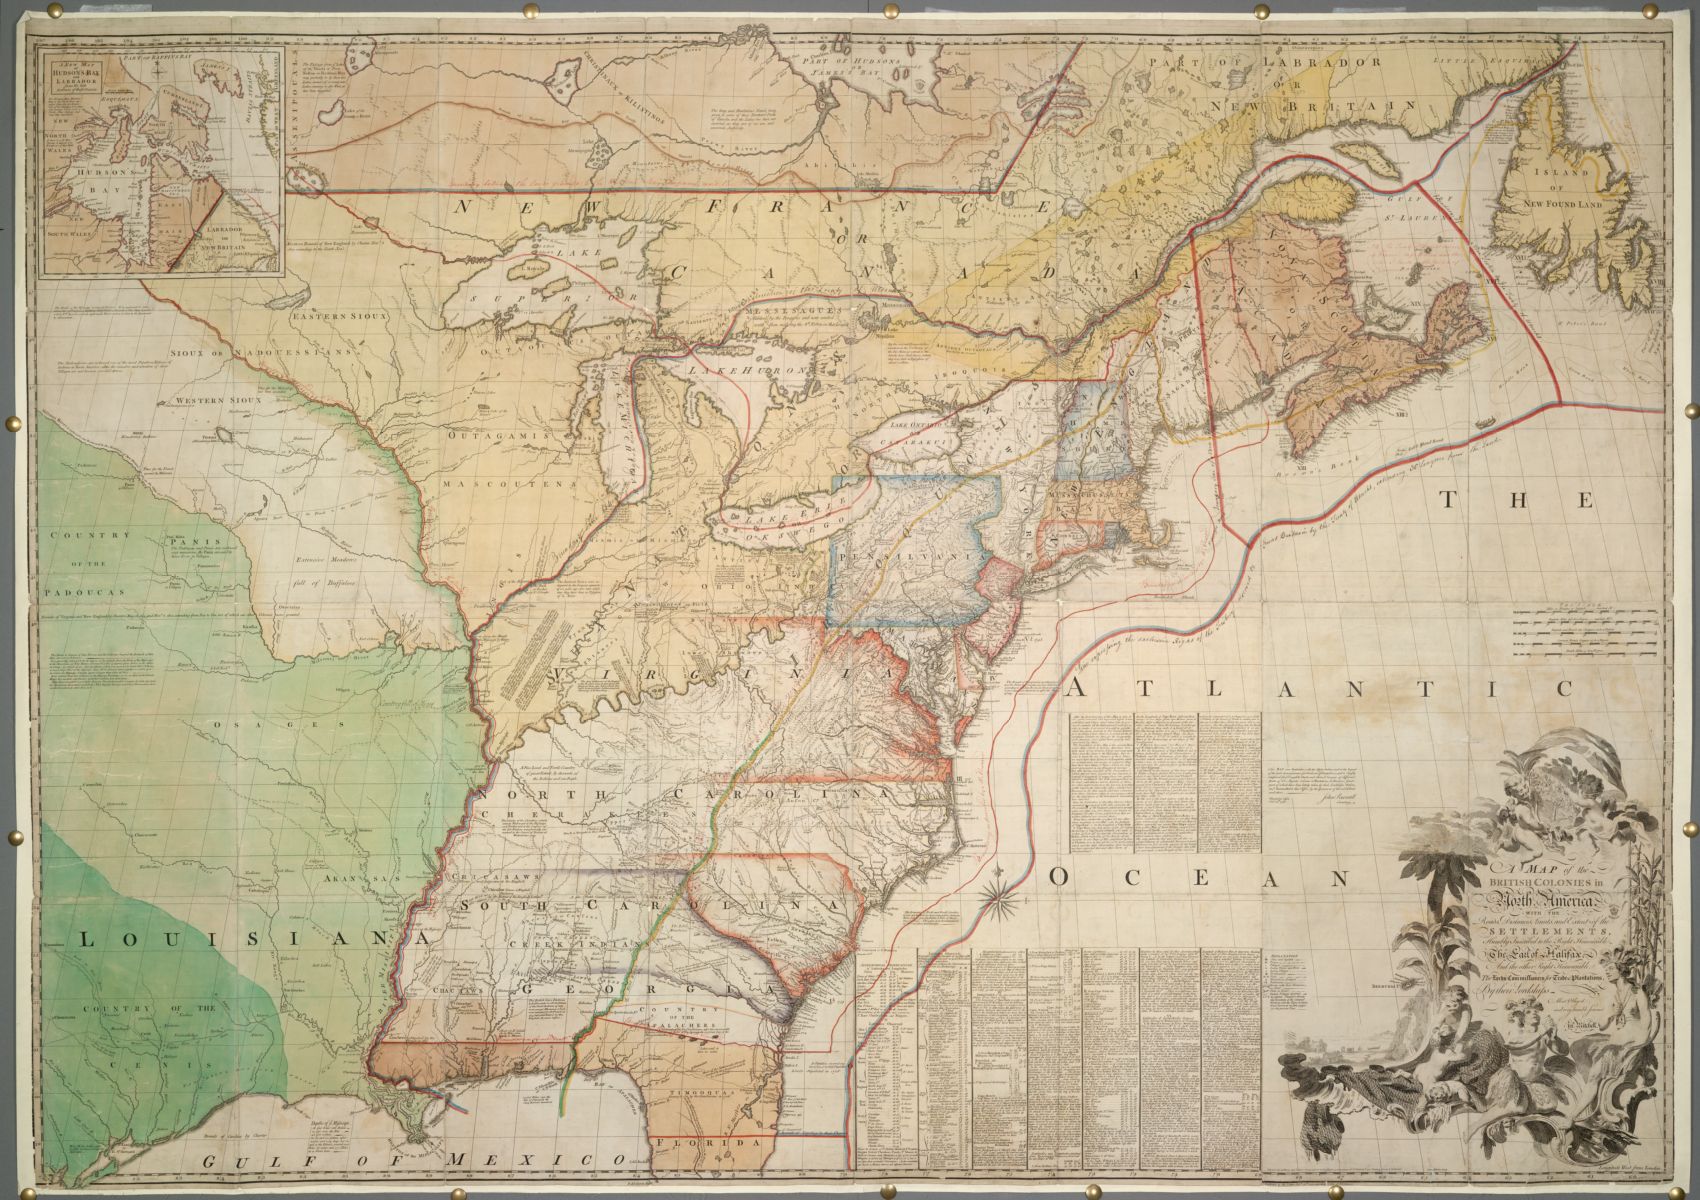
We're also excited to announce the first Richard H. Brown Seminar on the Historical Geography of the American Revolutionary Era with a free virtual talk by Prof. Michele Navakas on August 4, 2021. Navakas explores the “liquid landscapes” of places like Florida in the eighteenth century, helping us reframe our understanding of the American Revolutionary period through cartography and landscape history. She examines a rich archive of historical documents that show how diverse groups of people met, struggled, and mixed in regions where boundaries themselves were hard to define. |
|
Events, programs, and geographical provocations from our friends |
|
|
|
The Osher Map Library at the University of Southern Maine is hosting an exhibition about travel in the age of Covid-19 at their gallery in Portland. It runs May 13 to October 15.
|
|
On Wednesday, June 23 at 6pm, join Christina Viviana Groeger for a virtual event at the Boston Public Library discussing her new book The Education Trap.
|
|
|
Didn't have time to tune in? |
|
All of our recent past programs have been recorded and are available online. For instance, did you know ...
- Modern day ideas about figuring out where crime is likely to occur have their precedent in sociological models of early twentieth century Chicago? Watch Brian Jefferson on this topic.
|
|
Bring your friends into the picture!
Our newsletter contains more than just maps—it's a great roundup on geography, urbanism, environment, visual culture, design, and so many more topics. You can forward this email on to your friends, and encourage them to sign up to get it in their own mailboxes. |
|
Don Bloodgood, Ask Shell! (Shell Touring Service, ca. 1948–1955).
|
|
Help keep our events free, welcoming, and open to all. |
|
The Leventhal Map & Education Center is a leader in exploring the study of places, societies, and history through the lens of maps and geography.
We offer exhibitions and public talks, groundbreaking programs promoting geographic and data literacy, a website with 10,000+ digitized maps, and a physical collection of 200,000+ maps and 5,000 atlases.
The Center is an independent non-profit organization dependent on private support from map enthusiasts like you.
We are grateful to our major funders.
|
|
|
Atlascope is a trademark of the Leventhal Map & Education Center.
|
|
|
|
|
|
|