As winter transitions to spring, we are enjoying the reports of animal and plant activity coming in from observers across the country. Here in the Southwest, we are enjoying an abundance of desert wildflowers! I am also particularly excited about the release of our new Pheno Forecast maps on 12 species of invasive and native insect pests, and the Pest Patrol campaign that will allow us to validate and improve these models.
The USA-NPN is committed to continue to deliver these valuable forecast products for decision making, and needs your help! If you are a researcher with interest in ecological forecasting and phenological models, please reach out and we can work together to identify mutual interests and community needs.
Lastly, don't forget to keep a close eye on the status of spring, to see if spring this year is arriving early or late for your region!
|
|
What's new at the USA National Phenology Network
|
|

Status of Spring page wins award
Our
Status of Spring
webpage has won the US Geological Survey's 2018 Shoemaker Award for Communications Product Excellence in the Webpage/Website category! This powerful tool provides a clear and engaging way to track the progression of spring across the country.
Read more »
|

New Pheno Forecasts available
We have recently released a new suite of
Pheno Forecast maps for a total of 12 species of native and invasive insect pests. You may notice that these maps have a new look with a focus on the life stages rather than treatment windows, and allow for growing degree day models that have varying start dates and base temperatures.
|
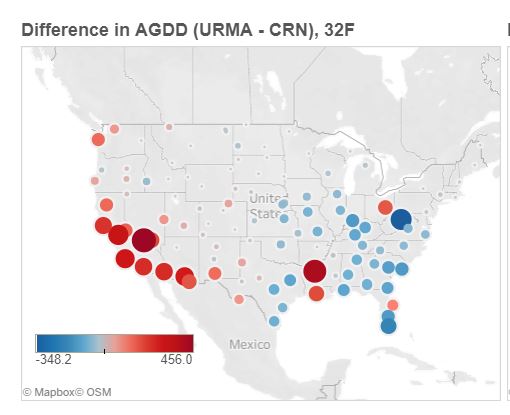
Data quality dashboards
Did you know you can explore the spatial and temporal reliability and plausibility of our gridded AGDD products and Spring Index maps?
We compare our URMA/RTMA-based calculations of Accumulated Growing Degree Days to those made using measurements from U.S. Climate Reference Network stations.
We also
compare
the predicted Spring Index submodel leaf and bloom dates with observational data from
Nature's Notebook
.
|
|

- Ecological Forecasting Initiative, Washington DC, May 13-15, 2019.
- Botanical Society of America, Tucson, AZ. July 27-31, 2019.
- Ecological Society of America, Louisville, KY. August 11-16, 2019.
- American Geophysical Union. San Francisco, CA. December 9-13, 2019. Session proposals due April 17th. Please let us know if you are planning on submitting a phenology session and are looking for collaborators!
|
USA-NPN and LTER phenology model comparison
Taylor and colleagues recently published an article in
Ecology demonstrating the value in using large-scale citizen science datasets in generating phenological models.
|
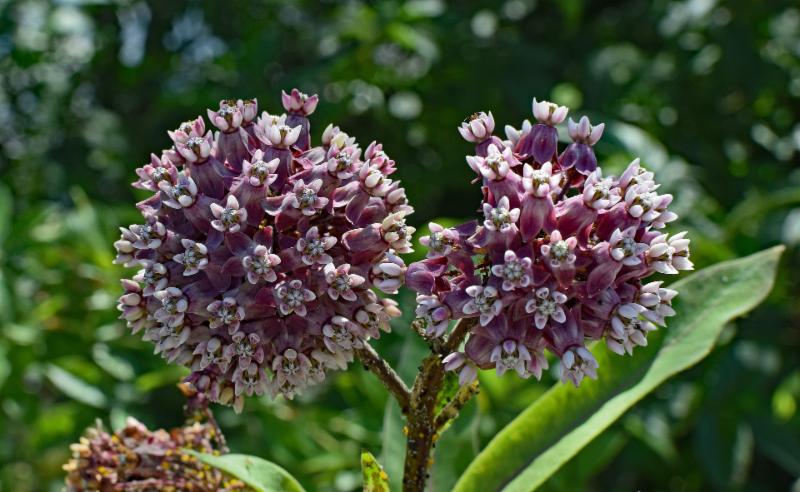
Milkweed flowering and climate change
A study published in
Nature Scientific Reports by Aaron Howard found that flowering in the common milkweed,
Asclepias syriaca, was associated with warmer temperatures and that the onset of flowering has been occurring earlier in recent years. This shift could have implications for synchrony between this important host species and Monarch butterflies.
|
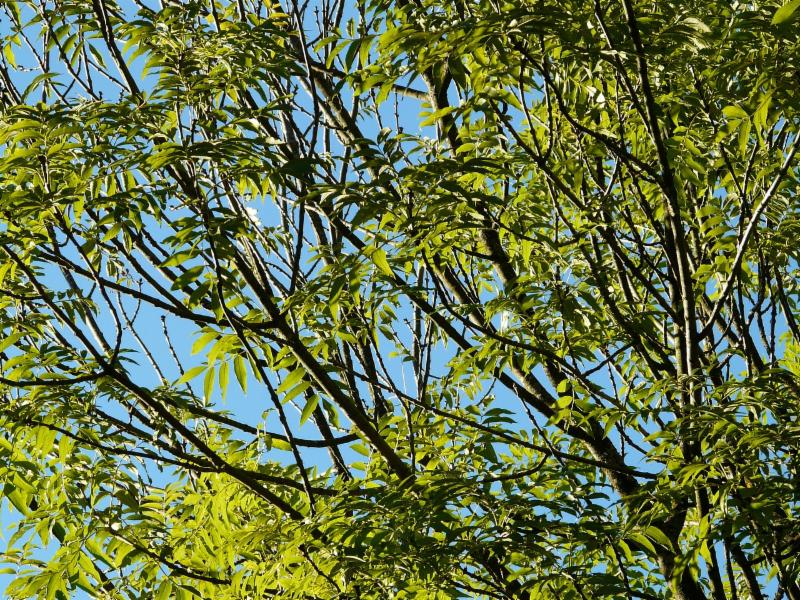
Spatial models of spring phenology
Liang Liang constructed a spatially explicit model of spring phenology in the white ash tree (
Fraxinus americana) as described in
Agricultural and Forest Meteorology. This study examined adaptive patterns of genotypic variation of this wide spread species from common garden experiments, and compared to the observed latitudinal patterns found in the USA-NPN dataset. Incorporating adaptive variation into models was found to improve predictions and
reduce geographic biases.
|
|
|
|
|


