Key Genes on Chromosome 18
We believe that knowing the role that each of the chromosome 18 genes play in human health and development is a first step in devising specific gene-based treatments. But which genes are the cause of which difficulties for someone with a chromosome 18 change? Luckily, over the past years, we have made great strides in answering this question. Although there are 263 genes on chromosome 18, only about 10% of those genes are the source of the problems. Still, organizing and illustrating this enormous amount of information is a challenge. However, enormity does not equate to impossibility. It just means we must devise new ways to talk about, sort through and illustrate the mountain of information.
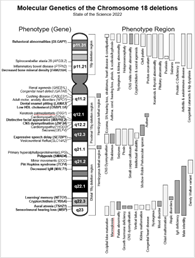
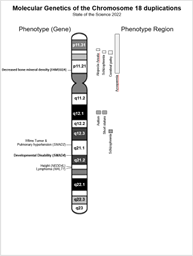
Because the chromosome 18 conditions are often depicted using a picture of the chromosome, we have created a pictorial-based method to illustrate and access the information about these key genes. This new Clinical Dosage Map depicts only those chromosome 18 genes believed to have some effect (aka phenotype) when they are present in one copy, or three copies or four copies, or any abnormal number of copies. We call this abnormal number of gene copies “abnormal gene dosage” because the “dose” of the gene is something other than the normal of two. Therefore, we call these maps “Clinical Dosage Maps” and they are labeled based on the phenotypes.
Although we have had Gene Dosage Maps for several years, these additional new maps are different for several of reasons. First, there are two of them; one for deletions and one for duplications. Second, these maps only include information about the dosage-sensitive genes that therefore have an abnormal outcome (phenotype) which is why we call these the “Clinical Dosage Maps”. Genes on which we have data indicating they have no effect when present in an abnormal dosage are excluded. This eliminates a lot of unnecessary detail. Third, in addition to the genes, these maps also demark the small regions of the chromosome associated with the specific phenotypes for which the exact gene cause has not yet been determined. These are called phenotype regions. Fourth, these maps include information on penetrance. Penetrance is the likelihood that a gene’s deletion or duplication will result in a phenotype. Some phenotypes occur in more than 50% of the people with a deletion of the associated gene or chromosome region and some occur in less than 50% of individuals. A deletion or duplication of a key gene or phenotype region is not an absolute predictor of the outcome, which is why we include information about penetrance.
The Clinical Dosage Map is a pictorial and a global map view of the entire chromosome. Unfortunately, this makes it difficult to determine whether a gene or a phenotype region is within your region of interest. However, because these are web-based maps, if you click on any of the items in the map it will take you to a details page which will give the molecular coordinates of the gene or phenotype and the description about what is known along with the scientific citations for that information.
This will all make more sense after viewing one of the maps.
The Clinical Dosage Deletion Map can be found at:
The Clinical Dosage Duplication Map can be found at:
information updated as often as weekly as needed.