Coronavirus Tracker Update 5/23/20
|
|
THE MODEL-FREE EDITION.
HAPPY MEMORIAL DAY!
Who remembers this?
|
|
|
IF YOU ARE RESPONSIBLE FOR AN OFFICE YOU SHOULD READ THIS.
How Will We Ever Be Safe Inside Again Yes, the headline is panicky. The article is much better and has some great diagrams of airflows and infections. I expect to see office modification suggestions/requirements based on something like this. It's also a great example about how big public health changes end up being justified from a few as 1-2 cases.
|
|
|
LOOK AT THOSE CASES! HOW CAN TEXAS BE OPENING?!?. I'm sure you've seen a variation of this chart along with another scary story admonishing Texas for opening with cases increasing, or about a
single day record increase in cases. This one at least manages to mention there's a meatpacking plant north of Amarillo. The meatpacking plant in question is responsible
for over 700 of those 1,800 cases. Those 700 cases are significant; but having that many cases in a remote county (600+ miles from Houston, 330 miles from Dallas) is very different than if that spike occurred within one of the state's major cities. Outbreaks at meat plants have been a problem, but what's overlooked is this: a pork plant in Missouri tested 1,500 workers and nearly 400 were positive -
and every single one was asymptomatic.
There's some evidence (I haven't verified this, but it's the company's facebook page) that New Fashion Pork tested 2,300 workers at a plant in Minnesota and
90% were asymptomatic. And the
City of Amarillo at least seems to think these are largely asymptomatic tests in the meatpacking plants up there.
|
|
|
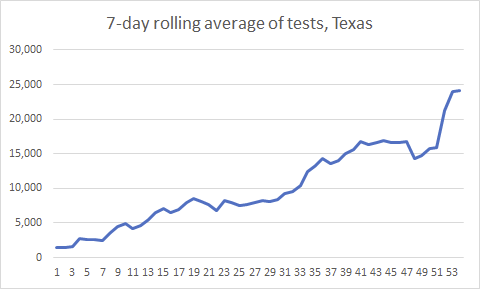
PART OF IT IS THE TESTING. It's also a function of testing which has increased dramatically. I was fairly critical of Governor Abbot on his extended delays on developing a re-opening plan; and I still strongly believe that was a mistake that did needless economic damage to the state. But I will commend his resolve on moving forward to opening in spite of the increased cases from Moore County, and from the increase in testing.
|
|
|
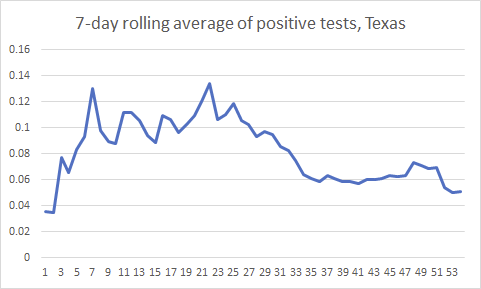
POSITIVE RATE SHOWS CASES ARE PROBABLY ACTUALLY DECLINING. If you have a fairly widespread infection and your current testing isn't catching the full extent, you will see tests jump as you catch up. But looking at the rate of people testing positive suggests that infections are likely to decline. There was some controversy over
the state combining swab and antibody test results; it affected about 6% of all reported test and when the DSHS started separating them again, it brought testing down by about 0.5 percentage points. This question is apparently only relevant to proving the state's
ability to test for reopening - it does not change anything about the results of those tests.
|
|
|
- SALES NOT CATCHING UP YET: It looked last week like we might be seeing some normalization in weekly sales but that didn't happen. I'm not sure if there were data changes or not, but the gap ended up wider than originally thought. The first chart shows new home sales by month from the HAR MLS for 2019 and 2020. The grey line shows the annual change based on cumulative totals. We are still ahead on a YOY basis but that is changing rapidly. The second and third chart shows sales and sales changes by ISO week. I'd like to believe this week we'll see sales at the same level as last year given how close we are and because week 21 this year is not complete, but that's the same thing I thought last week so I won't. Here's an ISO week calendar if you need a reference.
|
|
|
DO BUYERS THINK IT'S SAFE TO GO BACK IN THE WATER? Last week we had the chart of record searches on Google for "new homes" in Houston. This week Redfin reports on its homebuyer demand index. It's national, it covers more existing than new homes, but it's also positive - it's recovered and at its highest level since January 2017.
Here's a full description of what Redfin is seeing from its buyers. One of the trends noted in the article is a bottom in existing home listings; i
n April Houston saw a 28% drop in new listings for existing homes, according the MLS. That averaged out to about 300 listings per day. Thus far in May we've seen about 400 listings per day, and that increase is likely larger than what we would see from a season adjustment, suggesting a possible bottom in new listings here as well.
|
|
|
- GO OUT BUT NOT TOO FAR: The map below show how sales have changed in the first +/- 5 months of this year. I've only shown a map and not tables because of the limitations of the data - it only includes co-op sales which is fine for a general market trend but could really miss in a small geographic area. Therefore this map should only be interpreted for general market directions and trends rather than seek or avoiding a specific zip code.
- Almost all of the increases in sales are in far (but not too far) suburban zip codes. Lake Jackson and Cleveland seem to be the most remote areas seeing sales increases, while Brookshire, Montgomery, Rosenberg and League City are seeing declines. Most of the increase in new sales in the interior are in lower cost inner city locations. Keep in mind in these areas sales would include single locations that might not be considered as "production" housing by competitive firms. I've included the top 10 increase/decrease zip codes so you can see the amount of changes -- even for decliners it is very small. I think this is a reflection of overall affordability, not anything specific to the pandemic. Again, these are new home sales recorded in the HAR MLS for Jan 1 - May 22 2019 and 2020.
|
|
|
TO MASK OR NOT TO MASK, THAT IS THE QUESTION. Back on April 5 I suggested people should wear masks. That was based on this
meta analysis of 51 different studies conducted in 2008. The PPE studies were conducted in hospital settings with people including SARS patients and found that masks were more effective (68%) vs (55%) at reducing the spread of respiratory viruses. Note that SARS was a coronavirus. Table is below.
|
|
|
A few of you sent me
this article this week claiming to show that wearing a mask is dangerous and could cause further damage from COVID-19. I can find
no evidence to support this, at least not from anywhere credible. The links in his article do not point to the studies he references. You may also have seen this study that said mask wearing reduces spread of the virus by 75%.
This study was conducted on hamsters. One of the main benefits claimed for wearing masks is to protect healthy people if you are infected. Yet
this study, published in the
Annals of Internal Medicine in April, shows that neither surgical masks nor cloth masks stopped the coronavirus from penetrating to the outside of the mask when exhaled by the wearer. Even this study says this is not necessarily evidence the mask is not helpful. So the evidence suggests it's probably helpful but not definitive. I still wear it when I'm out to go a store, etc, but I wouldn't to a meeting. It seems to me you should not feel bad about it if you decide either way.
Although the public health recommendations are always presented with certainty, every time I have looked at the research behind them it looks like this. The social distancing policy came out of
a high school science project. How about the 6' limit? The old requirement (and actually still the WHO recommendation) is three feet, based on
a tuberculosis study from 1934. The six foot distance comes from
a 2003 study of one flight out of Hong Kong where 8 people within three rows of someone known to have SARS came down with the illness. That's it.
I started researching these measures to understand the optimal mix of social distancing measures and how long they would need to be employed to forecast how they would affect the economy and housing markets.
We don't have research that shows any of that.
Instead we have hamsters and science fairs and whether you're in boarding group A1-30 or not. That's not to say none of this works; but it is very surprising to me the paucity of research behind all the pandemic response measures. New knowledge can come from anywhere; I just expected those fortuitous discoveries to be followed up with clinical research before being implemented on 330 million people. Instead I'm beginning to feel like we are the hamsters.
|
|
|
QUESTION #2: HEALTH CARE RECOVERY. Two weeks ago I posed five questions and last week I punted on health care. No area deserves the "we had destroy the village to save it" comment than health care, where I've documented before how actions intended to spare health care capacity have ended up bankrupted hospitals all over the country. In Texas, health care workers seem to be getting back to work - if the number of calls I'm getting from my dentist are any indication.
We don't have data on who would be getting hired back, but health care job losses in Texas the week of May 9 were only 8,000 - compared to almost 40,000 in weeks in early April. The second chart shows peak-to-now change in job losses by industry. Public Administration is at 87% of peak in the most recent week - government job losses are only getting started. But restaurants, hotels and health care workers have hit the lowest now-to-peak ratio, around 20-25%. It could be that they've laid off everyone already and nobody's left; or it could be that losses in those industries have bottomed out. We know the head of a major TMC institution told staff this week "this hospital system will be fully operational by July 1." Hopefully that's a good indication.
THE WITCHING HOUR IS JULY 31. Whatever happens in healthcare, the next big date for employment is July 31- this is when the extra Federal unemployment benefit of $600/week runs out. This payment has led to some unknown percentage of workers receiving more in benefits than while working. Right now I am expecting a considerable amount of uncertainty to persist through July, with a sharp and sudden resolution of the employment picture in August.
|
|
|
Texas is still at the lower end of the range for unemployment rates, despite the double hit from the pandemic and oil:
|
|
|
Don't get me wrong; the economy is bad and still has a long way to go, but Vistage reports nearly 60% of CEOs say their workforce has remained the same
or increased during the pandemic. That's a long way from being the end of the world.
|
|
|
DASHBOARD UPDATE. The Southeast Texas Regional Advisory Council (SETRAC) dashboard is below. Here I've zoomed out to show March 19 - May 20. The only apparent change in patients is a "spike" that occurred on April 2 when SETRAC changed how it classified patients. Otherwise the COVID caseload appears to have remained very stable.
|
|
|
Some viewpoints worth reading:
|
|
|
Are you looking at new deals? Want to understand what's going on in the market today? We're here to help, even if it's just a short conversation.
I hope you and your family have a safe and great Memorial Day weekend.
Stay well.
|
|
|
HAVE A QUESTION OR TOPIC YOU'D LIKE CONSIDERED? CLICK THE BUTTON BELOW TO SEND IT TO ME.
|
|
Sincerely,
Scott Davis
Location Strategy, LLC
832.304.3478
|
|
|
|
|
|
|