|
MARKET PERSPECTIVE
TECHNICAL ANALYSIS
| | |
"DRILL BABY DRILL!" LEADING MARKETS
THE TELL: THE OIL/GOLD/DOLLAR CORRELATIONS
| | | |  | |
CLICK TO ENLARGE
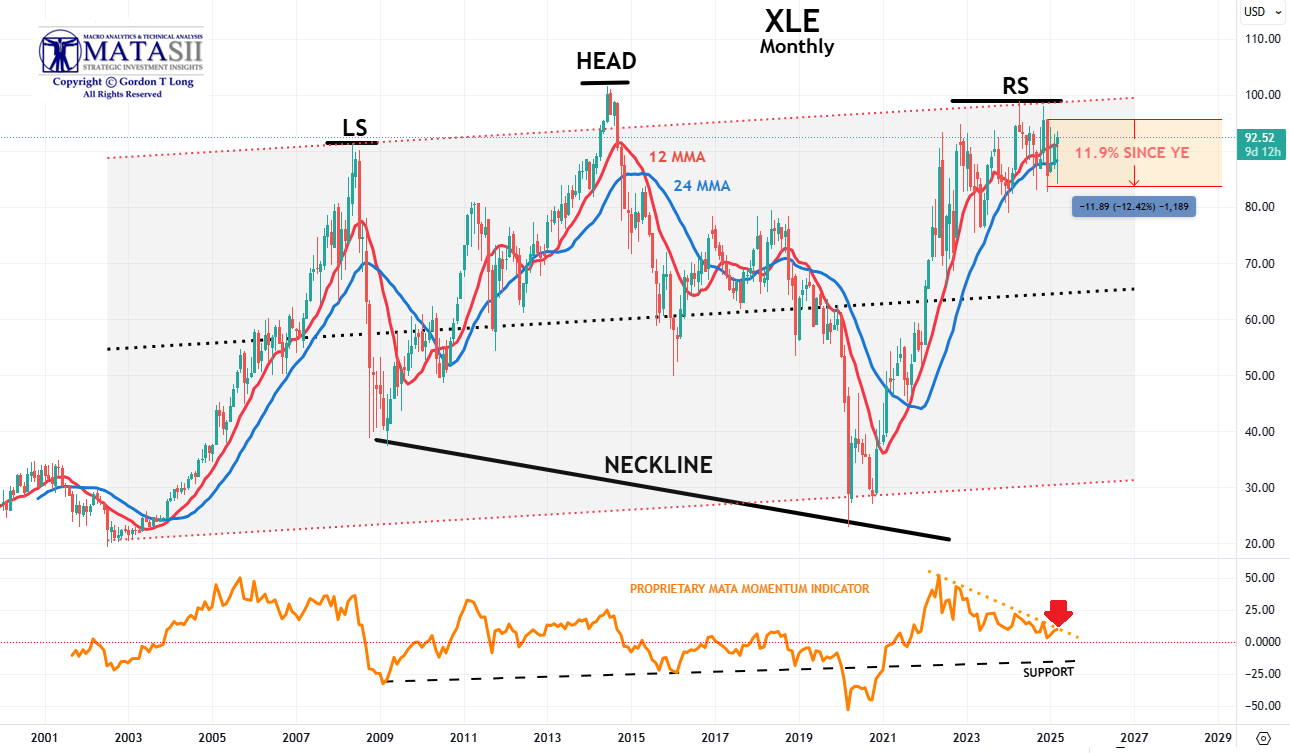
Percentage drops align with the global crude price, S&P & dollar weakness since Q4 '25:
Oil Down: -11.9% (Crude Leading)
S&P Down:-8.7% (Mag-7: -22.4%)
Dollar Down: -7.1
| | | |
THE CROSS MARKET CONTROLLING ELLIOTT WAVE COUNT IS A "WXY" CORRECTIVE PATTERN
EXPECT A COUNTER RALLY BEFORE MAJOR WAVE "Y" DOWN BEGINS
| | |
TECHNICAL ANALYSIS
THIS WEEKS INDEX (See Prior Weeks Subscriber Links to Real Time Live "Grey" areas below)
| | |
1 - US EQUITY MARKETS
CONTROL PACKAGE
S&P 500 (MULTIPLE DEGREES)
RUSSELL 2000 (IWM)
DJIA
MATASII BANKING INDEX
MATASII FINANCIALS INDEX
MAGNIFICENT 7
CONTROL PACKAGE
NVDA
GOOG
META
AAPL
TSLA
MSFT
AMZN
FOREIGN EXCHANGES
DAX
CHINA TECH
| | | |
GLOBAL
2 - COMMODITIES
CRB COMMODITY INDEX
GOLD
SILVER
3 - CURRENCY MARKET
DXY
BITCOIN
4 - BOND MARKET
CONTROL PACKAGE
TNX
5 - CREDIT MARKET
YIELD CURVE
JNK (HY)
MARKET MONITOR (SUBSCRIBERS ONLY)
| | | |
REMEMBER: SIMPLY CLICK YOUR LIVE SUBSCRIBER LINK TO SEE THE LATEST UPDATED LIVE CHART.
ALL ARCHIVAL SUBSCRIBER NEWSLETTERS COVERING "GREY" AREAS CAN BE FOUND HERE: GTL SUBSCRIBERS
NEW IMAGE CHANGES ARE LABELED WITH A BLUE TRIPLE ***STAR***
OLD IMAGE CHANGES ARE LABELED WITH A RED TRIPLE ***STAR***
OLD IMAGES REFLECT MINIMAL CHANGE, but Narrative is ALWAYS updated.
| | NEED TO WATCH - HEADS-UP! | | |
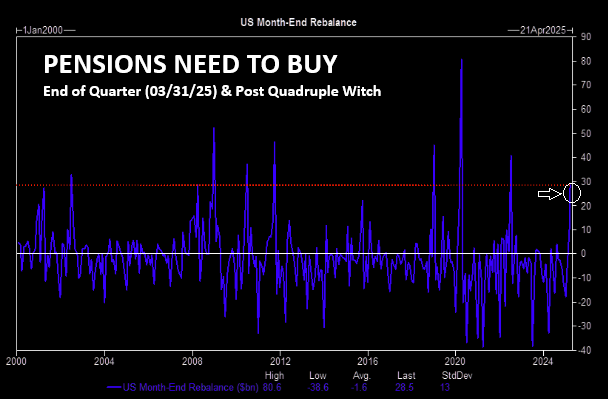
NEW-- FLOWS - PENSIONS - END OF QUARTER
03-21-25
"$29bn to buy ranks in the 89th percentile amongst all buy and sell estimates in absolute dollar value over the past three years and in the 91st percentile going back to Jan 2000."
| | |
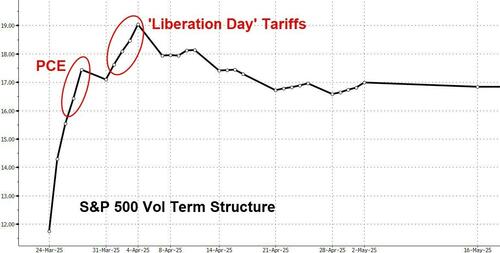
NEW-- vol ADJUSTING UPWARD - 03-21-25
"Vol markets are pricing in a notable blip for PCE and April 2nd tariffs"
"Put vols dropping significantly relative to Call vols (suggesting perhaps that the big hedges are being unwound)
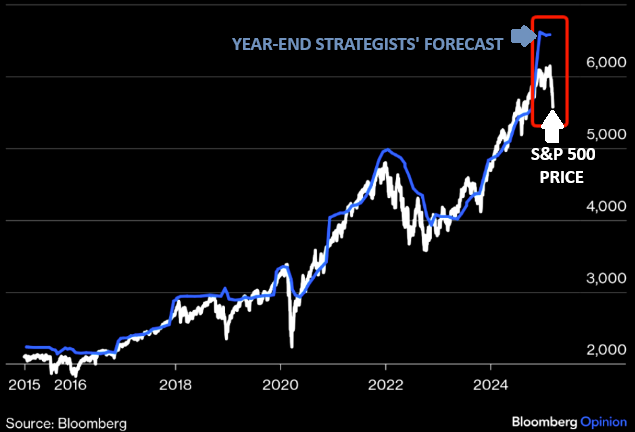
| | | The gap between strategists' SPX target and SPX is very wide. Market too bearish, or strategists too bullish? Maybe the gap shrinks, from both "sides"... | | | |
CONTROL PACKAGE
There are FOUR charts we have outlined in prior chart packages that we will continue to watch closely as a CURRENT "control set":
- The S&P 500 (CHART LINK)
- The DJIA (CHART LINK)
- The Russell 2000 through the IWM ETF (CHART LINK)
- The MAGNIFICENT SEVEN (CHART ABOVE WITH MATASII CROSS - LINK)
- Nvidia (NVDA) (CHART LINK)
| | | | | |
IT WAS ANOTHER TUMULTUOUS WEEK!!
A 10% correction in 20 days, the 5th fastest correction in the last 75 years (fastest ever was 8 days during the onset of Covid – 2/27/20)
THE TRIGGERING SEQUENCE
-
VALUATIONS: Concern with Mag-7 sustaining rate of sales growth and historic level of margins
-
ROTATION: Rotation begins to S&P 500 493 and cheaper Euro and European bank stocks.
-
DOLLAR WEAKNESS: Weakening USD with falling US stocks forces European to chase DAX & Military Build up stocks
-
GROWTH: US Economic growth becomes an increasing concern primarily on the worry of Tariffs and Trade Wars.
-
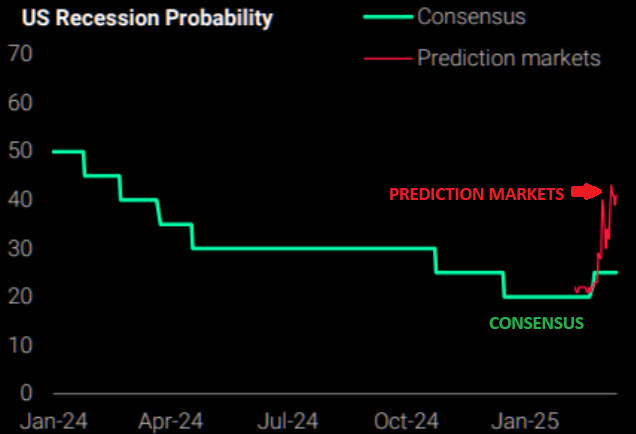
RECESSION: A late 2025 US Recession increasing;y on investors radar
The Prediction Markets (chart above right) were early and highly accurate in predicting a Trump victory. They are rapidly seeing the betting increase for a Recession ahead!
GROWTH => STAGFLATION => RECESSION
THIS IS NOT THE START OF A BEAR MARKET FOR US STOCKS
STILL MOST LIKELY ONLY A INTERMEDIATE DEGREE "WXYXZ" CORRECTION
More pain may be in stocks (after a bounce) as the current “down-in-yields/down-in-stocks” move is ominous, and very 2000, 2002, 2008. Buy SPX @ ~5300 in late Spring
| |
REASONS TO CONTINUE TO BE FEARFUL:
- Growth Concerns (payrolls + ISM manuf.. follows weak confidence readings)
- Tariff Fatigue magnified by thematic re-pricing in AI
- Global Complexity (Ger & Fra Yields breaking out + China higher again on JD, BABA QwQ-32B AI Model)
- Technicals Weak (SPX flirting with 200dma 5732, counterbalanced by most major indices & single stock bellwethers approaching technically "oversold" levels)
- Systematic Supply (CTAs have sold almost $60bn of US equity delta in the last week, ~30bn SPX)
- Positioning Elevated (HF Gross Leverage rose +1.1 pts this week and sitting in 100th percentile vs past 1-year // Nets remained ~flat and in 47th percentile vs past 1-year)
- Liquidity very challenged making new lows
- LO Risk Reduction (seen in relative out-performers such as HCare, Utilities, & Semis)
- Consumer Woes (think: ANF, FL, ROST, VSCO, Cruise lines, etc.)
- Poor Seasonality (bounce set up for 3/14)
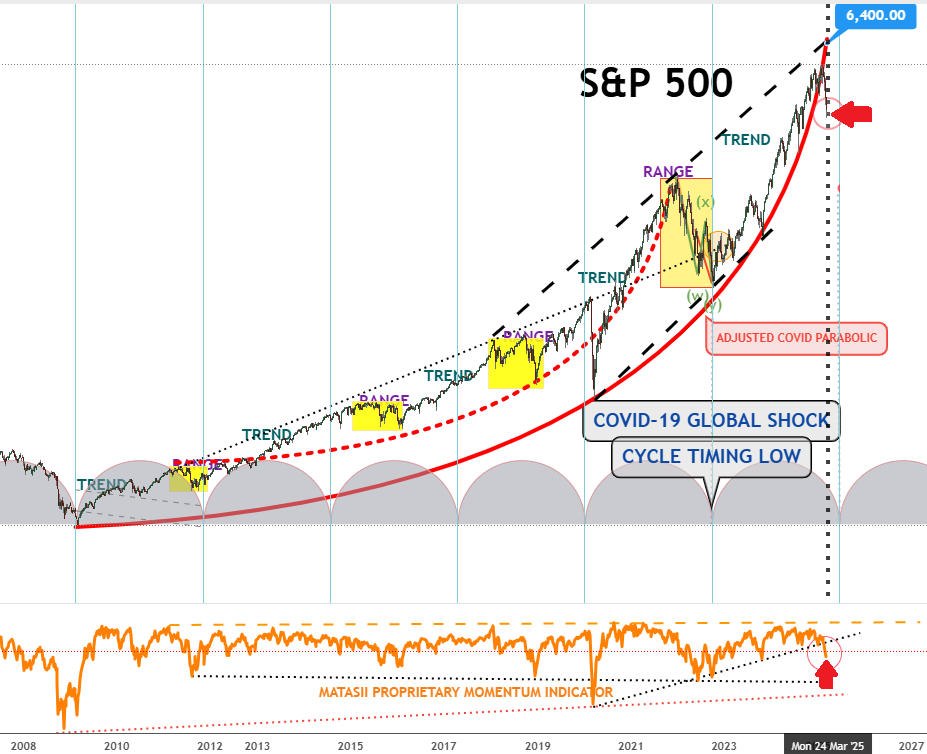
| | ***S&P 500 MONTHLY - POST GFC*** | |
CHART NOTES:
-
PRICE - Price has decidedly broken away and below the red parabolic trend that has been in place since the 2008 GFC with one modification (a big one) for Covid.
-
MATASII PROPRIETARY MOMENTUM INDICATOR - Momentum in the bottom panel has broken the major support shown by the black dotted trendline & marked by the red arrow. The next level of support is much further below.
| | | |
MARKET LAB
Being bearish on US mega-cap tech carries higher risk than being bullish. Timing is crucial — history shows that even correctly calling the 2000 tech bubble peak, but being early led to massive rallies against short positions (13% in one month, 31% in three, and 94% in six). ,While today’s market may not have the same upside, Shorting US tech still requires near-perfect timing.
OBSERVATION -
During the 2000 Dotcom Bubble the market also weakened near the March Quadruple Witch, but didn't fully start breaking down until September.
| | | |
YOUR DESKTOP / TABLET / PHONE ANNOTATED CHART
Macro Analytics Chart Above: SUBSCRIBER LINK
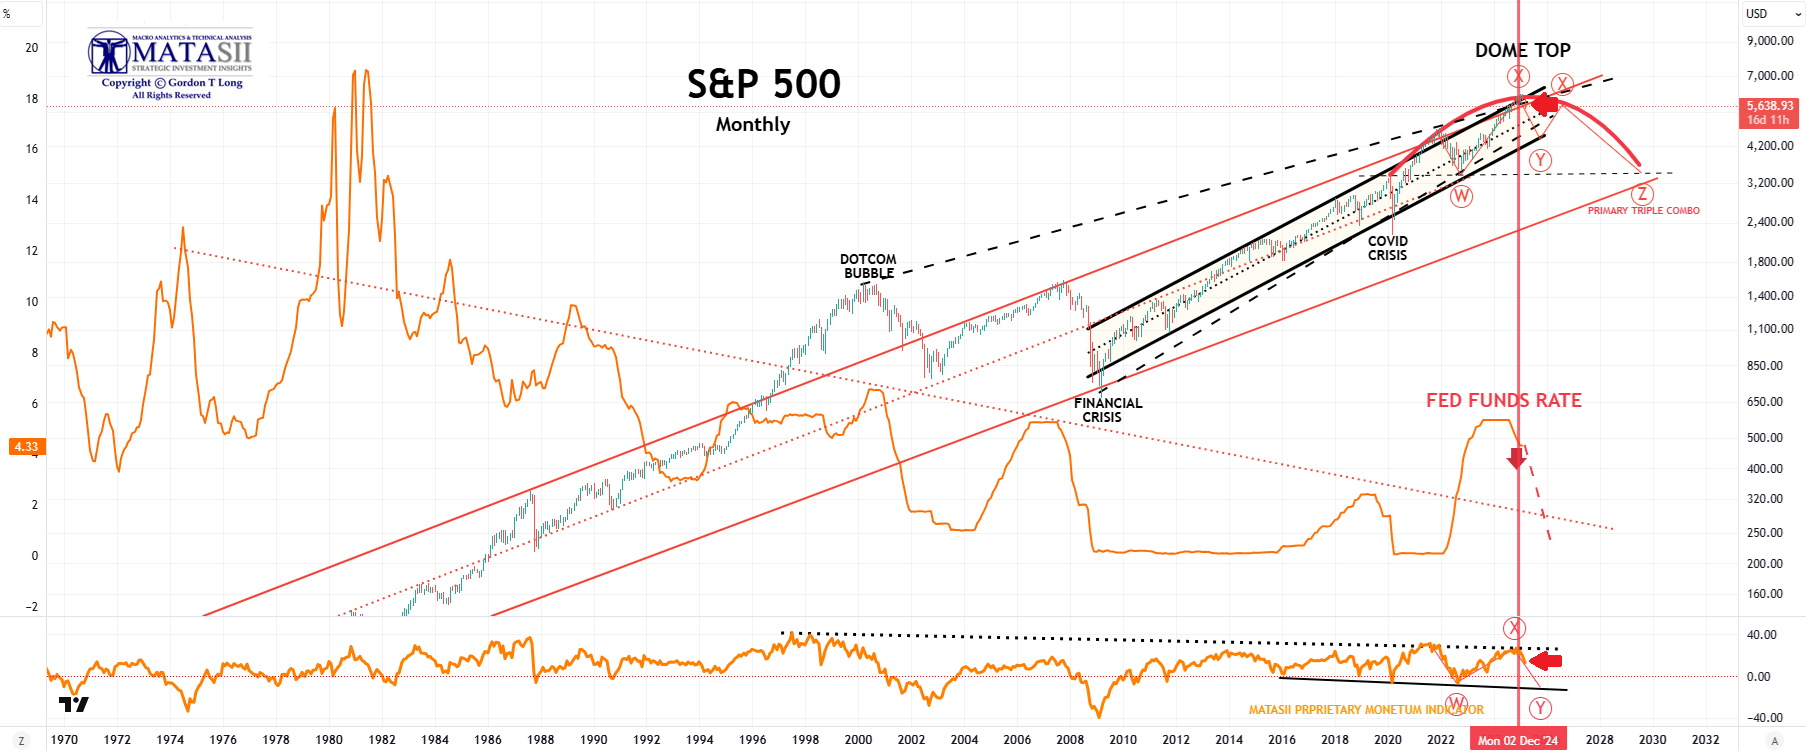
| | ***S&P 500 MONTHLY - 55 YEAR*** | |
CHART NOTES:
-
PRICE - The S&P 500 has stayed comfortably within the Dome Top (in red) which is to be expected at a major top since they normally take an extended period of time to develop.
-
MATASII PROPRIETARY MOMENTUM INDICATOR - Momentum in the lower panel has offered consistent overhead resistance support (marked by the the major black dotted trend line & marked above the red arrow.
| | | |
MARKET LAB
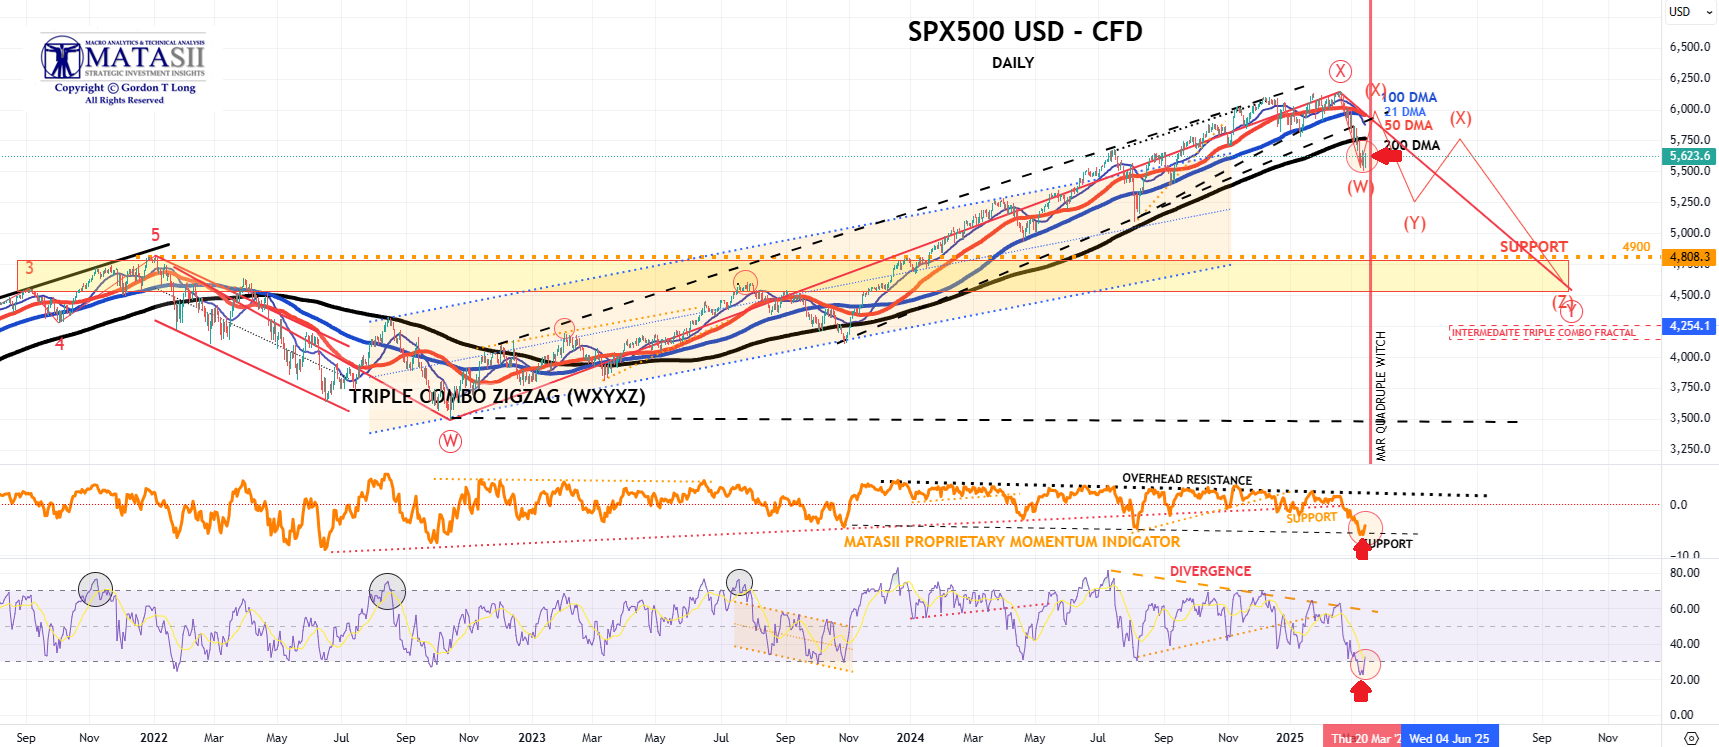
ELLIOTT WAVE COUNT
- The best overall Elliott Wave count we can arrive at is a Triple Complex Combo labeled as a Primary WXYXZ
- This count shows itself as a Fractal in lower degree counts down to the Daily level (see S&P 500 charts below, as well as in other Equity Indexes, the MATASII Banking and Financial Indexes.
| | | |
YOUR DESKTOP / TABLET / PHONE ANNOTATED CHART
Macro Analytics Chart Above: SUBSCRIBER LINK
| | |
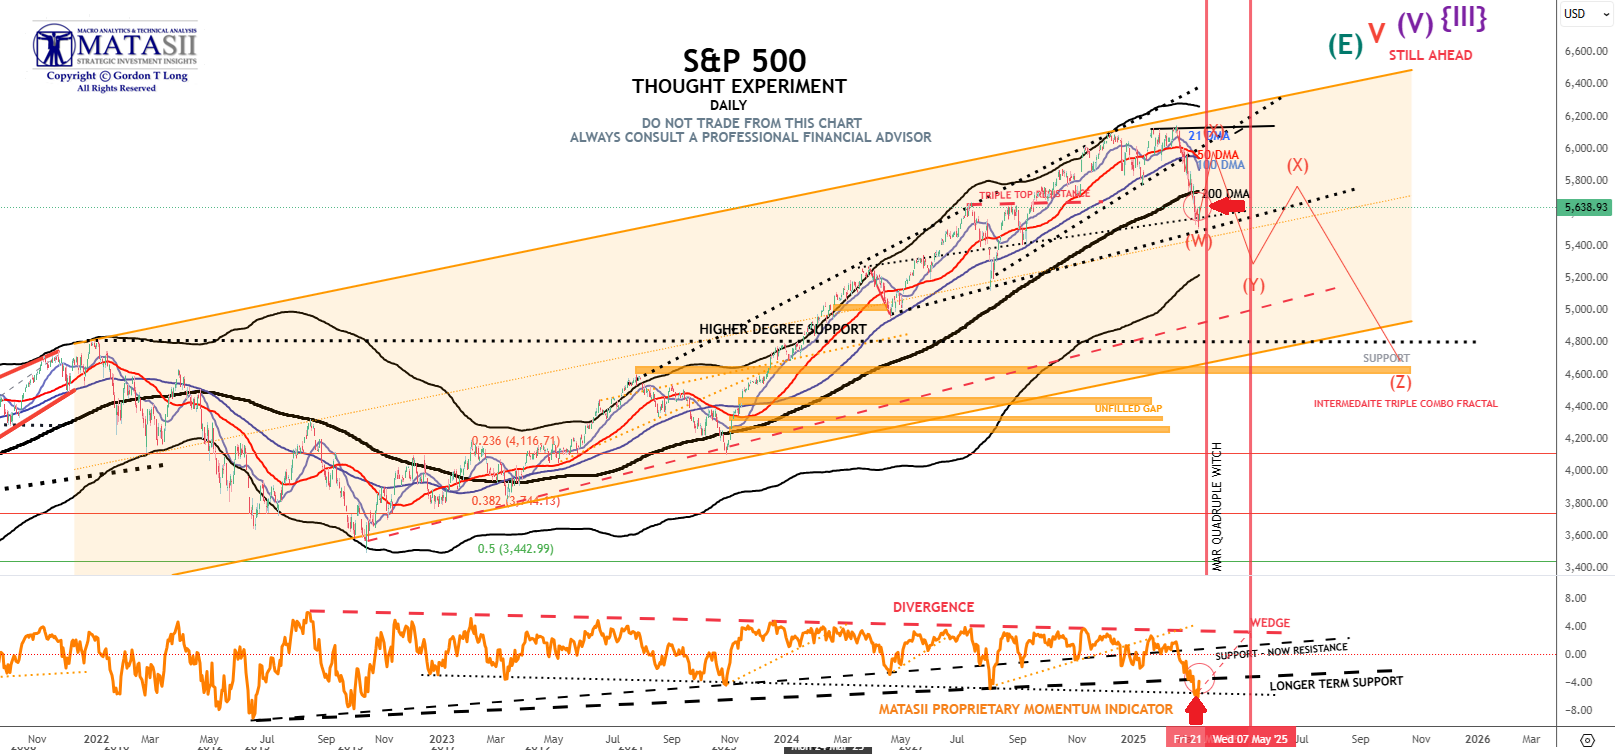
CHART NOTES:
-
PRICE - The S&P 500 was trading at the cash close Friday of 5667.57 up +4.69 (+0.18%) for the day but up for the week compared to last Friday's close at 5638.93 and Q1 highs.
-
WMA - Price tried over the week to move back towards the 40 WMA but stalled going into Q1 Quadruple OPEX Witching.
-
MATASII PROPRIETARY MOMENTUM INDICATOR - Momentum in the lower panel offers firm support at the black dashed trend line marked by the red arrow.
| | | |
MARKET LAB
ELLIOTT WAVE COUNT
- The best overall Elliott Wave count we can arrive at is a Triple Complex Combo labeled as a Primary WXYXZ
- This count shows itself as a Fractal in lower degree counts down to the Daily level (see S&P 500 charts below, as well as in other Equity Indexes, the MATASII Banking and Financial Indexes.
| | | |
YOUR DESKTOP / TABLET / PHONE ANNOTATED CHART
Macro Analytics Chart Above: SUBSCRIBER LINK
| | |
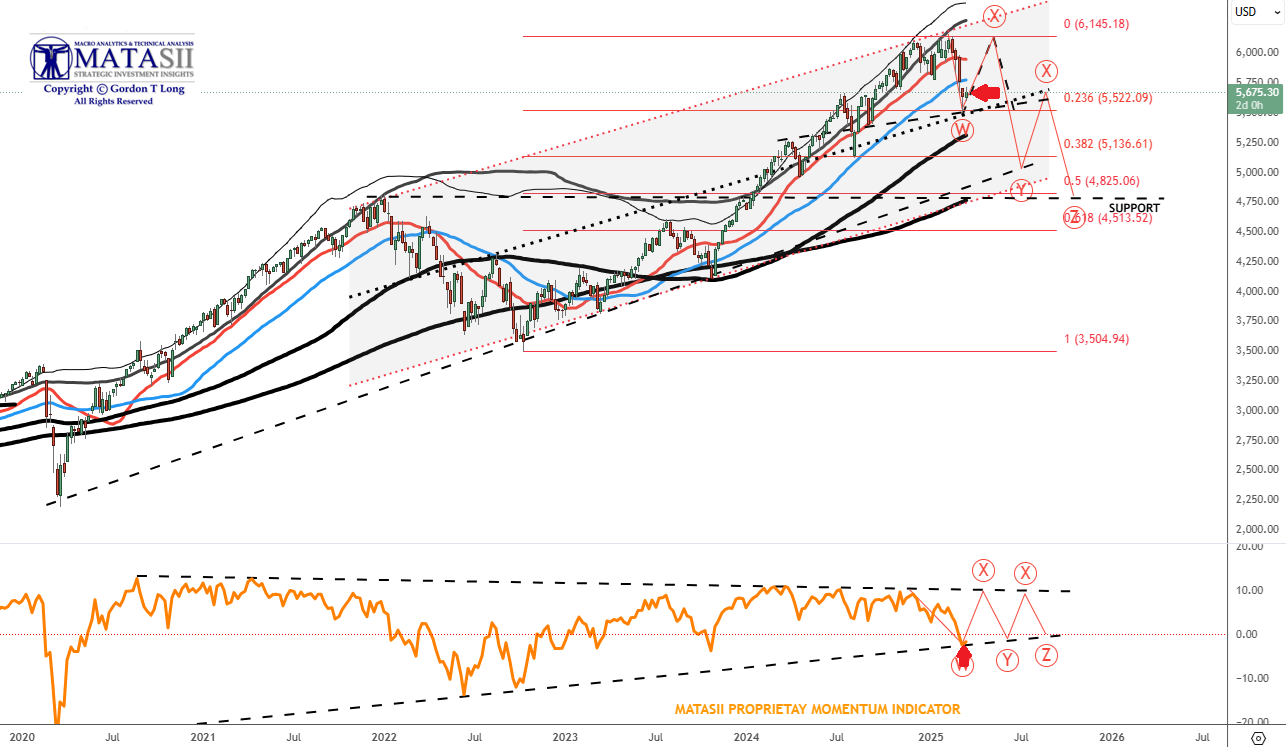
CHART NOTES:
-
PRICE - The S&P 500 was trading at the cash close Friday of 5638.93 up +117.40 (+2.13%) for the day but down significantly compared to last Friday's close at 5770.19 and Q1 highs.
-
DMA - Price decidedly broke the important 200 DMA level finding temporary support at trend support levels shown below.
-
MATASII PROPRIETARY MOMENTUM INDICATOR - Momentum in the lower panel broke major support indicted by the black dashed trend line. Momentum found support at a lower support level marked by the red arrow.
| | | |
MARKET LAB
ELLIOTT WAVE COUNT
- The best overall Elliott Wave count we can arrive at is a Triple Complex Combo labeled as a Primary WXYXZ
- This count shows itself as a Fractal in lower degree counts down to the Daily level (see S&P 500 charts below, as well as in other Equity Indexes, the MATASII Banking and Financial Indexes.
| | | |
SPX CASH
CHART BELOW NOTES:
| | |
YOUR DESKTOP / TABLET / PHONE ANNOTATED CHART
Macro Analytics Chart Above: SUBSCRIBER LINK
| | |
SPX cfd
NOTES - CHART BELOW:
| | |
YOUR DESKTOP / TABLET / PHONE ANNOTATED CHART
Macro Analytics Chart Above: SUBSCRIBER LINK
| |
|
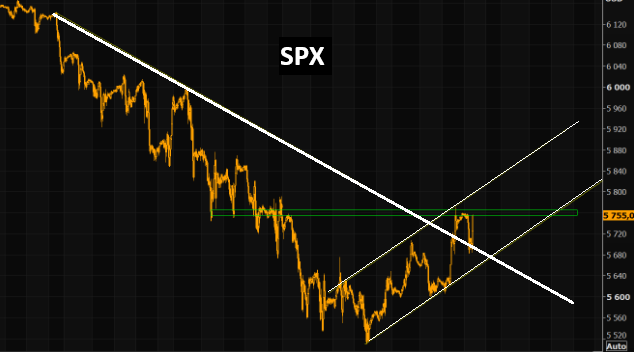
NEW-- PATTERNS - SPX
03-21-25
SPX has broken above the negative trend line that was intact during the correction. A bottoming out process and then a squeeze higher remains the biggest short term pain trade according to us. Key is a close above the resistance area.
| | | | |
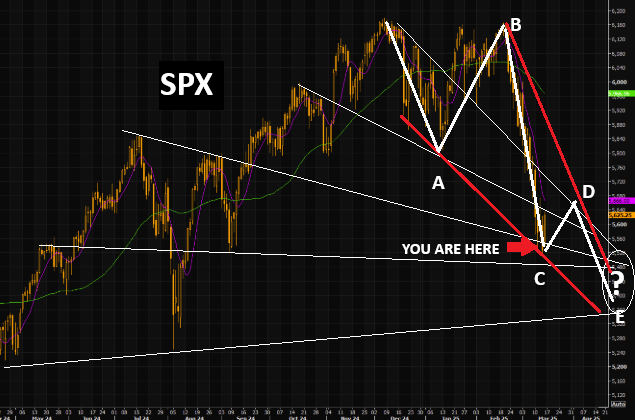
PATTERNS - SPX
03-14-25
SPX has come down quickly. These "Convergence" lines have historically often been quite predictive!
| | | |
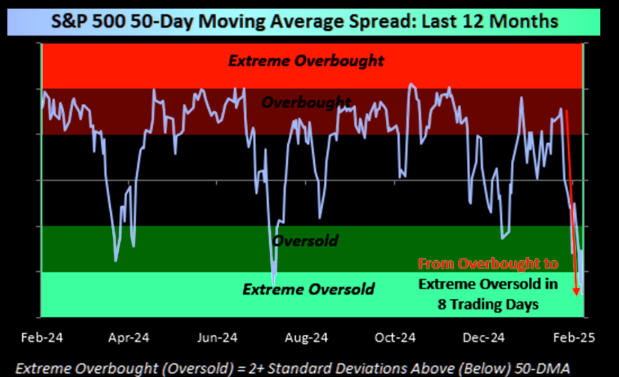
SENTIMENT - OVERSOLD
03-08-25
The S&P went from overbought to extreme oversold in just eight trading days recently.
| | | |
CONTROL PACKAGE
- APPLE - AAPL - DAILY (CHART LINK)
- AMAZON - AMZN - DAILY (CHART LINK)
- META - META - DAILY (CHART LINK)
- GOOGLE - GOOG - DAILY (CHART LINK)
- NVIDIA - NVDA - DAILY (CHART LINK)
- MICROSOFT - MSFT - DAILY (CHART LINK)
- TESLA - TSLA - DAILY (CHART LINK)
| | | | | |
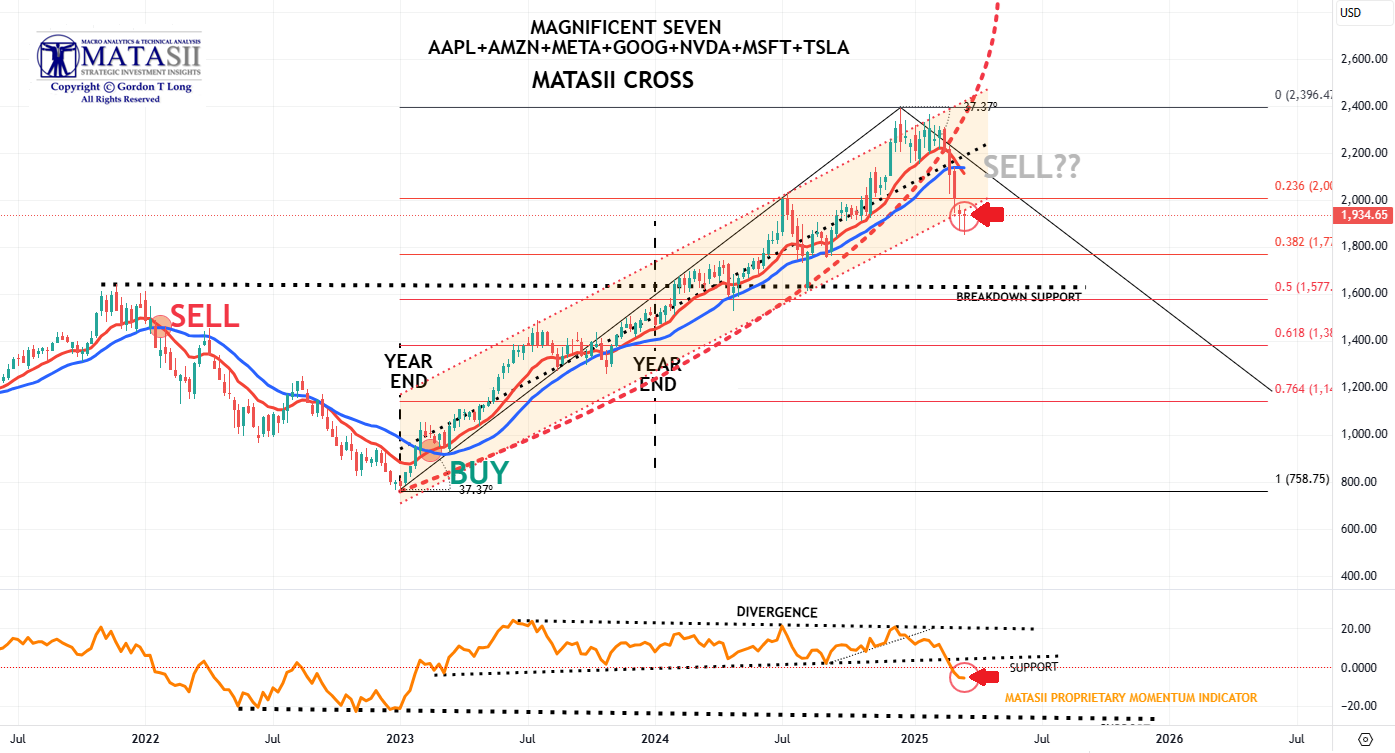
***MAGNIFICENT 7***
Mag-7 stocks are down
for the 7th week in the last 8.
03-21-25
MATASII CHART NOTES:
-
PRICE - The Mag-7 closed Friday at 1934.65 up +32.92 (+1.73%) for the week compared to last Friday when we closed at 1946.87.
-
MATASII PROPRIETARY MOMENTUM INDICATOR - Meanwhile the MATASII Proprietary Momentum Indicator (lower panel) having broken support level marked by the dashed black support trendline appears to be "hovering" before heading either up or down.
-
MATASII CROSS: The MATASII red control line has crossed the MATASII blue control line signalling a SELL condition. We show the SELL signal in grey because we like to have further separation before confirming the signal as valid.
| | | |
MARKET LAB
Consider that the typically high-performing S&P 500 technology sector lagged the broader index in January by the widest margin since 2016. Four of the Magnificent 7 have recently been trading below their 50-day moving averages, another bearish signal for traders. In addition, hedge funds are increasingly reducing gross exposures to these kinds of stocks for the first time in a year, while companies' insiders are selling shares at the highest rate since 2021, raising questions about the company's ability to achieve earnings targets and justify their lofty valuations. (Morgan Stanley)
OUR PROPRIETARY MATASII CROSS IS ON THE CUSP OF GIVING US
A SELL SIGNAL FOR THE
MAGNIFICENT SEVEN
(CHART BELOW)
| | | |
YOUR DESKTOP / TABLET / PHONE ANNOTATED CHART
Macro Analytics Chart Above: SUBSCRIBER LINK
| |
|
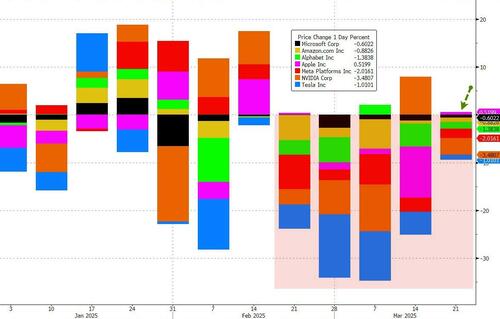
NEW-- PERFORMANCE
03-21-25
AAPL was the only Mag-7 stocks to close green this week...
MSFT down 8 days in a row - longest losing streak since 2008
TSLA down 9 weeks in a row
| | | | | |
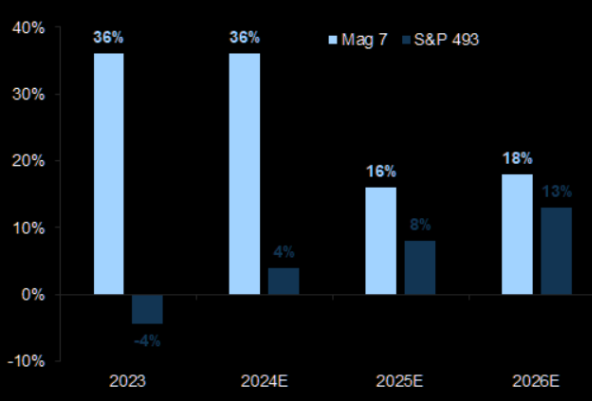
EARNING - 03-14-25
Expect earnings conversion
Despite recent large earnings growth differences between the Magnificent 7 and the rest of the S&P 500, we now expect convergence
| | | |
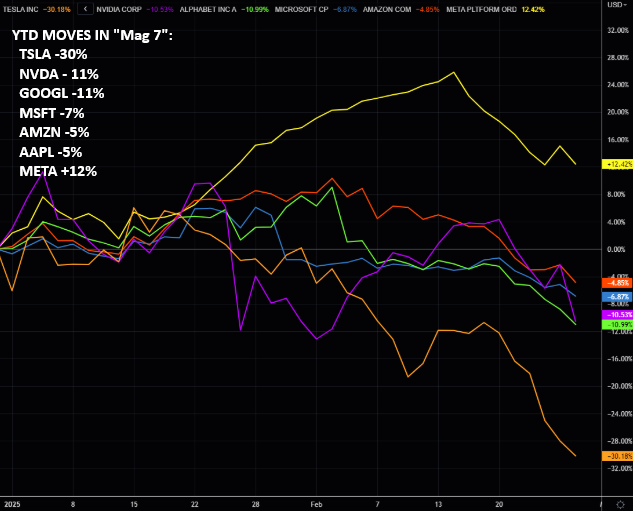
PATTERNS - 02-28-25
MAG7 - YTD moves in "Mag 7":
TSLA -30% / NVDA - 11% / GOOGL -11% / MSFT -7% / AMZN -5% / AAPL -5%...META +12%
| | | |
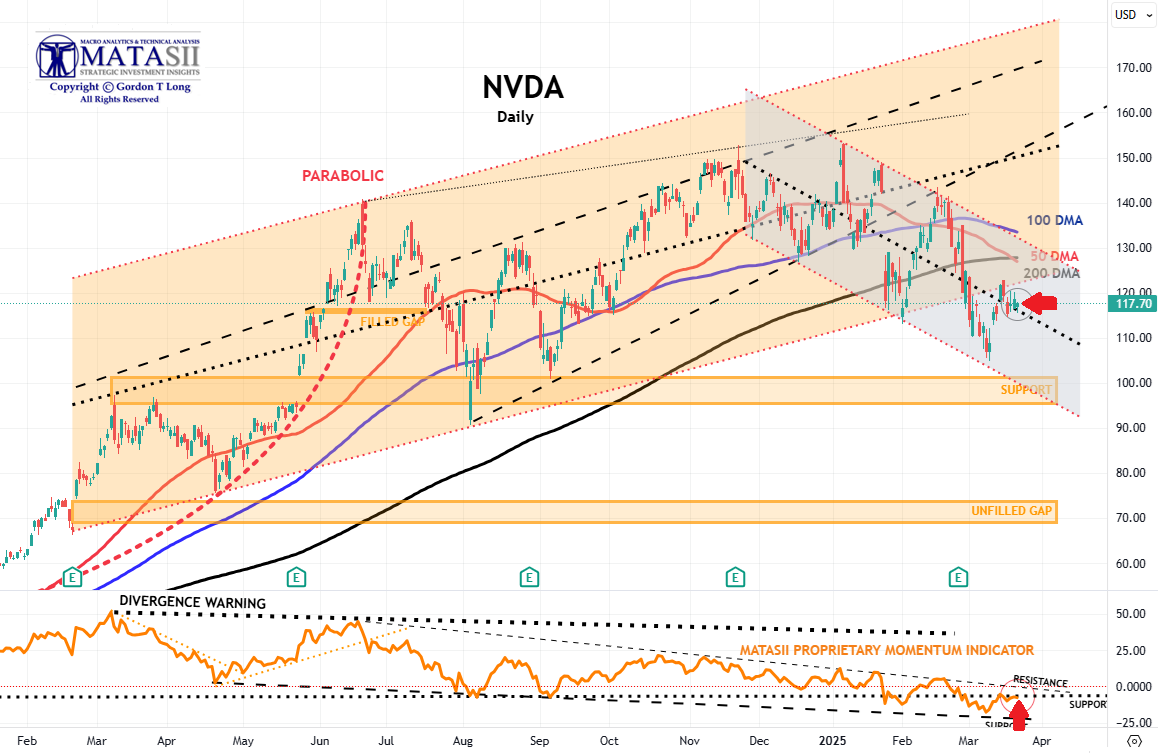
***NVIDIA - NVDA - DAILY***
MATASII CHART NOTES:
-
PRICE - NVDA closed Friday closing at 117.70 down -0.83 (-0.70%), compared to last Friday at 121.67
-
DMA - Price has broken well below the 200 DMA. it appears to be looking for the 80 WMA (not shown on this chart) at ~98.92
-
MATASII PROPRIETARY MOMENTUM INDICATOR - The NVDA MATASII Momentum indicator finally found support at a major support level (black dashed line) before rallying to an overhead resistance trendline (dotted black trendline).
Prior Longer Term Note:
- At some point, the major unfilled gaps (at much lower levels) must be filled. We anticipate a likely test of the 200 DMA in Q4 2024 or Q1 2025.
- NVDA therefore may no longer become a Short to Intermediate Long Term hold, but rather a position trading stock, as other competitors enter the space, force margins and the earnings growth rate contracts.
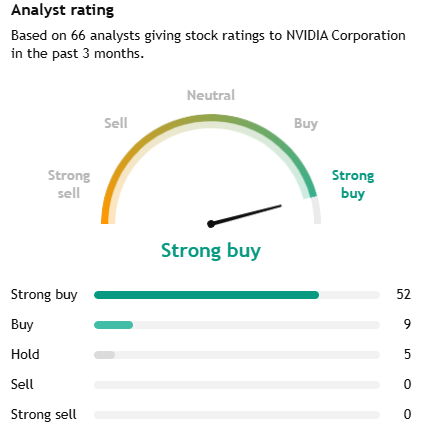
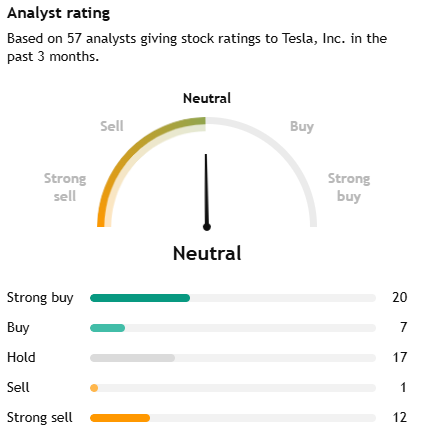
NOTE RIGHT: Analyst Rating to the right are always too positive and delayed. History suggests the trick is to BEGIN reducing positions as soon as ANYONE changes their rating to Hold or Lower.
5 OUT OF 66 IS A CONCERN
(We use the ratings for Mag-7 Only.)
| | | |
MARKET LAB
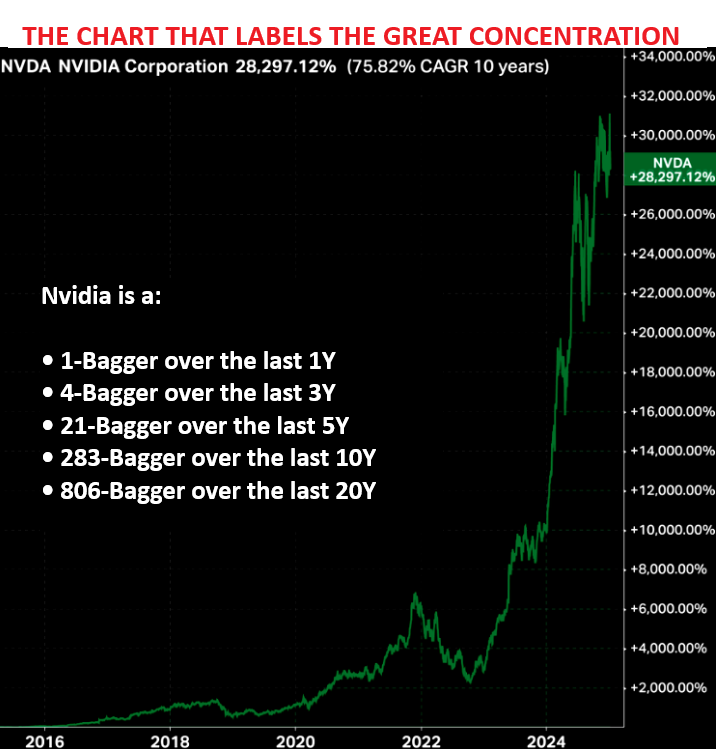
AS GOES NVDA SO GOES THE MAG-7!
AS GOES THE MAG-7 SO GOES THE MARKET!
| |
With a market cap of $3.61tn and nearly as big as the entire DAX and CAC combined, earnings are going to be a big event. To give you a scale for their astonishing earnings trajectory over such a short period of time, at the recent lows in Jan 2023 Nvidia earned $4.4bn over the preceded last 12m. However, today the consensus will see them earn $61.4bn over the last 12 months. By the time we hit 2027, they are expected to earn $118.1bn LTM.
The growth in NVDA’s forward revenues and operating earnings have both been remarkable, as has its ability to maintain a forward profit margin north of 55%. Nvidia’s forward P/E of 32.6 is certainly higher than the S&P 500’s forward earnings multiple of 21.6. But it looks reasonable relative to the company’s expected forward earnings growth of 53.1%.
| | | |
YOUR DESKTOP / TABLET / PHONE ANNOTATED CHART
Macro Analytics Chart Above: SUBSCRIBER LINK
| | | | | |
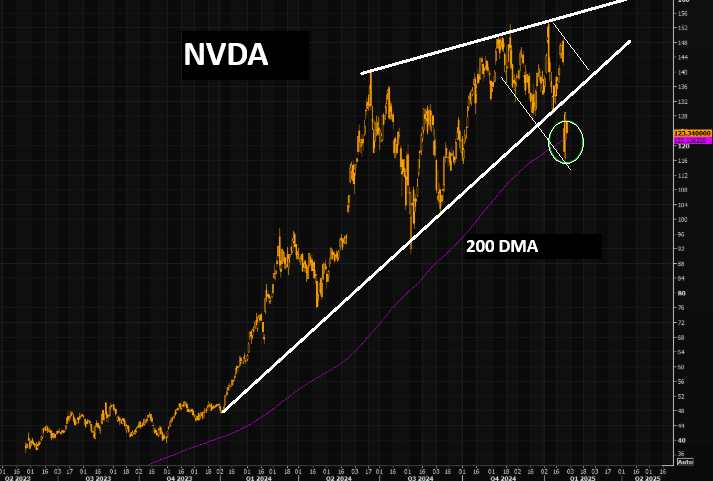
CHART RIGHT-- NVDA - 01-29-25
Fighting the 200 DMA
NVDA is trading right on the 200 day moving average as of writing. Massive moves, especially if you consider the changes in market cap. This is not how strong leaders behave.
| | | |
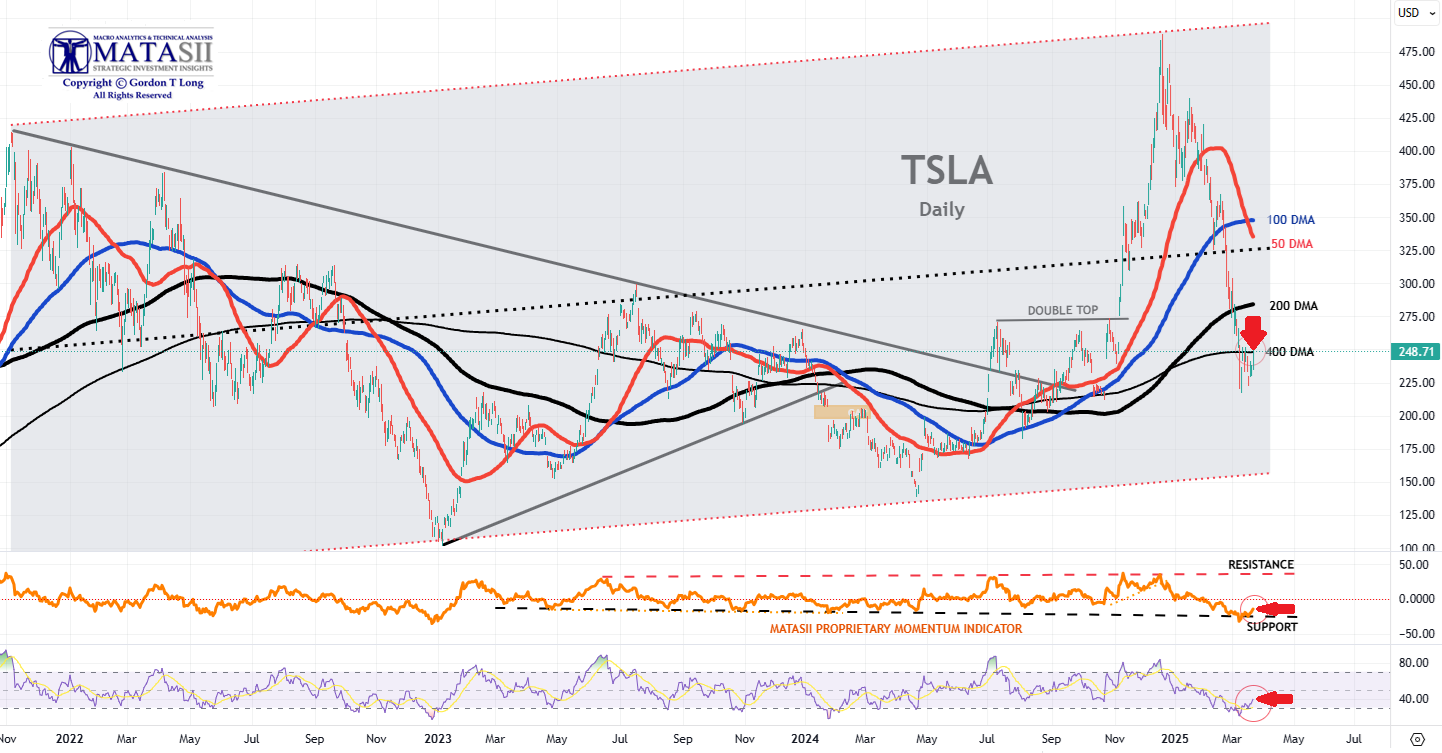
***TESLA - TSLA - DAILY***
MATASII CHART NOTES:
-
PRICE - TSLA closed up Friday at 248.71 +12.45 (+5.27%) for the day.
-
DMA - Price has found support at ~ the 400 DMA (at the 80 WMA not shown here).
-
MATASII PROPRIETARY MOMENTUM INDICATOR - TSLA's MATASII Momentum Indicator is offering an important level of support as shown by the black dashed trend line in the middle panel and marked by the red arrow.
NOTE RIGHT: Analyst Rating to the right are always too positive and delayed. History suggests the trick is to BEGIN reducing positions as soon as ANYONE changes their rating to Hold or Lower.
30 OUT OF 57 IS EXCESSIVE
(We use the ratings for Mag-7 Only.)
| | |
| | |
YOUR DESKTOP / TABLET / PHONE ANNOTATED CHART
Macro Analytics Chart Above: SUBSCRIBER LINK
| | |
FOREIGN EXCHANGES
WATCH LIST
- GERMAN DAX (See Weekly Market Lab)
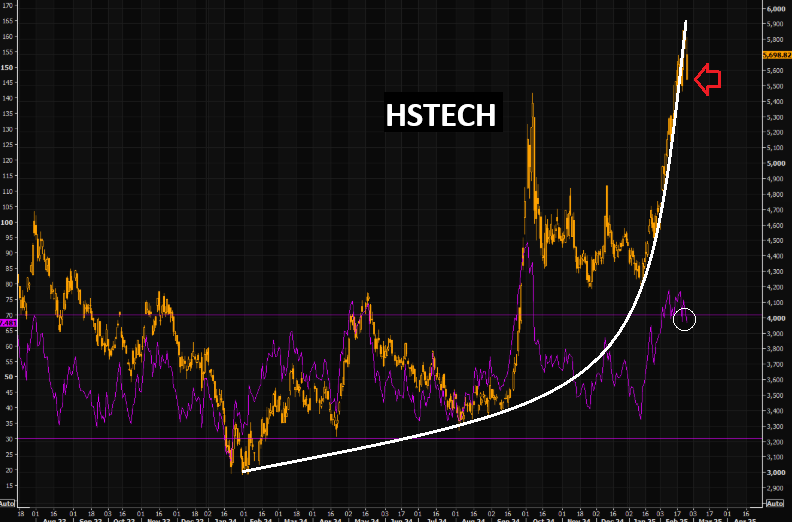
- CHINA TECH (See Weekly Market Lab)
- HSTECH
- KWEB
- BABA
| | |
| | |
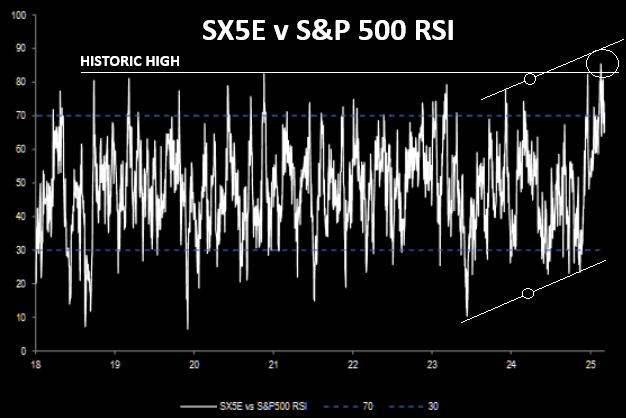
FOREIGN - EU -RELATIVE RSI
03-13-25
Europe's overbought mania
Relative SX5E/SPX RSI...
| | |
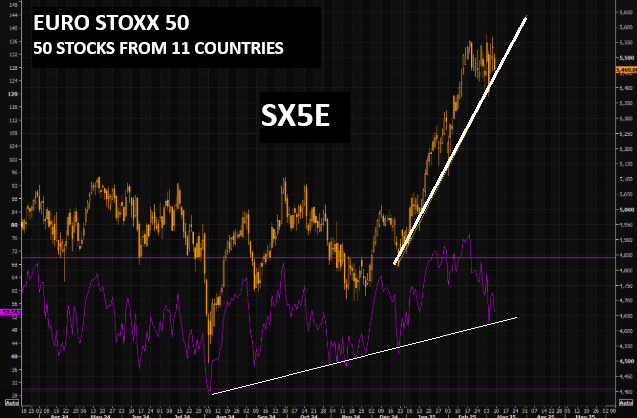
AHOT EUROPEAN MARKET
The SX5E is down 2% from the highest print a few sessions ago, and the index is flat since Feb 13. Note the short term trend line comes in around these levels. RSI is showing big negative divergences. The perceived SX5E bull is stronger than the realized.
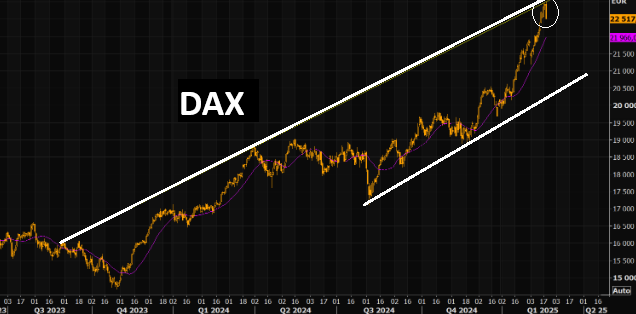
The German DAX has seen huge volatility over the past sessions, but we have actually not produced much gains since Feb 17. Huge volatility, minimal returns isn't what "serious" investors want. The positive trend channel that has been in place YTD remains intact, but we are getting increasingly "bothered" by the negative RSI divergence. DAX monthly RSI at 80! Sure, overbought can stay overbought for longer than most think possible, but last time we saw similar RSI monthly levels was followed by a correction for the index.
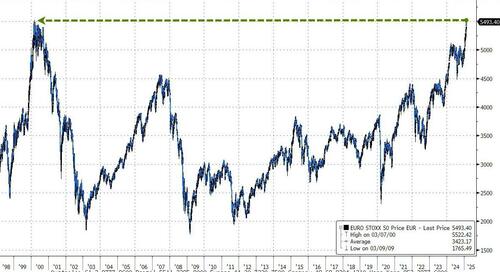
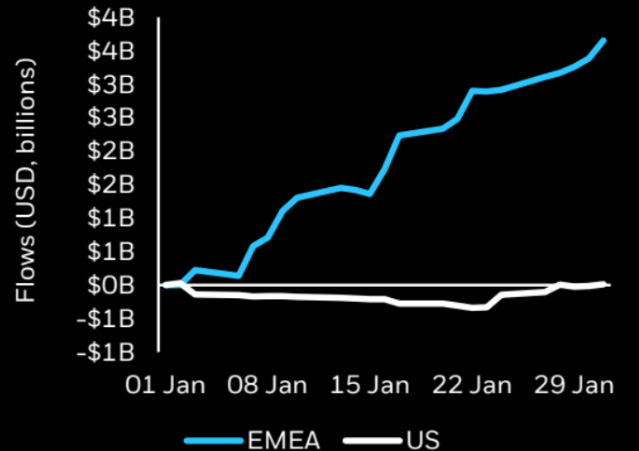
| | The last time the EuroStoxx50 printed a new all-time high was 14th March 2000...very nearly 25 years go! | | | FLOWS - European equity flows turned positive in January, with $3.7B of inflows – the highest level since February 2023. | | | |
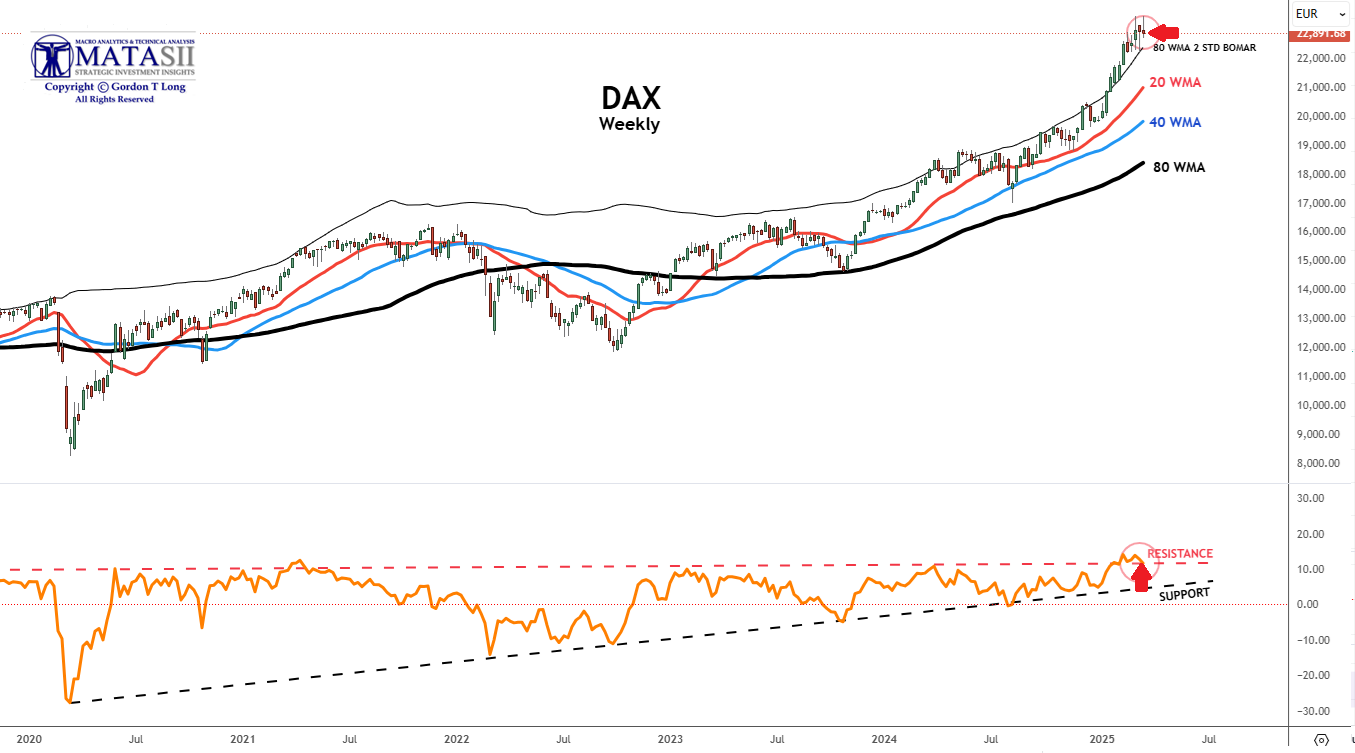
MATASII CHART NOTES:
-
PRICE - The DAX closed down Friday at 22,891.68 -107.47 (-6.47%).
-
WMA - The DAX is trading above the 80 WMA's 2 STD Bomar band and actually at exactly the 2.5 STD Bomar (not shown in the chart).
-
.MATASII PROPRIETARY MOMENTUM INDICATOR - The MATASII Momentum Indicator is currently offering overhead resistance at the upper red dashed trendline marked by the red arrow.
| | | |
THE GERMAN DEFENSE BAZOOKA
- The Bundestag voted on a massive package of fiscal stimulus that will revoke the constitutional brake on how much debt the government can take on, and green-light borrowing up to about $1 trillion to spend on defense and infrastructure.
- This authorization outstrips the spending booms that came with the postwar Marshall Plan and with German Reunification in the early 1990s.
- This is an epic change of direction, which brings profoundly held historical views into question. The last time Germany rearmed, in the 1930s, the result was global disaster, and German politicians had assumed for decades that the world would not countenance their return as a military power.
| | | |
YOUR DESKTOP / TABLET / PHONE ANNOTATED CHART
Macro Analytics Chart Above: SUBSCRIBER LINK
| | |
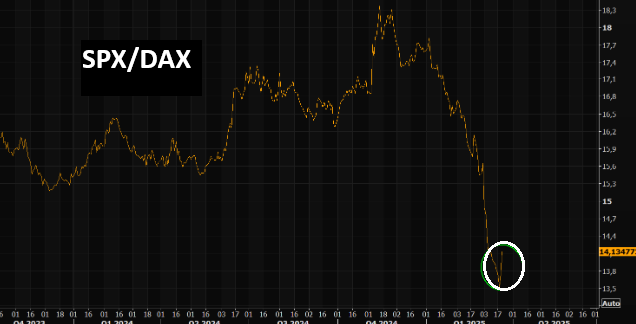
NEW-- CORRELATION - SPX v DAX
03-21-25
Tempting to try that SPY/DAX pairs post the brutal collapse in the ratio.
| | | |
GERMAN DAX - 02-19-25
Our Proprietary MATASii methodology published last weekend (chart left) spotted this drawdown perfectly. DAX reversing perfectly off that huge upper trend line. The DAX squeeze has managed sucking in a lot of suckers. First support at 21k (futures), but this could correct much more.
| | | |
CONTROL PACKAGE
- Invesco DB Agricultural Fund (DBA)
- VanEck Agribusiness (MOO)
- Food Producers (FT350 Food Producers - NMX45)
- Teucrium Agricultural Fund ETV (TAGS)
- Advisory Shares Restaurant ETF (EATZ)
- Invesco Food & Beverage ETF (PBJ)
- Teucrium Wheat Fund ETV (WEAT)
- Teucrium Corn Fund ETV (CORN)
- Teucrium Soybean Fund ETV (SOTB)
- Teucrium Sugar Fund ETV (CANE)
| | | | | |
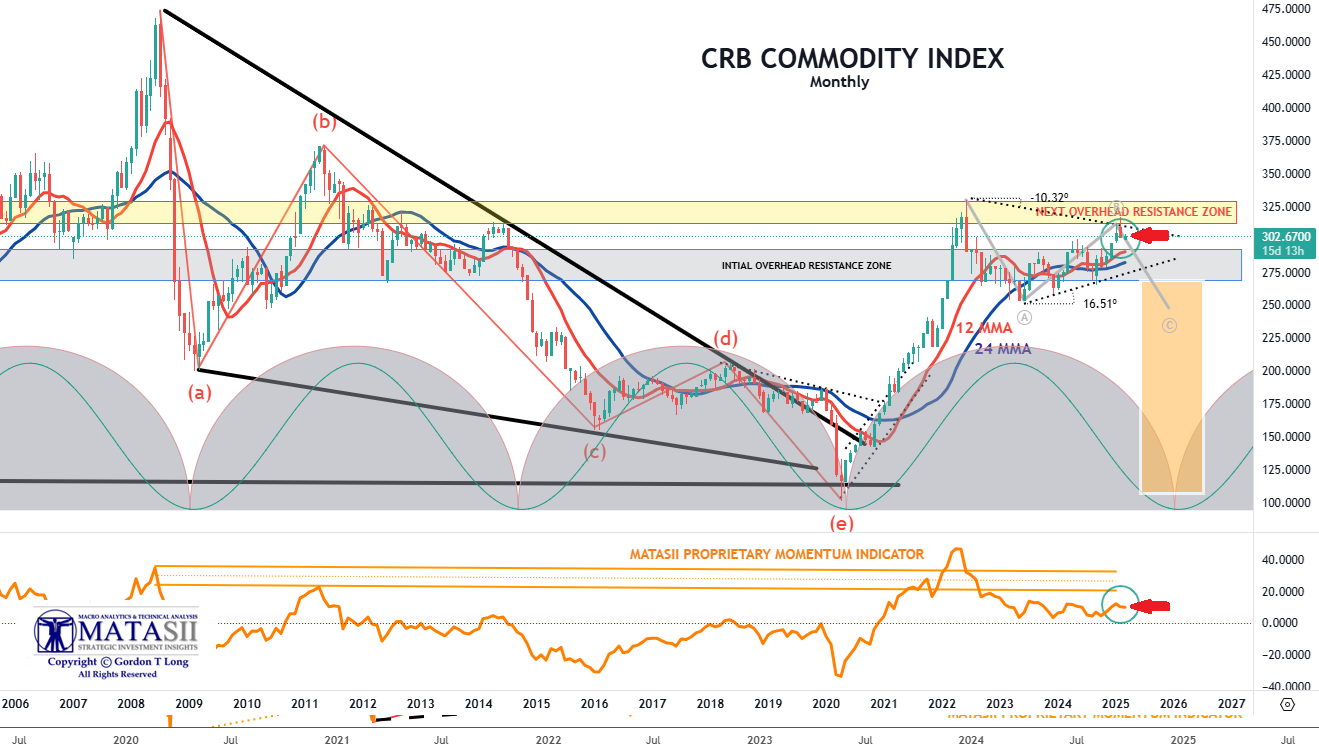
***CRB COMMODITY INDEX***
CHART NOTES:
- The overall Commodity Indexes, as measured by the CRB Commodity, reflect a Corrective / Consolidation is presently nearing completion.
- However, many of the individual sectors (not shown here) have already completed the Corrective / Consolidation and broken higher over the last 30-60 days.
| | | |
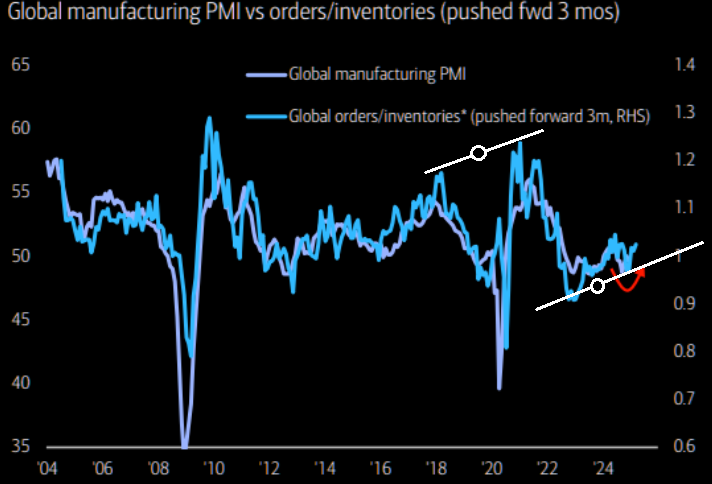
01/18/25: Rising global PMIs = Long commodities
Got Commodities?
| | | |
YOUR DESKTOP / TABLET / PHONE ANNOTATED CHART
Macro Analytics Chart Above: SUBSCRIBER LINK
| | |
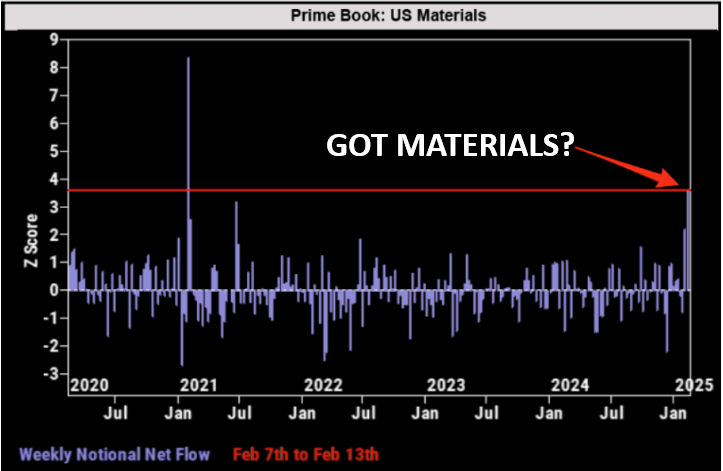
COMMODITIES - MATERIALS
02-20-25
HFs net bought US Materials at the fastest pace since February 2021, driven entirely by long buys.
| | | |
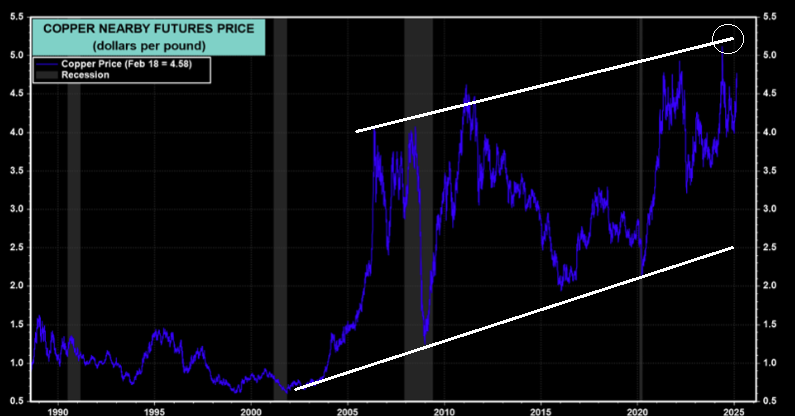
DR COPPER - 02-20-25
"If the aggressive fiscal actions taken by Trump 2.0 and the Chinese government improve global economic growth, that might increase business and consumer confidence and spending. We’ve been watching for signs of this in copper prices, which have popped 14.9% ytd."
| | | |
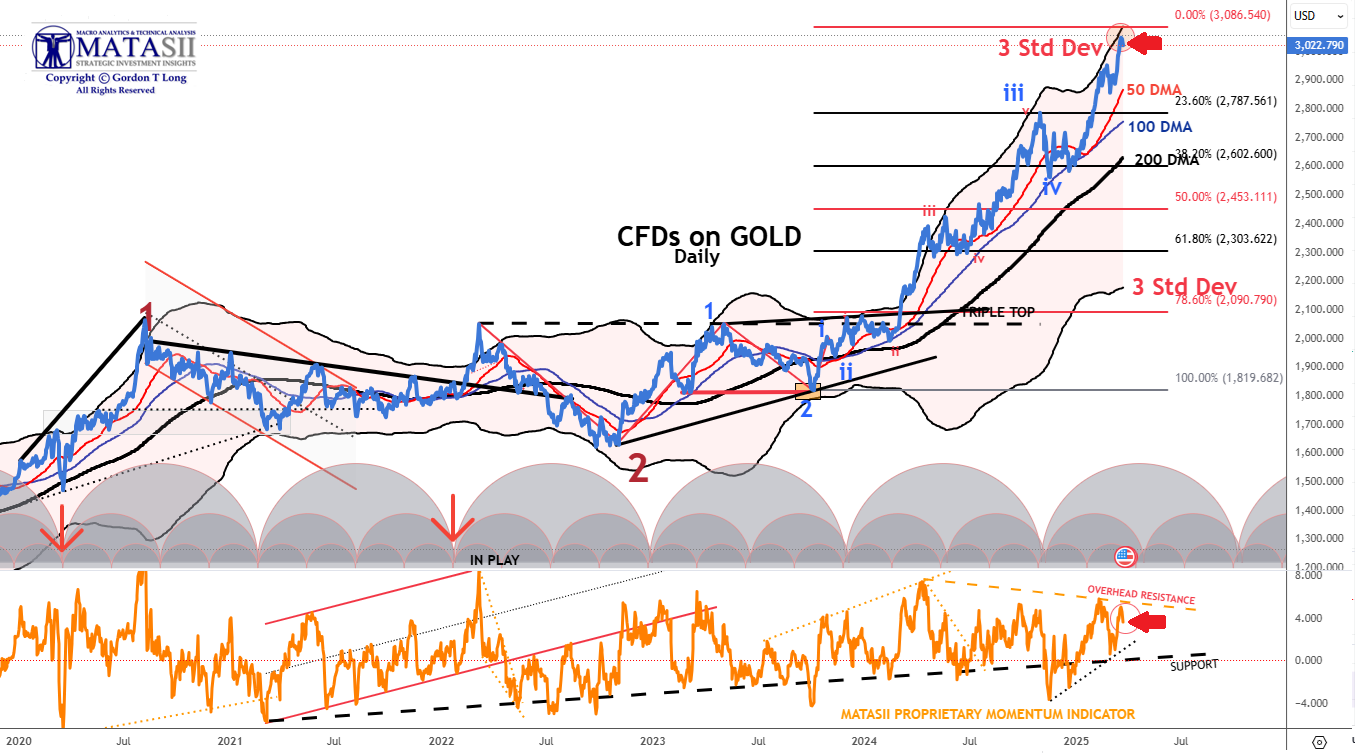
***GOLD***
Gold was monkey hammered Friday, testing down to $3000 and finding support to end the week higher, up 11 of the last 12 weeks.
CHART NOTES:
-
PRICE - Gold fell with Friday's post-market trading at 3022.79 down -21.62 (-0.71) for the da.
-
3 SIGMA BOMAR - Gold is once again back at its' 3 Standard Deviation Bomar Band and just off its' new high earlier in the week.
-
MATASII PROPRIETARY MOMENTUM INDICATOR - Momentum found support at a lower MATASII Momentum Indicator trend line shown in the lower panel and marked by the black dashed trendline before bouncing above a small degree overhead resistance trendline (as shown by the red arrow).
GOLD IS DUE FOR A CORRECTIVE / CONSOLIDATION!
| | | |
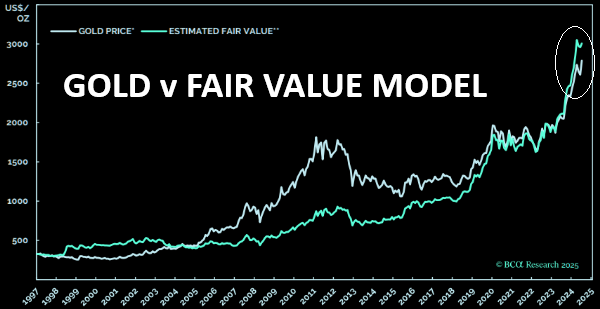
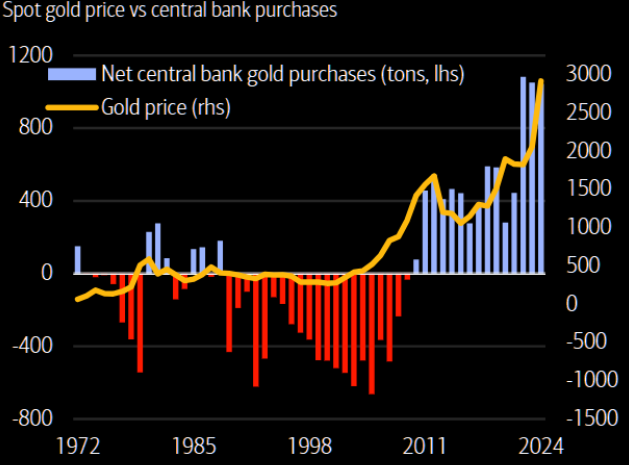
CORRELATION - 03-07-25
GOLD versus Fair Value Model
| |
SITUATIONAL ANALYSIS
- Gold has recently been supported and further boosted by the PBoC resuming Gold purchases in November after a six-month halt.
- We note that ETF buying however has been surprisingly weak over the past four years, as shown by the 2nd chart above.
| | | |
YOUR DESKTOP / TABLET / PHONE ANNOTATED CHART
Macro Analytics Chart Above: SUBSCRIBER LINK
| |
|
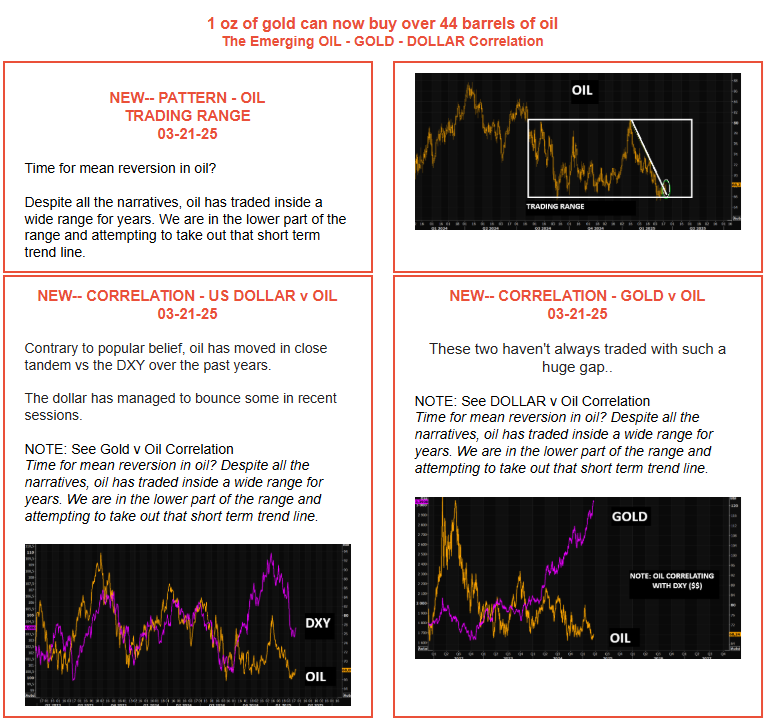
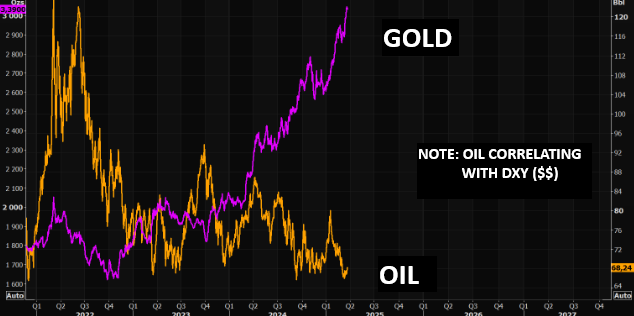
NEW-- CORRELATION - GOLD v OIL
03-21-25
These two haven't always traded with such a huge gap..
NOTE: See DOLLAR v Oil Correlation
Time for mean reversion in oil? Despite all the narratives, oil has traded inside a wide range for years. We are in the lower part of the range and attempting to take out that short term trend line.
| | | | | |
GOLD UPSIDE RISK
03-15-25
Goldman Sachs
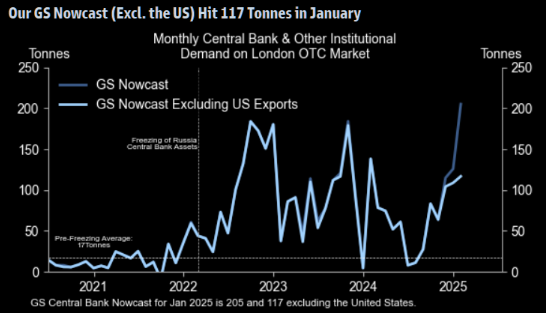
"We see upside risk to our $3,100 end-2025 base case and to our $3,100-3,300 forecast range because US policy uncertainty may support investor demand, and because we believe that central bank gold buying will remain structurally higher than before the freezing of Russian central bank reserves in 2022. We think this is the case even after a potential Russia-Ukraine ceasefire given the freezing of assets established a significant precedent."
| |
GOLD
CENTRAL BANK BUYING
03-14-25
The longer term gold Central Bank chart
Hunger for gold is huge.
| | | |
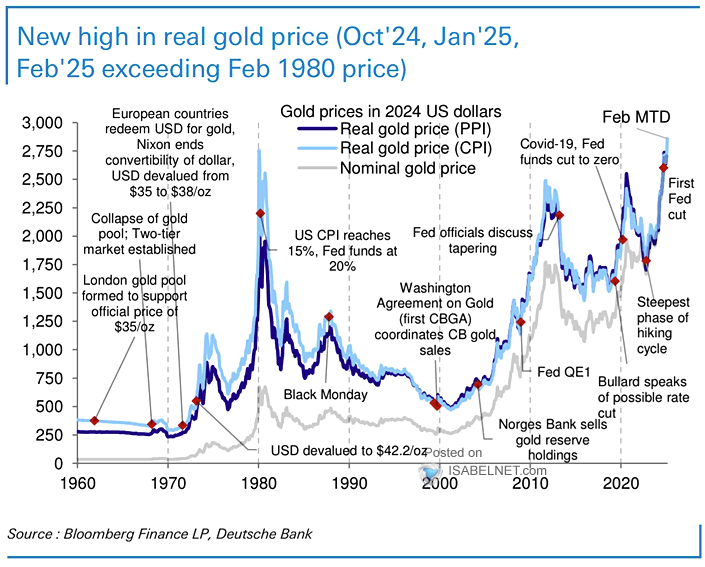
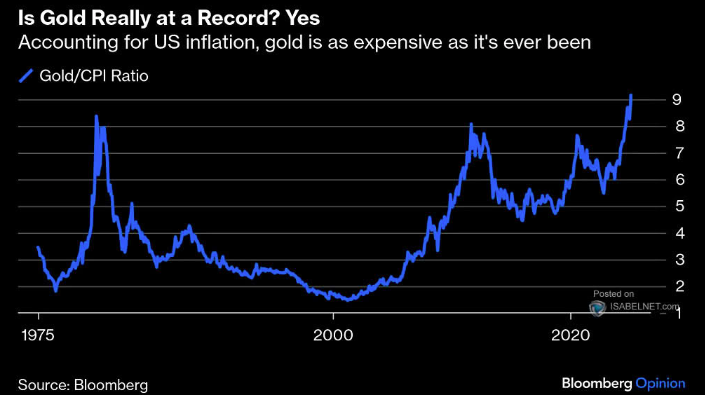
GOLD - 02-14-25
Gold Prices in 2024 U.S. Dollars - The real (inflation-adjusted) price of gold has reached a new all-time high, driven by several factors including U.S. tariff uncertainties, geopolitical tensions, and increased demand from global central banks. - Deutsche Bank
| |
GOLD/CPI RATIO - 02-12-25
The inflation-adjusted price of gold has reached a new high, breaking its previous record from January 1980. This reflects the ongoing devaluation of the U.S. dollar, global economic uncertainties and strong demand from central banks.
| | | |
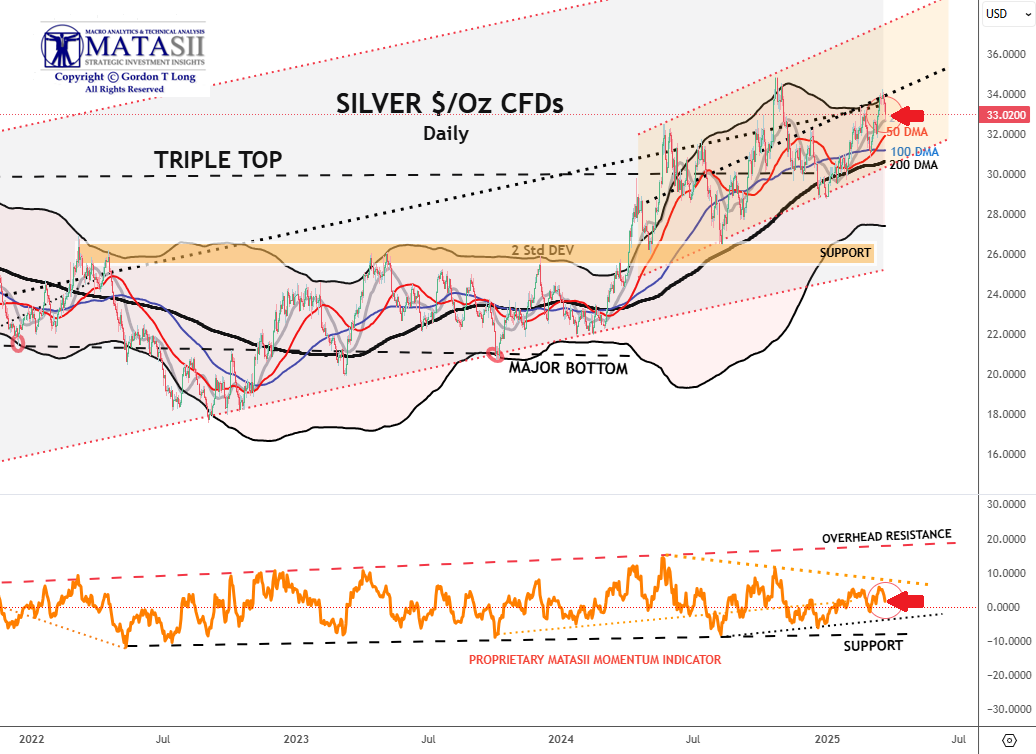
***SILVER***
MATASII CHART NOTES:
-
PRICE - Silver closed Friday at 33.02 down -0.525 (-1.57%) for the day, compared to last Friday's close at 33.234
-
DMA - Silver found support at the 21 DMA
-
MATASII PROPRIETARY MOMENTUM INDICATOR - The MATASII Proprietary Momentum Indicator shows there is more upward potential before touching overhead resistance.
| | 02-17-25: Silver often comes late to the party, but when it finally gets there it can be an unstoppable hedonist. | | |
YOUR DESKTOP / TABLET / PHONE ANNOTATED CHART
Macro Analytics Chart Above: SUBSCRIBER LINK
| | |
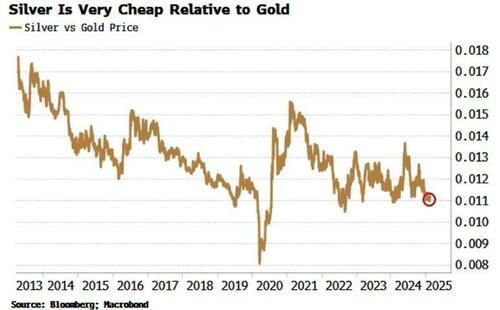
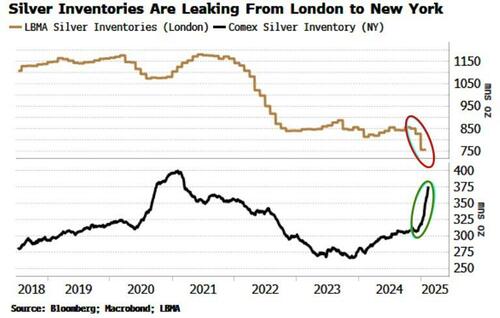
SILVER - 02-17-25
We are seeing the same dynamics with silver as we are seeing with gold. There is a shortage of deliverable physical metal in London after years of EM central-bank hoarding.
Comex silver warehouses in the US are filling up while stocks in London are falling.
| | | |
CONTROL PACKAGE
There are TEN charts we have outlined in prior chart packages, which we will continue to watch closely as a CURRENT Control Set:
-
US DOLLAR -DXY - MONTHLY (CHART LINK)
-
US DOLLAR - DXY - DAILY (CHART LINK)
-
GOLD - DAILY (CHART LINK)
-
GOLD cfd's - DAILY (CHART LINK)
-
GOLD - Integrated - Barrick Gold (CHART LINK)
- SILVER - DAILY (CHART LINK)
-
OIL - XLE - MONTHLY (CHART LINK)
-
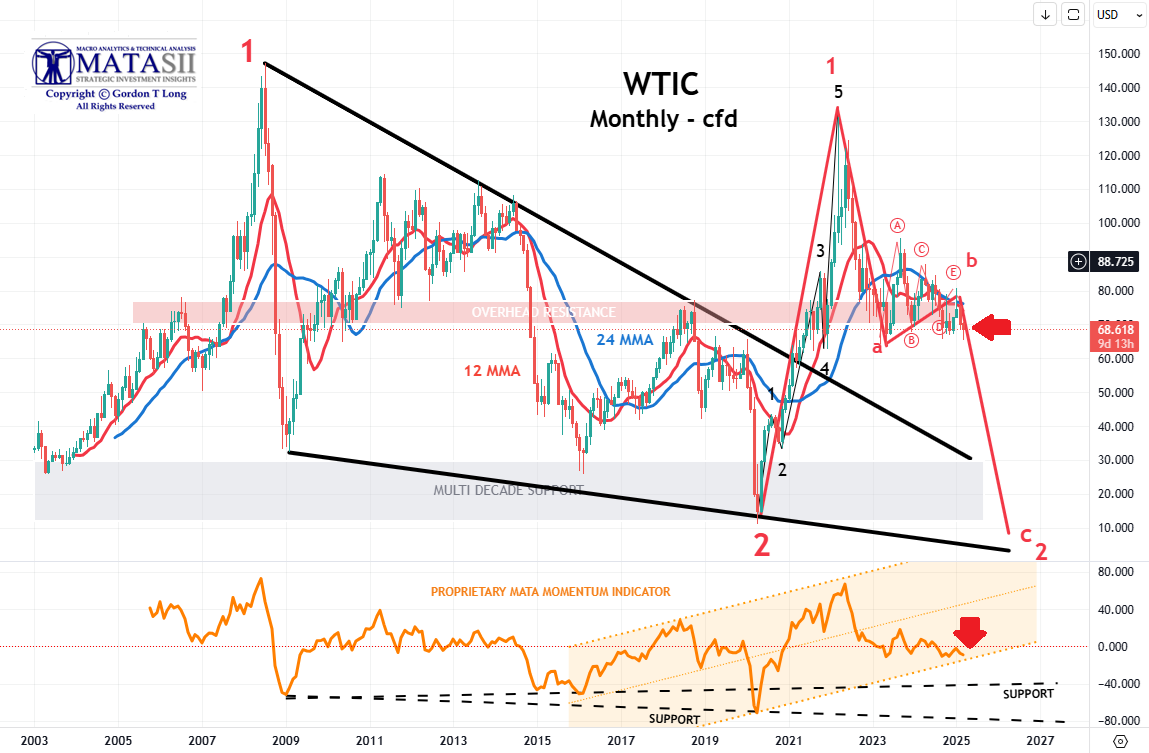
OIL - WTIC - MONTHLY - (CHART LINK)
-
BITCOIN - BTCUSD -WEEKLY (CHART LINK)
-
10y TIPS - Real Rates - Daily (CHART LINK)
| | |
| | |
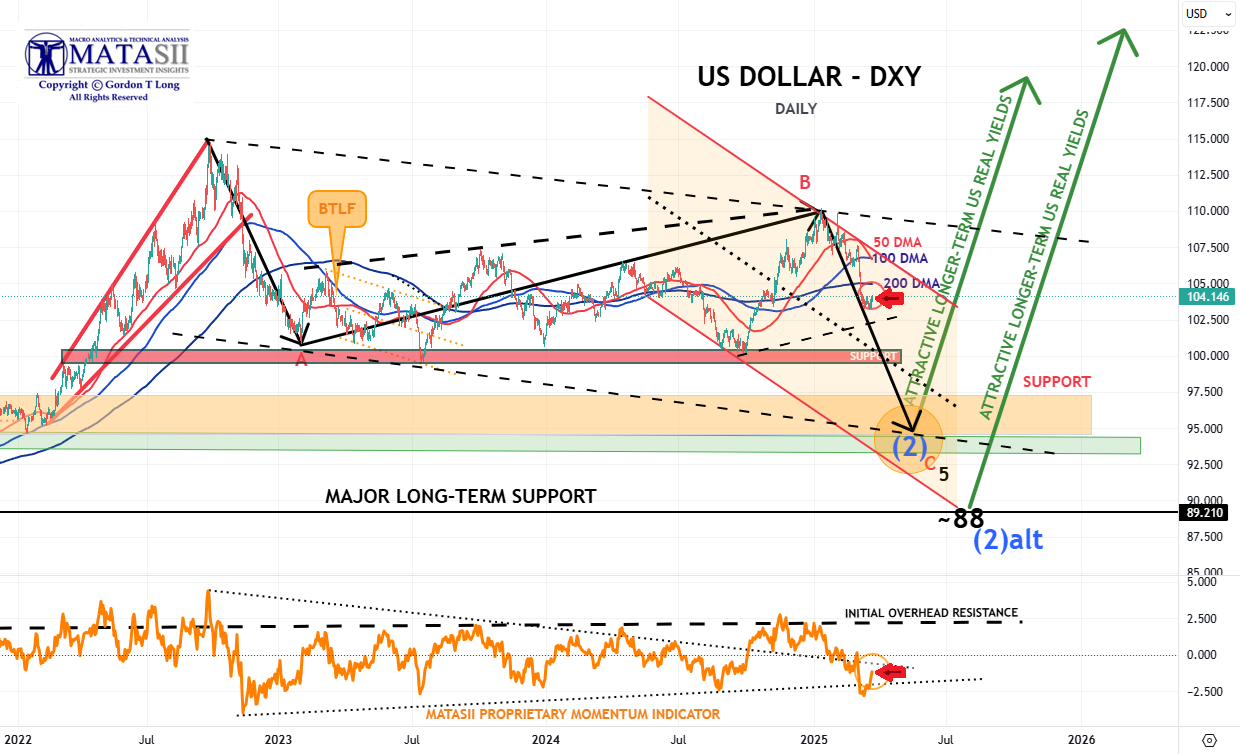
***US DOLLAR - DXY - DAILY***
MATASII CHART NOTES:
-
PRICE - The dollar was up slightly in after hours Friday trading at 104.146 +0.349 (+0.34%)
-
DMA - The 50 DMA isin the process of crossing the 100 DMA to the downside which is quite bearish.
-
MATASII PROPRIETARY MOMENTUM INDICATOR - The dollar has bounce after finding support at the MATASII Momentum Indicators' dotted black trend line marked by the red arrow in the lower panel.
| | | |
IMPORTANT!
THE US ELECTION HAS POTENTIALLY MADE MAJOR CHANGES IN THE PERCEPTION OF THE US$.
THERE IS A STRONG CHANCE THAT THE LOWS SHOWN BELOW ARE
NO LONGER VALID.
| | | |
YOUR DESKTOP / TABLET / PHONE ANNOTATED CHART
Macro Analytics Chart Above: SUBSCRIBER LINK
| | |
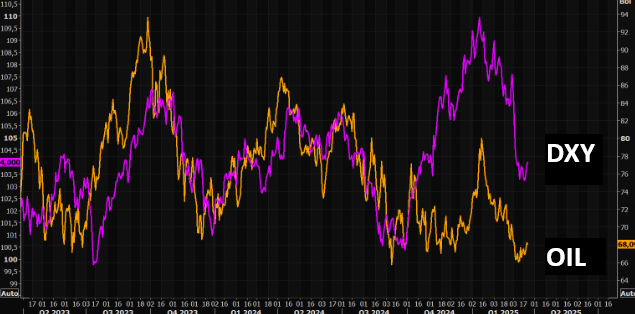
NEW-- CORRELATION - US DOLLAR v OIL
03-21-25
Contrary to popular belief, oil has moved in close tandem vs the DXY over the past years.
The dollar has managed to bounce some in recent sessions.
NOTE: See Gold v Oil Correlation
Time for mean reversion in oil? Despite all the narratives, oil has traded inside a wide range for years. We are in the lower part of the range and attempting to take out that short term trend line.
| | | |
OVERVALUED US DOLLAR
02-21-25
The chart below takes the real-effective exchange for each major currency – its trade-weighted value adjusted for inflation – and looks at its 10-year
Z-score, ie how far above or below it is versus its long-term average. The US REER’s Z-score is second only to Poland’s.
| | | |
OVERVALUED US DOLLAR
02-21-25
Do we have a Head & Shoulders pattern potential? The pattern needs to break the Neckline for confirmation.
| | | |
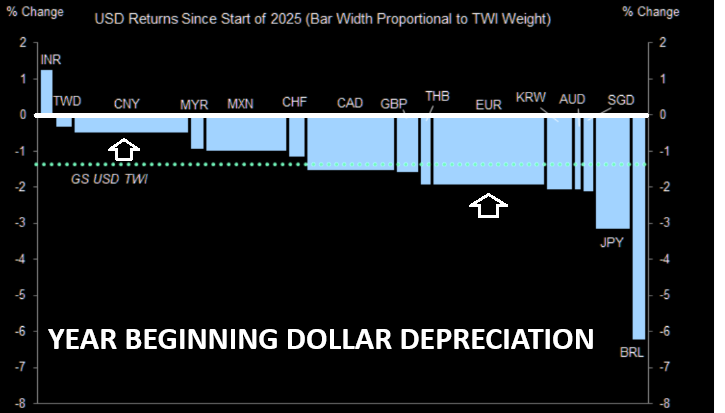
DOLLAR DEPRECIATION - 02-16-25
Modest but broad Dollar depreciation to start the year.
| | | |
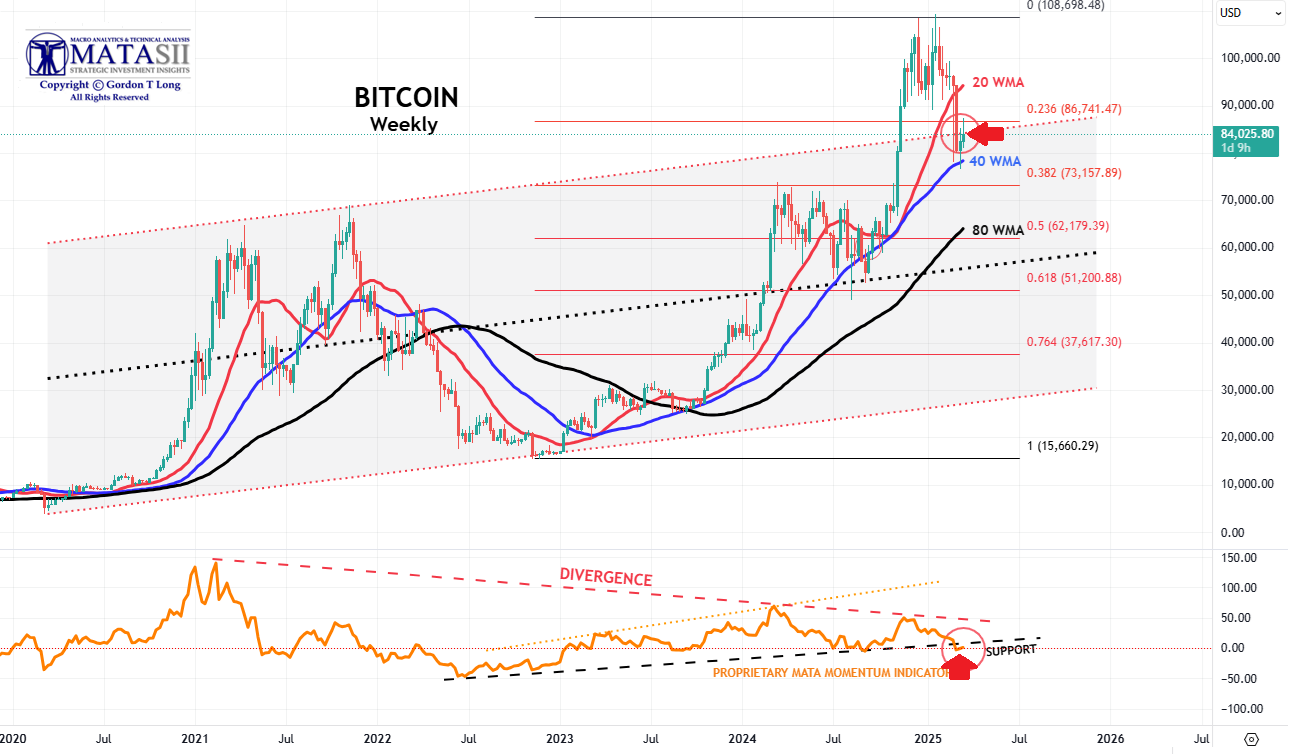
***BITCOIN - BTC - DAILY***
MATASII CHART NOTES:
-
PRICE - Bitcoin was up slightly in after hours Friday trading at 84,029.51 -32.45 (-0.04%).
-
WMA - The DXY appears to need to touch the 40 WMA before moving higher
-
MATASII PROPRIETARY MOMENTUM INDICATOR - Bitcoin found support at the MATASII Momentum Indicators' dashed black trend line marked by the red arrow in the lower panel.
| | | |
MARKET LAB
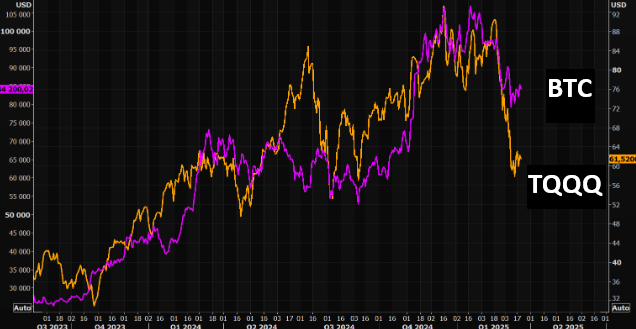
NEW-- CORRELATION - BTC v TQQQ
BTC and TQQQ (3x QQQ) hzv moved in close relationship for a long time, but the latest gap remains "stubbornly" wide.
| | | |
YOUR DESKTOP / TABLET / PHONE ANNOTATED CHART
Macro Analytics Chart Above: SUBSCRIBER LINK
| |
THIS WEEK'S MARKET MONITOR | |
NOTICE Information on these pages contains forward-looking statements that involve risks and uncertainties. Markets and instruments profiled on this page are for informational purposes only and should not in any way come across as a recommendation to buy or sell in these assets. You should do your own thorough research before making any investment decisions. MATASII.com does not in any way guarantee that this information is free from mistakes, errors, or material misstatements. It also does not guarantee that this information is of a timely nature. Investing in Open Markets involves a great deal of risk, including the loss of all or a portion of your investment, as well as emotional distress. All risks, losses and costs associated with investing, including total loss of principal, are your responsibility.
FAIR USE NOTICE This site contains copyrighted material the use of which has not always been specifically authorized by the copyright owner. We are making such material available in our efforts to advance understanding of environmental, political, human rights, economic, democracy, scientific, and social justice issues, etc. We believe this constitutes a ‘fair use’ of any such copyrighted material as provided for in section 107 of the US Copyright Law. In accordance with Title 17 U.S.C. Section 107, the material on this site is distributed without profit to those who have expressed a prior interest in receiving the included information for research and educational purposes. If you wish to use copyrighted material from this site for purposes of your own that go beyond ‘fair use’, you must obtain permission from the copyright owner.
========
| | IDENTIFICATION OF HIGH PROBABILITY TARGET ZONES | |
Learn the HPTZ Methodology!
Identify areas of High Probability for market movements
Set up your charts with accurate Market Road Maps
Available at Amazon.com
| | The Most Insightful Macro Analytics On The Web | | | | |