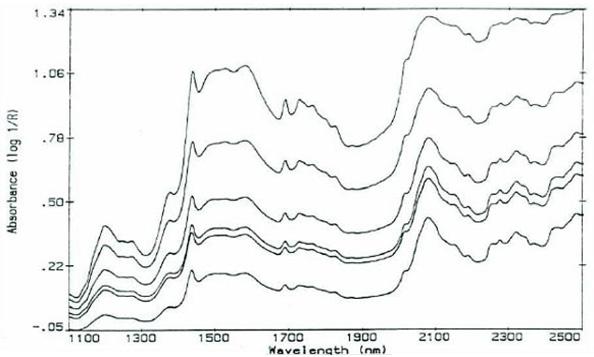
Figure 2. NIR spectra of table sugar at various particle sizes.
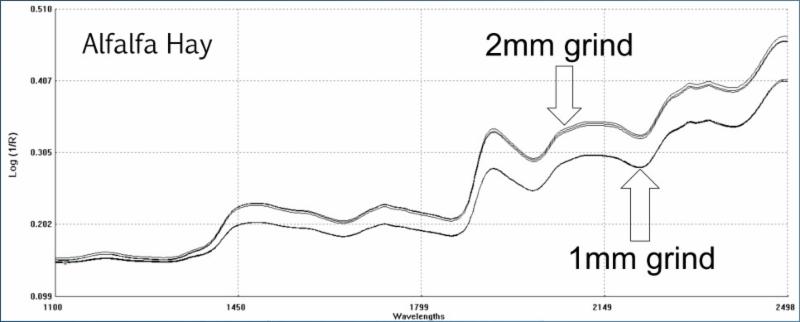
Figure 3. NIR spectra of an alfalfa hay sample ground at 1 or 2mm. The samples were scanned three times at each grind size.
|
Grind size
|
CP,%
|
ADF,%
|
aNDF,%
|
|
1mm
|
21.6
|
31.5
|
39.2
|
|
2mm
|
23.2
|
27.3
|
36.7
|
|
difference
|
-1.6
|
4.2
|
2.5
|
Table 1. Average results for an alfalfa hay sample
scanned at 2 grind sizes.
What about moisture?
There are two very strong moisture bands in the NIR Spectra (1450 & 1940 nm). Figure 4. is the NIR spectra of water. Having two definitive peaks makes NIR a potent tool for moisture determination.
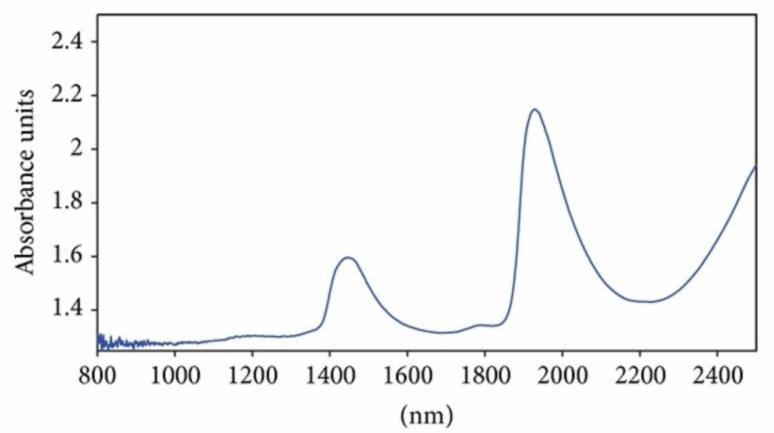
Figure 4. NIR spectra of water
What about the analysis of wet samples?
The cleanest calibrations are based on dried, ground samples that are relatively uniform in both moisture content and particle size. Beyond this, NIR technology is being employed to analyze intact samples in their natural state at the farm. Forage chopper mounted NIR units are used to measure the moisture content of forages as they're being harvested. Some handheld units are also available and a few systems are moving beyond moisture to predict other nutrients. This technology is being used with varying degrees of success. As described in Newsletters 62 & 63, the robustness of the reference database and reference methods employed will directly affect the usefulness of these calibrations.
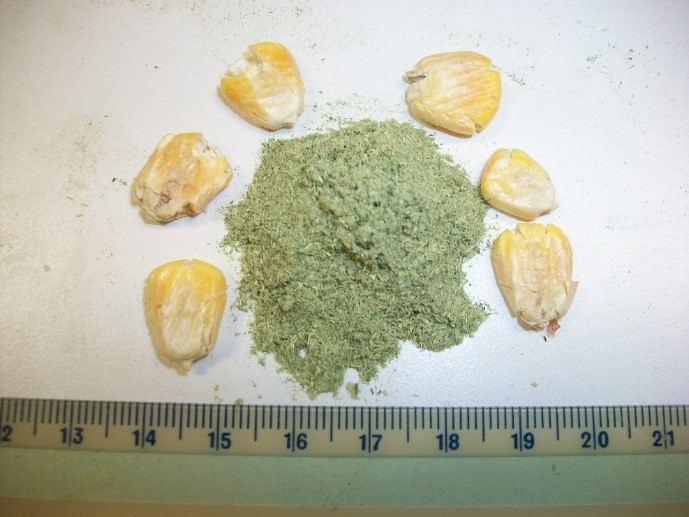
A good example of the challenge of calibrating forages in their natural state is corn silage. Think about it - corn silage is made up of the stalk, leaves, husks, cob and grain - all of which vary in particle size and moisture content (Figure 5.). Corn silage is about as non-homogenous as you can get and this presents a real challenge when trying to develop "wet" calibrations.
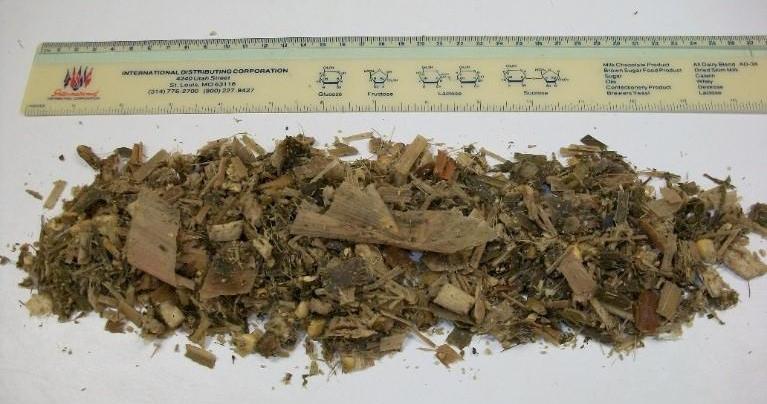
Figure 5. Corn silage and diversity of particle sizes.
To compensate for this, several strategies can be employed:
- As with all sampling, it is imperative that a good, representative sample is presented for analysis.
- The sample size must be large enough to capture the diversity of particles sizes in the intact sample.
- Collecting multiple spectra and compounding the data for predicting results.
- In conjunction with 3, scanning multiple locations across the sample.
For comparison, the analysis of a dried and ground sample is typically conducted in a spinning cup (Figure 6.). During the one minute it takes for analysis, the NIR collects 32 individual readings (spectra) from different sites as the spinning cup passes by the detector. These data are merged together to generate the final results. Note that this is done to smooth the spectra of particle sizes 1mm or less. Thus, you can appreciate the challenge of trying to capture the picture of a sample with much larger and diverse particle sizes. Strategies 1. - 4. must be employed to a greater degree to capture good information from the intact sample. In combination with this, the use of NIR as an on-farm tool will continue to improve with advancements in calibration software and expansion of sample databases.
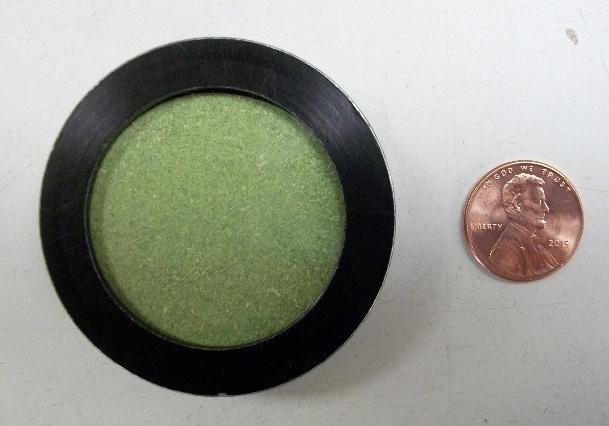
Figure 6. NIR spinning sample cup packed with
1mm ground alfalfa.