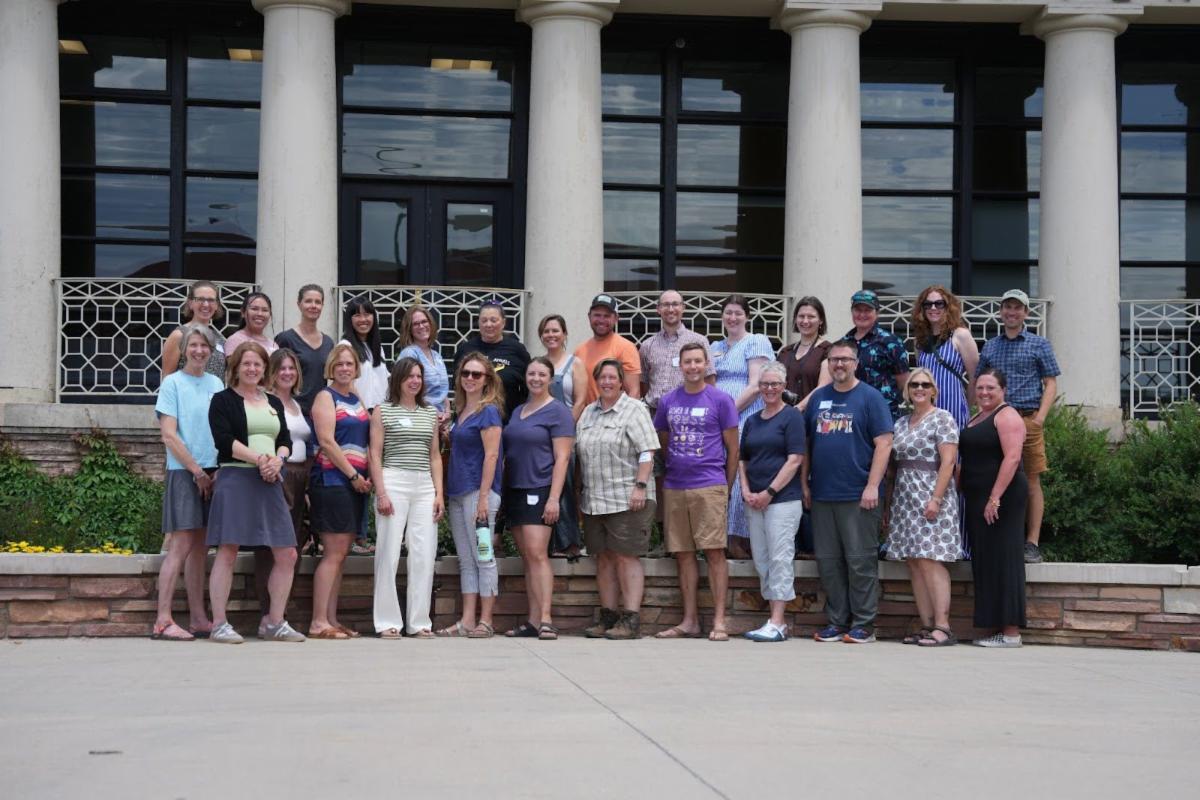
Shout out to the 2025-2026 Data Puzzles Bridge project participants!
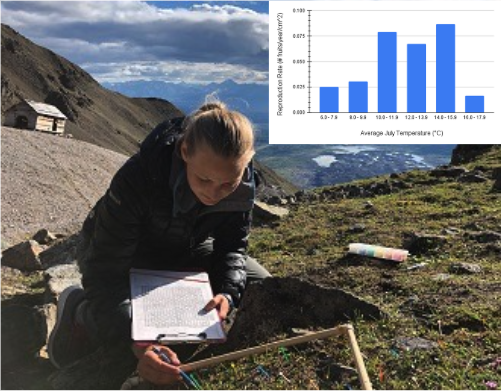
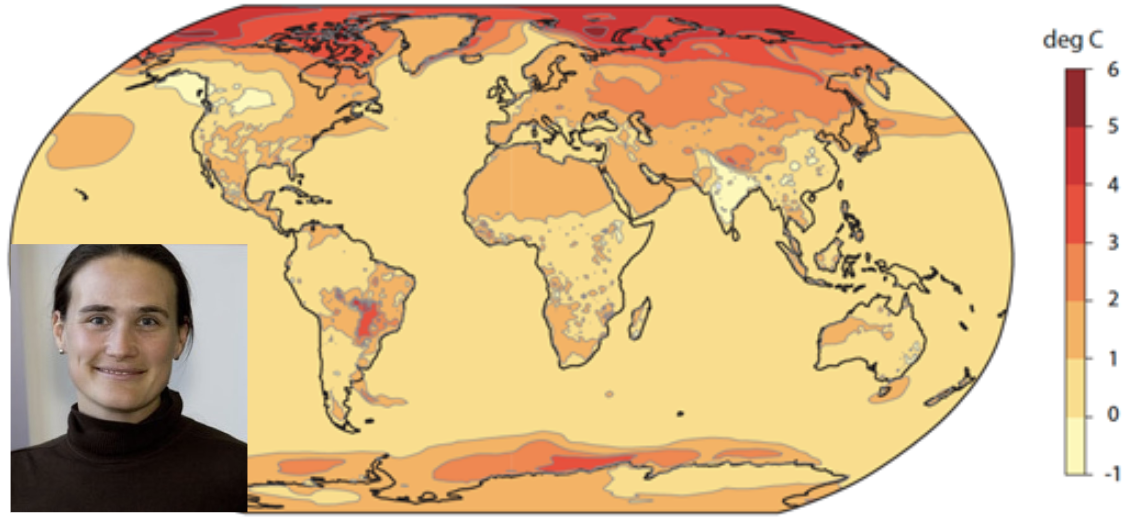
As I sit down to put this newsletter together (and catch my breath from another chaotic daycare drop off), I can't help but reflect on the blur that was this past summer. There was swimming, family parties, playgrounds, and lots of ice cream, but without question the most rewarding part of the summer for me came during the NSF-funded Data Puzzles BRIDGE (Building Research-based Instruction for Data sensemaking in Grades 6–8 Education) project event in Boulder, CO. I'm grateful to have had the opportunity to to lead and learn alongside 19 MS science teacher participants from the Colorado Front Range (pictured above) as part of what will be a year-long effort to use strategies, embedded in Data Puzzle lessons, to support students make sense of real-world data in the context of relevant climate phenomena. For 3-days in June, we explored the Data Puzzles instructional framework and strategies such as slow reveal, notice/think/wonder, and zoom in that have been built into the framework. We reflected on the moves we were making when trying to make sense of different climate data visualizations and constructed models (annotated sketches) to represent the patterns we identified and sought to explain.
These 19 MS science teachers will be implementing various Data Puzzle lessons throughout the 2025-2026 school year, enacting data sensemaking strategies with their students, and sharing with us how their students respond. And me? I'll be building these data sensemaking strategies into new and existing Data Puzzle lessons and sharing them with the broader Data Puzzles community (YOU ALL) via monthly webinars with scientists.
I hope to see you soon!
|