COMING SOON...
2023
LPL FINANCIAL MARKET OUTLOOK
Delivers market insights on what we can expect in the economy, policy, stocks, and bonds for the rest of 2022.
|
|
|
|
Did you see our latest post? |
Never miss a Cornerstone announcement - make sure you are following us on Facebook!
When you follow us you'll get access to up to date market information, helpful financial planning tools like calculators, and all of the Cornerstone office happenings!
Click the button below,
make sure you're logged into your account and follow our Facebook page.
|
|
Cornerstone Fait Accompli
Tchaikovsky based the "voice" of the Sugar Plum Fairy on a new instrument he discovered in Paris: the celesta. The instrument had a clear, bell-like tone with ethereal notes, perfect for the fairy-tale ambiance of "The Nutcracker."
|
|
Despite the S&P 500 Index starting December with five consecutive days of losses, we think December is down but not out. December often starts slow but historically has been a strong month. There are also some potentially supportive seasonal patterns ahead, such as the Santa Claus Rally, the outlook for January following down years, and the third year of the presidential cycle. ‘Tis the season, and this week LPL Research looks at some important seasonal patterns as the year winds down.
SLOW START TO DECEMBER NOT YET BUCKING THE POSITIVE SEASONAL PATTERN
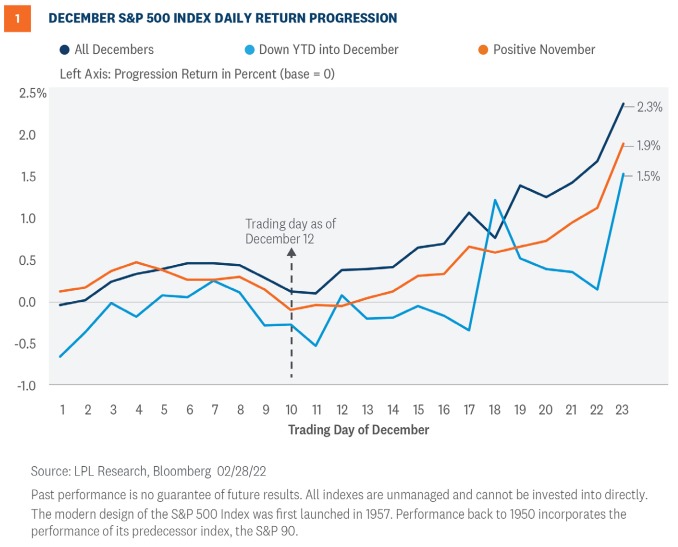
December is off to a rough start, and so far it’s not living up to its seasonal reputation of being one of the best months for equity market returns. Since 1950, the S&P 500 has historically produced average returns of just over 1.5% and has finished the month in positive territory 75% of the time. While the index is down as of Friday, December 9, seasonality trends point to a potential second-half recovery during the month.
As seen in Figure 1, despite the positive seasonal pattern, it’s not unusual for December to get off to a slow start. In fact, we’re near the low point for the historical pattern, and most gains have typically taken place in the second half of the month, although there’s a lot of variation from year to year.
|
|
Figure 1 also highlights some added factors that apply specifically to this year, such as how December looks when we’re down year to date as we enter the month and what December looks like after a positive November. Both factors temper our enthusiasm for December strength, but December remains above average even when taking these factors into account.
SANTA’S HELPER
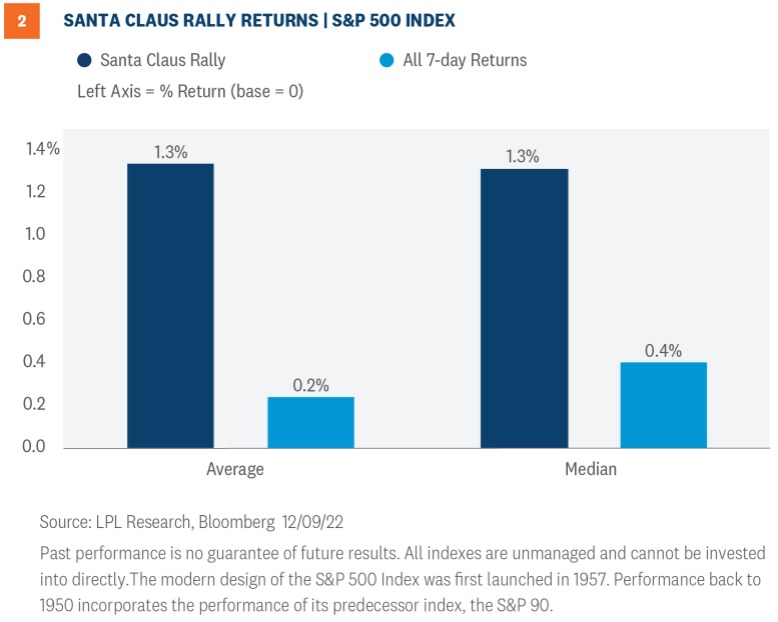
Part of the strong second-half December story is attributable to the market’s tendency to advance during the final trading days of the year and early into the next. This unique seasonal pattern was first discovered by Yale Hirsch in 1972. Hirsch, creator of the Stock Trader’s Almanac, termed the period the “Santa Claus Rally”, which he specifically defined as the last five trading days of the year plus the first two trading days of the new year. The period of just seven trading days is very short, but has historically provided a return comparable to a strong month [Figure 2]. It’s not unusual for stocks to move up (or down) more than one percent even in a single day, but having solid numbers over such a long time period may be meaningful. In any given year, it’s going to be more important factors, such as the economy and the policy environment, that drive returns. However, behind the scenes this period of relatively light volume does seem to provide added support.
|
|
HOW SEASONALITY SETS UP FOR 2023
In the near term, of course, we’re not just thinking about the rest of December—January and potential returns for all of 2023 are also front of mind. Here are some forward-looking patterns we’re paying attention to:
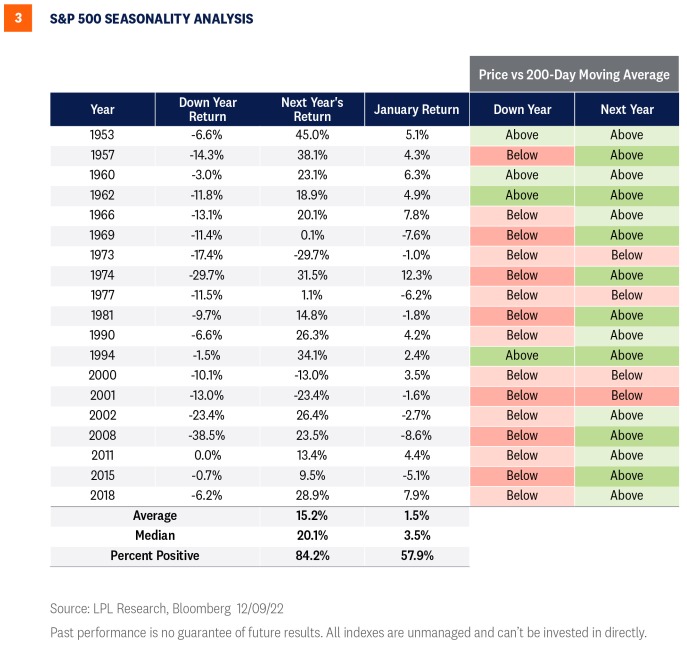
- January returns following a down year historically outperform the average January monthly return for all years going back to 1950 (1.0% on average, 1.5% median).
- Following a down year, the S&P 500 has finished the following year above its 200-day moving average (dma) 79% of the time, compared to down years that only close above the 200-dma 21% of the time.
- The return for the S&P 500 has been above average following a down year, averaging over 15%, but there have been some weak follow-up down years, notably 1974 and 2002.
- We are also entering the third year of the presidential cycle and putting the mid-term election year, the weakest of the cycle historically, behind us. Since 1950, Year Three has averaged 16.8% versus 6.0% for Year Two. The first quarter of Year Three has also been the strongest of the four quarters in the third year.
|
|
AN EARLY HAPPY NEW YEAR
We’re now in the homestretch of 2022. It’s been a challenging year for both stocks and bonds as inflation soared, interest rates climbed, and the Federal Reserve executed one of its most aggressive rate hike campaigns on record. Ultimately, the economy, earnings, and the policy environment drive stock returns, not seasonal factors, but seasonals provide an important backdrop. And right now, the outlook based solely on seasonals is about as supportive is it gets (For our broader market view of 2023, see our Outlook 2023: Finding Balance). But even if only a potential small tailwind, we hope the seasonal outlook helps us put a rough year behind us and gives us reason to say an early Happy New Year.
Adam Turnquist, CMT, Chief Technical Strategist, LPL Financial
Barry Gilbert, PhD, CFA, Asset Allocation Strategist, LPL Financial
|
|
Have you taken advantage of
CAPS
yet?
Don't miss out!
Many of our clients ask how they benefit from taking action and initiating a Financial Plan for themselves.
When you sign up for our CAPS program, you will get access to:
A personalized financial plan, a place to keep all of
your accounts in one location and a secure place to store your
important documents.
|
|
Cornerstone Commentaire
“The nutcracker sits under the holiday tree,
a guardian of childhood stories. Feed him walnuts and he will crack open a tale...”
-Vera Nazarian
|
|
Stay Safe, Stay Kind, Stay Strong, Stay Well
|
|
P.S. Please feel free to forward this commentary to
family, friends, or colleagues.
+++++++++++++++++++++++++++
The highest compliment
you can give us would be the
referral
of your friends or family!
|
|
IMPORTANT DISCLOSURES
This material is for general information only and is not intended to provide specific advice or recommendations for any individual. There is no assurance that the views or strategies discussed are suitable for all investors or will yield positive outcomes. Investing involves risks including possible loss of principal. Any economic forecasts set forth may not develop as predicted and are subject to change.
References to markets, asset classes, and sectors are generally regarding the corresponding market index. Indexes are unmanaged statistical composites and cannot be invested into directly. Index performance is not indicative of the performance of any investment and do not reflect fees, expenses, or sales charges. All performance referenced is historical and is no guarantee of future results.
Any company names noted herein are for educational purposes only and not an indication of trading intent or a solicitation of their products or services. LPL Financial doesn’t provide research on individual equities.
All information is believed to be from reliable sources; however, LPL Financial makes no representation as to its completeness or accuracy.
US Treasuries may be considered “safe haven” investments but do carry some degree of risk including interest rate, credit, and market risk. Bonds are subject to market and interest rate risk if sold prior to maturity. Bond values will decline as interest rates rise and bonds are subject to availability and change in price.
The Standard & Poor’s 500 Index (S&P500) is a capitalization-weighted index of 500 stocks designed to measure performance of the broad domestic economy through changes in the aggregate market value of 500 stocks representing all major industries.
The PE ratio (price-to-earnings ratio) is a measure of the price paid for a share relative to the annual net income or profit earned by the firm per share. It is a financial ratio used for valuation: a higher PE ratio means that investors are paying more for each unit of net income, so the stock is more expensive compared to one with lower PE ratio.
Earnings per share (EPS) is the portion of a company’s profit allocated to each outstanding share of common stock. EPS serves as an indicator of a company’s profitability. Earnings per share is generally considered to be the single most important variable in determining a share’s price. It is also a major component used to calculate the price-to-earnings valuation ratio.
All index data from Bloomberg.
This research material has been prepared by LPL Financial LLC.
Securities and advisory services offered through LPL Financial (LPL), a registered investment advisor and broker-dealer (member FINRA/SIPC). Insurance products are offered through LPL or its licensed affiliates. To the extent you are receiving investment advice from a separately registered independent investment advisor that is not an LPL affiliate, please note LPL makes no representation with respect to such entity.
Not Insured by FDIC/NCUA or Any Other Government Agency | Not Bank/Credit Union Guaranteed | Not Bank/Credit Union Deposits or Obligations | May Lose Value
RES-1356800-1222 | For Public Use | Tracking # 1-05350987 (Exp. 12/2023)
The information contained in this email message is being transmitted to and is intended for the use of only the individual(s) to whom it is addressed. If the reader of this message is not the intended recipient, you are hereby advised that any dissemination, distribution, or copying of this message or content is strictly prohibited. If you have received this message in error, please immediately delete.
Securities and Advisory Services offered through LPL Financial, a Registered Investment Advisor. Member FINRA / SIPC .
|
|
|
|
|
|
|