|
The 2025 OUTLOOK is HERE!
In case you missed it, make sure to take a look at the...
2025 Outlook: Pragmatic Optimism
**IMPORTANT DISCLOSURES
This material is for general information only and is not intended to provide specific advice or recommendations for any individual. The economic forecasts may not develop as predicted. Please read the full OUTLOOK 2025: Pragmatic Optimism publication for additional description and disclosure. This research material has been prepared by LPL Financial LLC.
| | Fait Accompli \fe takɔ̃ˈpli\ noun: an accomplished fact; a thing already done | | |
Cornerstone Fait Accompli
Easter is Sunday, April 20th. From brunch to egg dyeing to church service, there are an abundance of exciting ways to celebrate the holiday. However, Easter egg hunts are the most beloved! A recent study shows that 83% of people participate in the fun, family activity come Easter Sunday.
| | This statement is a testimonial by a client of the financial professional as of 8/17/23. The client has not been paid or received any other compensation for making these statements. As a result, the client does not receive any material incentives or benefits for providing the testimonial. These views may not be representative of the views of other clients and are not indicative of future performance or success. | | | | Did you see our latest post? | |
Never miss a Cornerstone announcement - make sure you are following us on Facebook!
When you follow us you'll get access to up to date market information, helpful financial planning tools like calculators, and all of the Cornerstone office happenings!
Click the button below,
make sure you're logged into your account and follow our Facebook page.
| | Click on the buttons below and don't forget to like, comment and share our posts! | | |
Last week we were able to check several of the boxes on our stock market bottoming process checklist. Panic-level fear in investor surveys? Check. Volatility and volume spikes consistent with prior major market lows and capitulation? Check. Washed out levels of breadth? Check. Indiscriminate selling pressure followed by a massive up day when nearly every stock was higher? Check. Better tariff headlines? Yes, but…half check. The 90-day pause on the higher tariff rates helps, as do technology exemptions announced over the weekend, but massive tariff rates on China (now 145%? It’s hard to keep track) and the fact that we could be back in the same place in early July still with higher tariff rates is uncomfortable. And during big market drawdowns, retests of the initial lows are common. So, get your buy orders ready, but be open to the idea of more near-term downside.
Wild Week
This week was one of the most volatile weeks in the history of the stock market. That excludes the historic two-day decline on Thursday and Friday the week before (April 3–4). The S&P 500 dropped 1.6% on Tuesday, April 8, surged 9.5% on Wednesday, April 9 (the third biggest up day since 1950), fell 3.5% on Thursday, April 10, and jumped 1.8% on Friday, April 11. The S&P 500 ended up nearly 6% for the week. Quite a ride.
A number of elements we were waiting for to indicate stocks had put in a durable low have been realized in terms of panic and fear. But as we think about potentially adding equities and going overweight, a few things give us pause:
Trade tensions with China show no signs of cooling
We haven’t seen any trade deals yet
Earnings visibility remains limited because we don’t know where non-China tariffs might land. Retests after big downdrafts are common
Valuations are not attractive after stocks surged on April 9, especially at elevated interest rate levels
What the Charts Tell Us About Whether Lows Are In
“Rollercoaster” is not a technical term, but it is probably the best adjective to describe price action across equity markets last week. The S&P 500 swung from a low of 4,835 to a high of 5,481, equating to over a 10% intraweek trading range that rivals the sharp price swings of March 2020. The volatility has been so dramatic that we chose not to have our designers put in a chart of the S&P 500 in this commentary because it could be off by 5% by the time it’s published.
By the time the dust finally settled on Friday, the index came out well ahead for the week and finally made some notable technical progress. Bulls stepped up and defended an uptrend dating back to the pandemic-era lows, an area of support that coincidentally overlaps near the 2022 highs (4,800) and a key retracement level (4,820) of the bull market run. (If the market resumes its decline, this area will be key for the S&P 500 to hold.)
Signs of a capitulation were evident last week as momentum and breadth indicators reached levels commensurate with other major turning points in equity markets. Sentiment gauges also checked the box for peak fear likely being reached. The CBOE Volatility Index (“VIX”) spiked to 60 early last week, while equity market put/call ratios (a measure of bearish put options or hedges on stocks relative to bullish call options) jumped to statistically high readings — suggesting it may be time to consider a contrarian view and start thinking about what could go right.
Along those lines, we can now finally start flagging resistance levels for the S&P 500, which include the September lows near 5,400 and the 20-day moving average (dma)/March lows in the 5,514–5,520 range. This doesn’t allow for much upside for stocks if we drift higher on no news. A break above these levels likely requires some more big news on tariffs and trade.
While there has been some recent technical progress, we recognize uncertainty and risks remain high, but argue it comes with the territory of any major market low. The weight of the technical evidence suggests the broader market has reached capitulation levels. This doesn’t imply stocks will immediately shoot higher or that the period of high volatility is over. Furthermore, if we do get a recovery, watch for a shift toward cyclical leadership and a notable breadth expansion to accompany any advance (along with tech sector participation and a return of institutional demand).
We also acknowledge that identifying a major low is more art than science. Often times, bottoming is a process that includes a retest of the initial lows, but we remain open-minded to the potential for a V-shaped recovery, as was the case in 2020 and 2018.
Earnings May Not Help Stocks Much
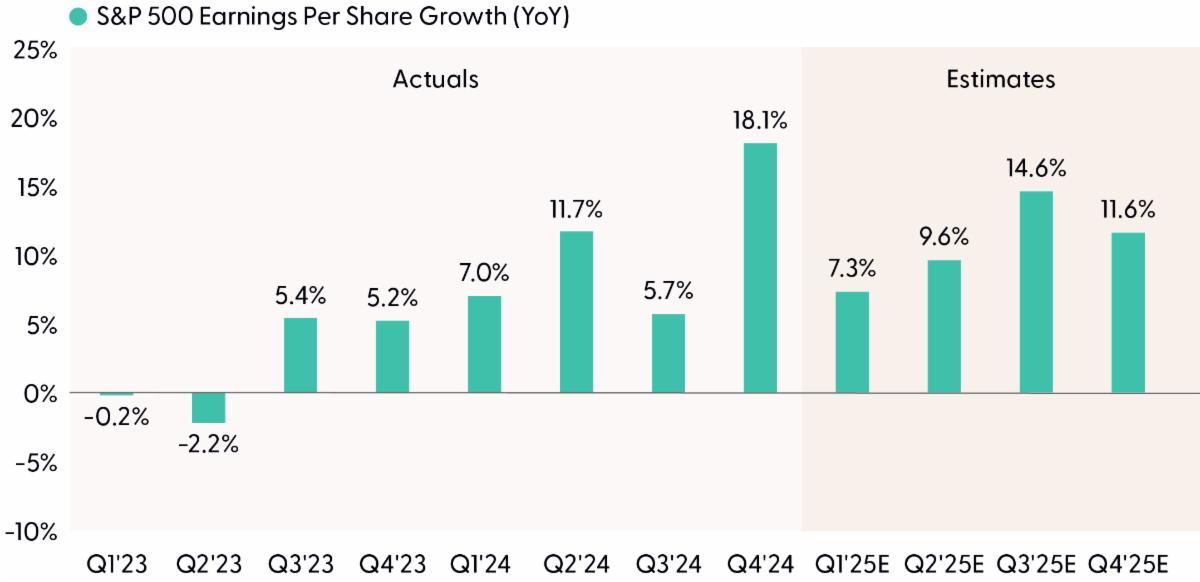
Banks kicked off earnings season last week and we, and just about everyone else, are thinking two things. First, the numbers won’t matter because tariff headlines will dominate. And second, companies have so little visibility that they will give vague guidance, if they give any guidance at all. So, we’ll show you the expected earnings growth numbers for the first quarter because analysts must publish them. But we hesitate to include any estimates. The only thing we are confident in is that estimates are too high for the rest of the year, so expect consensus to drop a few dollars from $267 as companies report. What big tech companies say about capital investment will be interesting.
Earnings Estimates Are Too High for Current Tariff Regime in Economic Slowdown
| | |
Source: LPL Research, FactSet 04/10/25
Disclosures: Indexes are unmanaged and cannot be invested in directly. Estimates may not develop as predicted and are subject to change.
The big banks and brokers did get the reporting season off to a good start with solid beats on the bottom line. However, comments about the outlook were generally what we expected to hear. Commentary centered on uncertainty and a challenging economic environment, with some increased reserves against future loan losses. Good first quarter numbers are better than the alternative, but banks and the rest of corporate America need to have a better idea of where this trade situation settles out before they, and therefore we, can have any confidence in the outlook for the rest of the year.
What To Do With Our S&P 500 Year-End Target?
With little visibility into where tariff rates shake out and the effects on earnings, it’s hard to have much conviction in a year-end S&P 500 target. As such, we’re taking a brief pause in that exercise but expect to come back with a new range very soon (our latest range was 6,275–6,375, which was below consensus at the start of the year but now is probably too high).
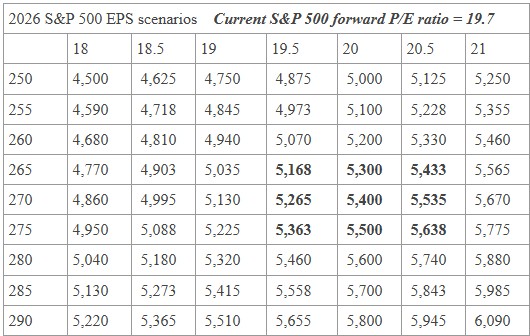
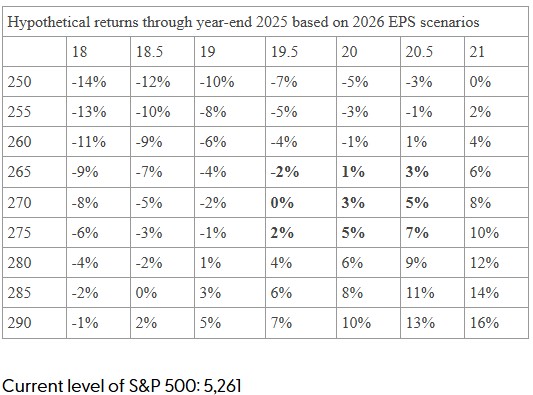
The “Tariff Drag Offsets AI and Productivity Boost to Earnings” table offers scenarios that we believe are reasonable ranges to consider for 2026 earnings, which we use to set year-end 2025 targets for the index, and price-to-earnings ratios (P/E). The bolded numbers indicate where we currently believe fair value might be at year end, barring new tariff updates. With the S&P 500 well above its sub-5,000 close on April 8, upside may be more limited, especially if the aforementioned technical resistance levels slightly above 5,500 hold. Higher interest rates will also likely weigh on valuations (more on that later). In other words, the risk-reward is somewhat balanced right now, so we’re not pounding the table to add equities here.
Tariffs are clearly a drag on earnings this year, if they stick. But don’t forget about the upside potential from corporate America’s continued strong investment in artificial intelligence (AI) capabilities and the resulting productivity gains that can be achieved. That suggests thinking about earnings in the $250–$255 range for this year and potentially $270 or even higher in 2026 if tariff rates shake out in the low teens (or lower) and recession is avoided, which remains our base case even though the odds of a recession starting this year may be approaching 50% at this point.
Tariff Drag Offsets AI and Productivity Boost to Earnings
Year-end S&P 500 fair-value target scenarios
| | |
Source: LPL Research, FactSet, 04/10/25
Disclosures: Indexes are unmanaged and cannot be invested in directly. Estimates may not develop as predicted and are subject to change.
Even With Optimistic Earnings Assumptions, Valuations Still Aren’t Compelling
We say it all the time — valuations aren’t good timing tools. But in volatile markets when we’re trying to gain some confidence a low might be in and assess potential upside, they can be helpful. Therein lies the problem with making a high-conviction bullish call right now.
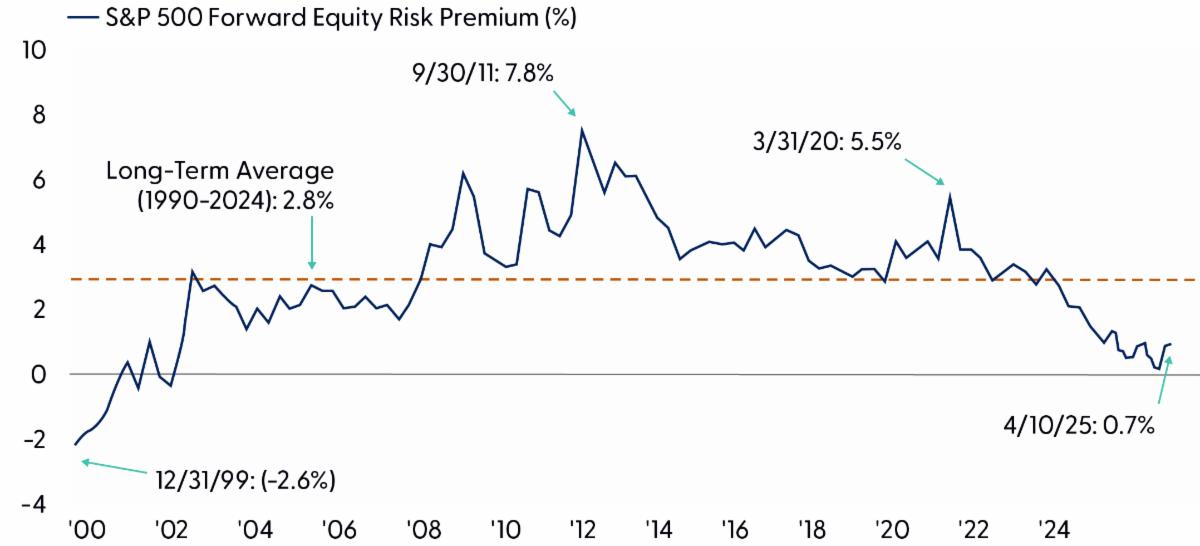
The equity risk premium (ERP) on the S&P 500, which compares stock valuations to bond yields, remains well below average at 0.7% as noted in the “Stock Valuations are Elevated Relative to Bonds” chart. For example, a 20 forward P/E and a 5% 10-year Treasury yield are equivalent valuations. We’re approaching 5%, but thankfully still below it, and the S&P 500 P/E, at 19, is slightly below 20, but not by much.
So, we’re getting a small premium to take on the risk associated with equities, but it’s not compelling. The average ERP since 1990 is 2.8%, and it has been much higher during prior periods of stock market weakness because yields were lower. So, to get this market much higher, we need not just trade policy clarity but also lower interest rates. Treasury Secretary Scott Bessent is targeting lower yields, which is reassuring for markets to an extent, but success thus far has been limited. Tariff-driven inflation keeps the Federal Reserve (Fed) in a tough spot, so they may not help much. Justifying a P/E above 20 in this environment is tough.
Stock Valuations Are Elevated Relative to Bonds
Higher yields reduce the equity risk premium for stocks, offering little compensation for the risk
| | |
S&P 500 equity risk premium is the S&P 500 earnings yield (earnings divided by price) minus the U.S. 10-year Treasury yield. Earnings are forward 12-month estimates.
Source: LPL Research, FactSet, Refinitiv, 04/10/24
Disclosures: All indexes are unmanaged and cannot be invested in directly. Past performance is no guarantee of future results.
We found a recent study by Evercore ISI’s Research team using valuations very interesting. When more than 80% of S&P 500 constituents are trading below their five-year average P/E ratios, it marked major lows since 2018 (2018, 2020, 2022, 2023). Gains off those lows were very strong, and this statistic reached 78% last week. Something to watch that suggests maybe valuations at the stock level can be good timing tools and indications of a broad washout selling episode.
Perspective on Volatility
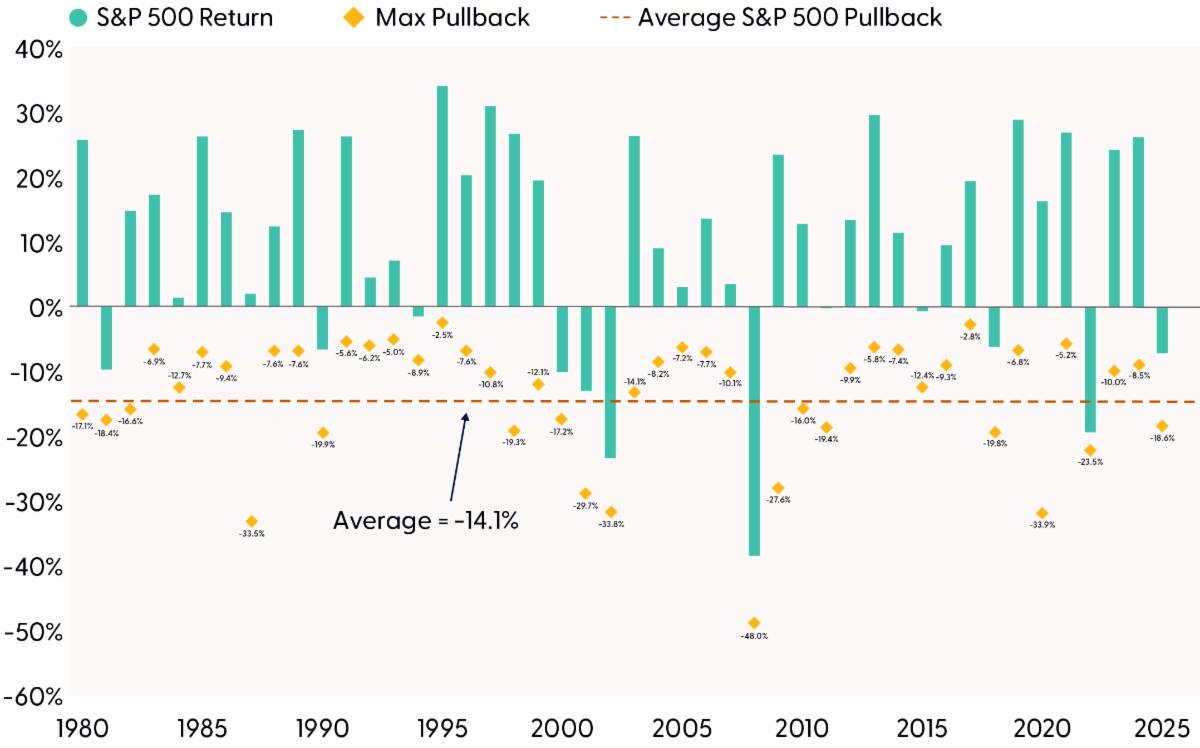
Whenever the stock market is volatile, we think it’s helpful for investors to study market history. To help, we have included one of our favorite charts. The “Big Drawdowns Turning Into Annual Gains Is Not Very Unusual” chart highlights the maximum drawdown in each year (diamond markers, average is 14%) and compares those drawdowns to annual returns (aqua colored bars, average +10%).
When the annual drawdown is between 10–20%, the average gain for the S&P 500 is 8.6%, and the median is 3.5%, but the index is higher just 60% of the time. Three of those down years were around recessions (1981, 1990, and 2000). The others (2015 and 2018) saw modest annual price declines.
So, is an up year still possible? We think so, if trade tensions die down. Though not comparable to today, the most dramatic example of a turnaround is in 2020 (a 34% sell-off and 16% gain for the year). How about 1998 (19% drawdown, 27% gain)? That amount of upside from here seems unrealistic. Maybe 2011 (19% drawdown, flat year)? If tariffs come down, we think stocks can do better than that. How about 2010 (down 16%, up 13%) or 1982 (17% drawdown, 15% gain)? Maybe aggressive on the upside but helps illustrate that drawdowns can be overcome.
An up year is less than 10% away and within reach. But a double-digit year is probably a stretch.
Big Drawdowns Turning Into Annual Gains is Not Very Unusual
| | |
Source: LPL Research, FactSet 04/11/25
Disclosures: All indexes are unmanaged and cannot be invested in directly. Past performance is no guarantee of future results.
Conclusion
There’s a decent chance the bottom is in after the S&P 500 traded down to 4,835 last Monday. Evidence of a washout, fear-driven, waterfall decline is abundant. But following the sharp rally off those lows on Wednesday after President Trump put a pause on high tariff rates, the risk-reward trade-off doesn’t look all that compelling. Several things still give us pause, including the intensifying trade war with China, uncertainty about where non-China tariffs will land, and the possibility that stocks will retest recent lows. Further, valuations are not compelling given higher interest rates and lower earnings because of the tariffs. So, get your buy tickets ready, but we’d feel better about buying on another wave of weakness than in the 5,300 range.
That said, while uncertainty remains high and will likely remain so in the near term, disciplined investors will recognize that moments of excessive fear often set the stage for future returns. Markets, by their nature, eventually stabilize, and those who can look past the short-term should be well-rewarded in the longer term.
| | Etymology /edəˈmäləjē/ noun: the origin of a word and the historical development of its meaning. | | |
April is financial literacy month!
January Effect: The January effect is the name given to the belief in a seasonal increase in stock prices in the first month of each year. People have generally attributed a supposed rally each January to the rise in buying that follows the price drop that typically happens each December. However, data for this phenomenon over the last several decades has proven inconclusive.
| | |
Have you taken advantage of
CAPS
yet?
Don't miss out!
Many of our clients ask how they benefit from taking action and initiating a Financial Plan for themselves.
When you sign up for our CAPS program, you will get access to:
A personalized financial plan, a place to keep all of
your accounts in one location and a secure place to store your
important documents.
Click Here to Learn More
| | Le commentaire \ˈkɒmɛnt\ masculine noun: a French word meaning a remark or comment | | |
Cornerstone Commentaire
“Money never made a man happy yet, nor will it. The more a man has, the more he wants. Instead of filling a vacuum, it makes one.”
— Benjamin Franklin
| | Stay Safe, Stay Kind, Stay Strong, Stay Well | | |
P.S. Please feel free to forward this commentary to
family, friends, or colleagues.
+++++++++++++++++++++++++++
The highest compliment
you can give us would be the
referral
of your friends or family!
| | |
The information contained in this email message is being transmitted to and is intended for the use of only the individual(s) to whom it is addressed. If the reader of this message is not the intended recipient, you are hereby advised that any dissemination, distribution, or copying of this message or content is strictly prohibited. If you have received this message in error, please immediately delete.
Information and interactive calculators are made available to you as self-help tools for your independent use and are not intended to provide investment, tax, or legal advice. We cannot and do not guarantee their applicability or accuracy in regards to your individual circumstances. All examples are hypothetical and are for illustrative purposes. We encourage you to seek personalized advice from qualified professionals regarding all personal finance issues.
Securities and advisory services offered through LPL Financial (LPL), a registered investment advisor and broker-dealer (member FINRA/SIPC). Insurance products are offered through LPL or its licensed affiliates. To the extent you are receiving investment advice from a separately registered independent investment advisor that is not an LPL affiliate, please note LPL makes no representation with respect to such entity.
Important Disclosures
This material is for general information only and is not intended to provide specific advice or recommendations for any individual. There is no assurance that the views or strategies discussed are suitable for all investors or will yield positive outcomes. Investing involves risks including possible loss of principal. Any economic forecasts set forth may not develop as predicted and are subject to change.
References to markets, asset classes, and sectors are generally regarding the corresponding market index. Indexes are unmanaged statistical composites and cannot be invested into directly. Index performance is not indicative of the performance of any investment and do not reflect fees, expenses, or sales charges. All performance referenced is historical and is no guarantee of future results.
Any company names noted herein are for educational purposes only and not an indication of trading intent or a solicitation of their products or services. LPL Financial doesn’t provide research on individual equities.
All information is believed to be from reliable sources; however, LPL Financial makes no representation as to its completeness or accuracy.
All investing involves risk, including possible loss of principal.
U.S. Treasuries may be considered “safe haven” investments but do carry some degree of risk including interest rate, credit, and market risk. Bonds are subject to market and interest rate risk if sold prior to maturity. Bond values will decline as interest rates rise and bonds are subject to availability and change in price.
Mortgage-backed securities are subject to credit, default, prepayment, extension, market and interest rate risk. Because of their narrow focus, investments concentrated in certain sectors or industries will be subject to greater volatility and specific risks compared with investing more broadly across many sectors, industries, and companies.
Because of their narrow focus, investments concentrated in certain sectors or industries will be subject to greater volatility and specific risks compared with investing more broadly across many sectors, industries, and companies.
The Standard & Poor’s 500 Index (S&P500) is a capitalization-weighted index of 500 stocks designed to measure performance of the broad domestic economy through changes in the aggregate market value of 500 stocks representing all major industries.
The PE ratio (price-to-earnings ratio) is a measure of the price paid for a share relative to the annual net income or profit earned by the firm per share. It is a financial ratio used for valuation: a higher PE ratio means that investors are paying more for each unit of net income, so the stock is more expensive compared to one with lower PE ratio.
Earnings per share (EPS) is the portion of a company’s profit allocated to each outstanding share of common stock. EPS serves as an indicator of a company’s profitability. Earnings per share is generally considered to be the single most important variable in determining a share’s price. It is also a major component used to calculate the price-to-earnings valuation ratio.
All index data from FactSet or Bloomberg.
This research material has been prepared by LPL Financial LLC.
| |
For public use.
Member FINRA/SIPC.
RES-0003080-0225 Tracking #702857 | #702858 (Exp. 03/26)
Securities and Advisory Services offered through LPL Financial, a Registered Investment Advisor. Member FINRA / SIPC .
Privacy Policy | LPL.com
| | | | |