What 11 Years of Fee-Simple House Contracts Reveal about Presidential Elections, Midterms and the Uncertainty that Makes Buyers Hesitate. | | Does the Election Cycle Really Affect Real Estate Activity in Washington, DC? | | |
Every election season, I hear a familiar refrain: “Let's wait until after the election.” Buyers wonder what will happen to interest rates, the economy and their jobs. Sellers ask whether they should postpone listing.
In Washington, where federal policy and employment are closely intertwined with everyday life, the questions can feel especially urgent. But what does the housing data actually show?
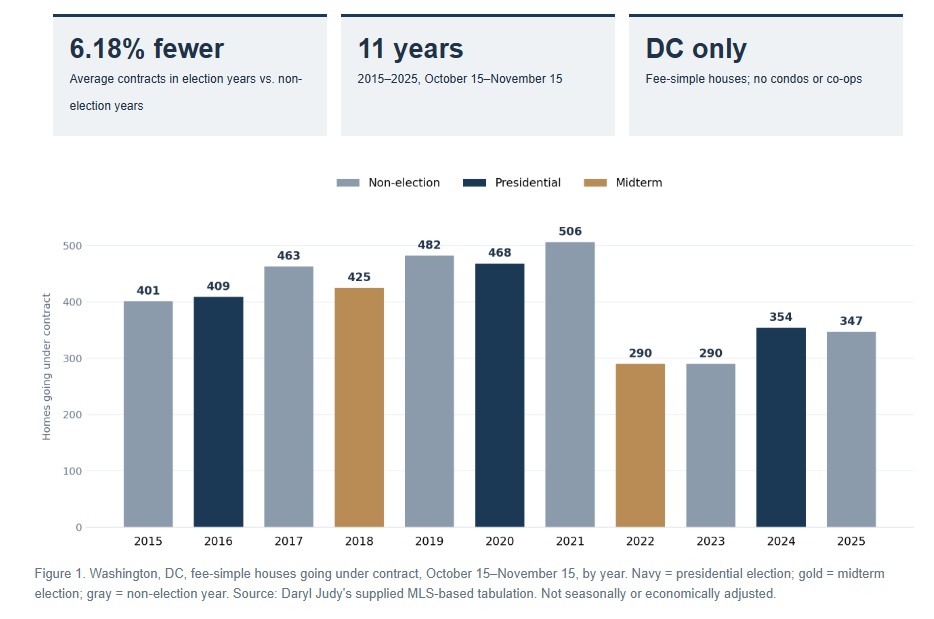
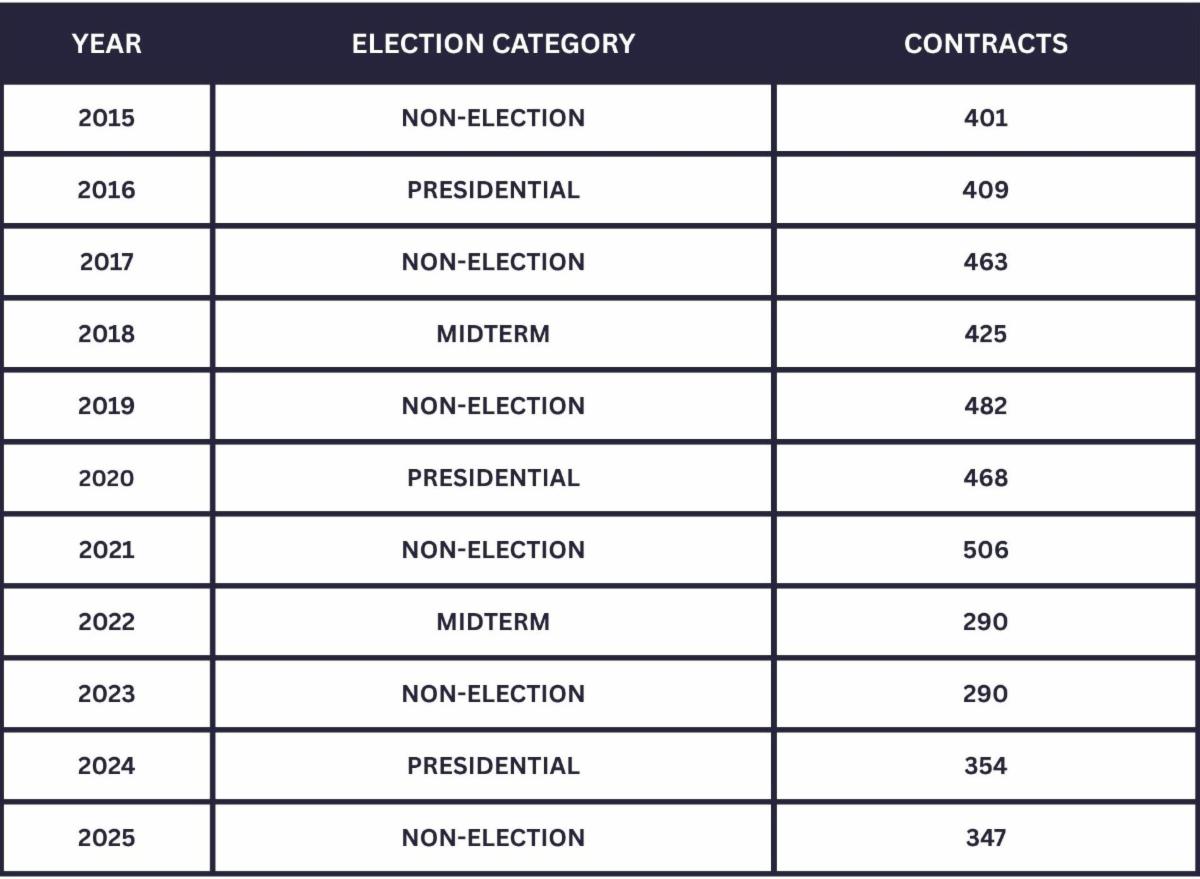
| I analyzed 11 consecutive years of Washington, DC, fee-simple house contracts, using the same October 15–November 15 window in each year. The analysis excludes condominiums and cooperatives and does not include suburban Maryland or Northern Virginia. What I found surprised me: election year averaged just over 6% fewer contracts than non-election years—less of a difference than I expected. | | Are Fewer DC Houses Contracted During the Election Years? | | Yes, in this particular 2015–2025 sample, the five presidential and midterm election years averaged 389.2 fee-simple house contracts, compared with 414.8 during the six years without a presidential or congressional midterm election. That's 6.18% fewer contracts on average. It's a descriptive comparison, not proof that elections caused the difference. Each year's market also reflected its own inventory, mortgage rates, affordability and economic conditions. | What are the Year-By-Year DC Fee-Simple House Contract Figures? | Methodology: 11 annual observation windows, October 15–November 15 inclusive, 2015–2025, Washington, DC, fee-simple houses only. Excludes condominiums and cooperatives. Counts represent properties going under contract, not completed closings. Election years: 2016, 2018, 2020, 2022 and 2024. Non-election years: 2015, 2017, 2019, 2021, 2023 and 2025. Mean election-year count = 389.2; mean non-election-year count = 414.83; relative difference = 6.18%. Source workbook provided by Daryl Judy; underlying MLS extraction parameters should be independently confirmed before external press distribution. | Do Presidential Elections Slow DC Home Sales More Than Midterms? | Not in a simple or consistent way. The three presidential election years—2016, 2020, and 2024—averaged 410.3 contracts, only 1.1% below the non-election-year average. The two midterm years, 2018 and 2022, averaged 357.5, but their individual totals were very different: 425 and 290. Two midterms are far too few to establish a reliable pattern. The result illustrates why grouping every election together can conceal important differences. | | Why Does Uncertainty Make Homebuyers and Sellers Hesitate? | | |
I often tell clients that uncertainty is one of the most powerful influences on decision-making. It can concern an election, a relationship, a job, the stock market or personal finances. When people cannot see what comes next, they sometimes pause. That's understandable when buying or selling a home is such a consequential decision.
But a feeling of uncertainty isn't the same as a completed—or canceled—transaction. A Buyer can be nervous and still purchase a home. A Seller can be concerned and still secure an excellent offer. That's why I pay attention to both sentiment and measurable activity.
| | |
Are Homebuyers Actually Waiting
Until After Election Day?
| | |
Some are. In a 2024 Redfin/Ipsos survey, 23% of prospective First-time Buyers planning to buy within a year said they were waiting until after the presidential election. Yet Redfin also reported that national pending sales rose 4.5% year over year during the four weeks ending October 27, 2024.
These are different measures and populations, but together they show why Buyer intentions should not be mistaken for market-wide transaction results. Redfin research and housing reports provide useful national context; my contract counts measure only Washington, DC, fee-simple houses.
| | Is Washington, DC Different from the Rest of the Country During an Election? | | |
Potentially. Federal jobs, political appointments, government contracting and policy-related relocations can create uncertainty for some households and new housing needs for others.
Earlier National Association of Realtors research examining the broader DC metropolitan area found increased sales during the November-to-March period surrounding presidential transitions. That study covered a different geography and time window, so it is not directly comparable to my findings. It does reinforce the importance of distinguishing pre-election hesitation from post-election relocation activity.
| | Is the DC Housing Market Slowing Ahead of the 2026 Midterms? | | In my day-to-day work, parts of the market feel noticeably slower as the 2026 election approaches. I'm seeing more hesitation in some Buyer conversations and less showing activity on certain properties. Those are valuable early indicators, but they are not yet a completed year-over-year comparison for the October 15 – November 15 window. | | What Does 11 Years of Washington, DC Housing Data Really Tell Us? | | |
It tells us to question assumptions. Election uncertainty may affect confidence and the timing of decisions, but it does not bring the DC fee-simple housing market to a halt.
And the presidential-year comparison is far closer to normal than the overall election-year headline suggests. Going into this analysis, I expected a much larger difference. The numbers challenged that expectation. That is exactly why I do the research. In real estate, confidence should come from information—not assumptions.
| | | | |
Follow @DarylJudy for the Most
Up-to-Date Information
| | |
CLIENTS BECOME FRIENDS
&
FRIENDS BECOME FAMILY
| | | | |