Global Regions with Worsening Snow Droughts
New NIDIS-Supported Research Shows Prolonged Snow Droughts in the Western US, Eastern Russia, and Europe
|
|
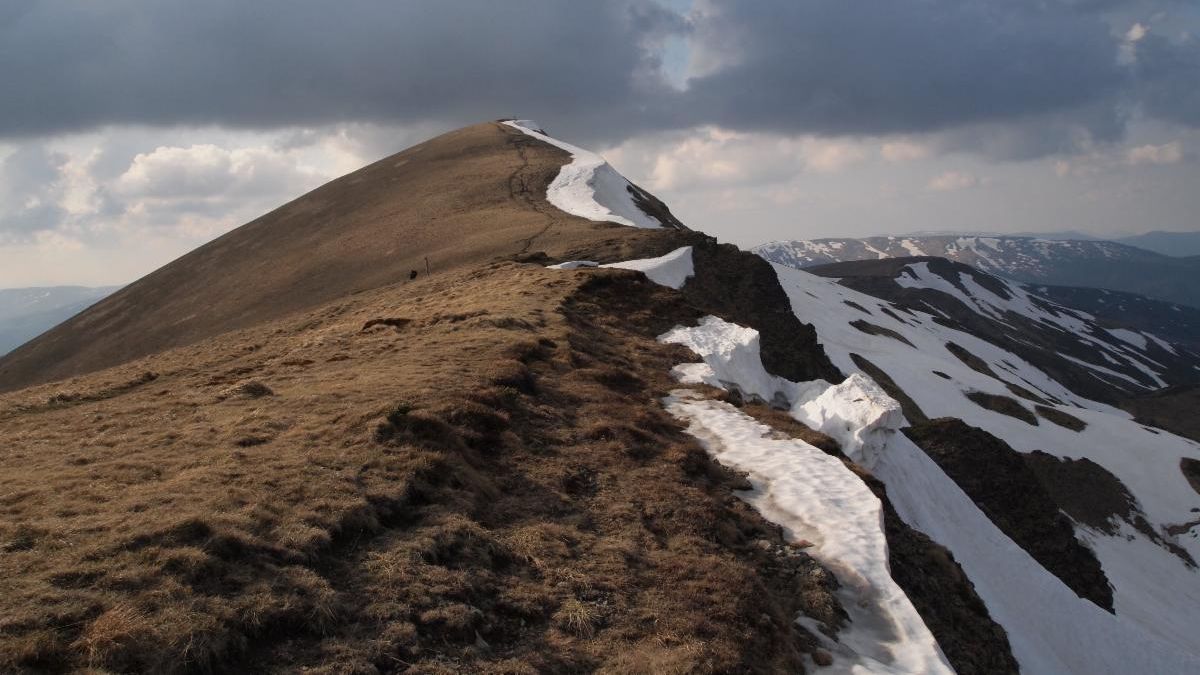
While snow drought isn't normally on people's minds in mid-summer, deficits in snowmelt are a year round issue. That's because snow is used by approximately one sixth of Earth’s population for drinking, agriculture, and hydropower, among other uses. Researchers from the University of California, Irvine, with support from NIDIS, have developed a new framework for characterizing snow droughts around the world. Using the framework to analyze conditions from 1980 to 2018, the researchers found a 28-percent increase in the length of intensified snow-water deficits in the western United States during the second half of the study period. Analysis using the new framework shows prolonged snow droughts in California, Oregon, Washington and other Western states, and, to a lesser extent, Eastern Russia and Europe over the nearly four-decade term studied. |
|
Ranking the Drought Vulnerability of Each State
Although drought is one of the costliest natural hazards, there has been no comprehensive evaluation of our country’s drought vulnerability. Research funded by the National Science Foundation and the NOAA Climate Program Office presents an integrated national-scale assessment of the drought vulnerability of each state in the contiguous United States. Drought vulnerability is the result of a combination of different factors that reflect susceptibility to harm and ability to cope with hazards, rather than physical water scarcity alone. Thus, the authors assessed drought vulnerability as a function of exposure, sensitivity, and adaptive capacity, using socio-economic, climatic, and environmental indicators.
|
|
July 2020 Climate: Hot and Kind of Wet
The July 2020 contiguous U.S. temperature was 75.7°F, 2.1°F above the 20th-century average and ranking 11th warmest in the 126-year record. The July precipitation total for the contiguous U.S. was 2.93 inches, 0.15 inch above average, and ranked in the wettest one-third of the 126-year period of record. However, it wasn't enough to help alleviate drought. Approximately 33% of the contiguous U.S. was in drought by the end of July, up 7% from June, according to the U.S. Drought Monitor. Drought expanded or intensified across parts of the parts of the West, South, central Plains, central Rockies, Great Lakes, Ohio Valley and Northeast.
|
|
FEMA Funding Opportunities
FEMA has posted a Notification of Funding Opportunities for the Flood Mitigation Assistance (FMA) grant program and the new Building Resilient Infrastructure and Communities (BRIC) pre-disaster mitigation grant program on grants.gov. This year, there is $660 million available for these two programs combined. FEMA’s two competitive mitigation grant programs provide funding for eligible mitigation activities to strengthen our nation’s ability to build a culture of preparedness by reducing disaster losses and protecting life and property from future disaster damages. The application period opens on Sept 30, 2020. Deadline for applications is 3 p.m. EST on Jan 29, 2021. FEMA will be holding a series of Webinars on the program. Learn more >
|
|
FEATURED MAP + DATA
Landscape Evaporative Response Index
|
|
The Landscape Evaporative Response Index (LERI) is a high-resolution remotely-sensed information tool showing the evaporative response from the land in near real time across the Contiguous US and northern Mexico at 1-km spatial resolution. LERI maps essentially depict the anomalous state of root-zone soil moisture at different timescales (see below): 8-day, monthly, seasonal and annual, which helps to better understand the dynamics of drought through time. LERI can complement other drought-monitoring indices, such as SPI, SPEI, PDSI, and EDDI, and modeled soil moisture products, and has early warning potential for agricultural and ecological droughts, and wildfire risk. LERI is hosted on the NOAA Physical Sciences Laboratory website.
1-Month LERI
The 1-month July LERI map shows severe to extreme drought in a large swath of the southwestern US (with the gray signifying extreme arid conditions), including large parts of CO and NM, northeastern US, and the Ohio River valley. Severe to extreme drought is also seen central and eastern WY, central OR and WA, northern MI, and in patches in southeastern US.
|
|
8-day LERI
The 8-day LERI maps (which are updated weekly) can be visualized either as accumulated LERI value through the growing season (April 1 - October 30) or just a 8-day snapshot (un-accumulated).
|
|
UPCOMING
Events & Webinars
|
|
About NIDIS
The National Oceanic and Atmospheric Administration’s (NOAA) National Integrated Drought Information System (NIDIS) was authorized by Congress in 2006 (Public Law 109-430) with an interagency mandate to develop and provide a national drought early warning information system, by coordinating and integrating drought research, and building upon existing federal, tribal, state, and local partnerships.
|
|
|
|
|
|
|