| | |
Presents our
Bi-Monthly
ERPE Excerpts
| | |
Bi-MONTHLY MARKET ANALYSIS &
ECONOMIC UPDATES
| | |
October 8, 2026
BUFFERS
Balance of Protection and Performance
| | Tony Robbins is quoted saying, "Do something. Get results. Decide if it's worth repeating." Back in July of 2024 I wrote about Buffer Funds in my bi-weekly ERPE Excerpts. I have decided it is worth repeating. Here's the July 18, 2024 Excerpts. | | |
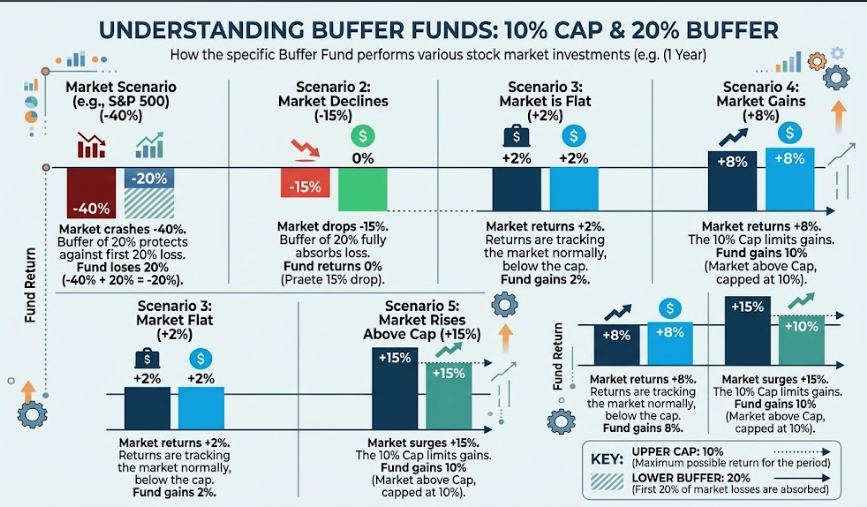
Revisiting Buffers is largely a function of current market conditions. The basic purpose of Buffer Funds is to balance principle protection and performance. That is a growing demand for many investors today. With the bench-mark bond yields at 20+ year highs, the S&P 500 at all-time highs, and a stock bull market near 4-years old, a balanced investment focused on risk mitigation is timely. Stated simply, Buffer's seek to track the return of the S&P 500, or another stock index, up to a predetermined cap, while buffering investors against losses over the outcome period, typically one year. For example, a recent 1-year Buffer Fund provides a 20% protection (the "buffer") and an upside max return of 10% (the "cap"). Again, I offered more on how Buffers work with my Excerpts July 18, 2024. Today, I wanted to offer some more insight as to how now may be an ideal time for both bond and stock investors.
How a Bond Investor Can Prudently Use Buffer Funds
Traditional bond investors face a structural dilemma: yield levels fluctuate, duration creates price risk, and real returns can suffer if rate volatility picks up or inflation remains sticky, like we have now. A bond investor could consider an allocation of a portion of conservative cash or fixed-income holdings into 20% equity buffer fund. This position is increasingly suitable as the Buffer's cap exceeds investment-grade bond yields. Additionally, the investor gets exposure to stock market growth while retaining a predefined buffer against equity drawdowns. This is particularly potentially beneficial to a "bond only" investor who therefore sacrifices capital appreciation for low risk/return investments.
How an Equity Investor Can Prudently Use Buffer Funds
Stock investors would naturally see a Buffer as a sacrifice of perhaps higher long-term compounding gains when they cap their upside. True. For these investors Buffer's would likely be suitable for the conservative/defensive portion of their equity allocation. And, the "sacrifice" argument deserves some proper perspective. Over the past 30 years (1996–2025), the S&P 500 delivered an annualized total return of 10.4%. So, owning a Buffer with a cap that limits a 1-year gain of "only" 10% isn't really a sacrifice relative to the norm. Also, the Buffer Fund is suited best for conservative investment. Its name gives it away. The "buffer" component reduces risk, which is especially valuable in abnormally volatile periods. To illustrate, I'll provide a comparison of an investment in a Buffer Fund with a 10% cap and 20% downside buffer vs. the SP 500. Assuming a $100,000 initial investment in each on January 1, 2021 and held to end of 2022, here's the results year-over-year and overall:
- Year 1: The 2021 Bull Market
S&P 500 Price Return: +26.89%
S&P 500 Direct Investor: $100,000 grows by 26.89%.
Investment value is $126,890.
10% Capped Buffer Investor: The strategy captures gains up to the +10.00% cap.
Buffer Fund Value: $100,000 grows by 10.00%.
Investment value is $110,000.
- Year 2: The 2022 Bear Market
S&P 500 Price Return: -19.44%
S&P 500 Direct Investor: $126,890 declines by 19.44%.
Investment value is $102,223.
20% Buffer Fund Investor: On January 1, 2022, the fund resets its cap and buffer levels based on the new $110,000 balance. Because the market's -19.44% loss is completely absorbed by the 20% buffer, the fund experiences 0.00% loss for the period.
Investment Value: $110,000.
In the 2021–2022 sequence with an Up Big/Down Big scenario, the buffer fund sacrificed nearly 17% of upside during the 2021 rally. However, by protecting 100% of capital during the 2022 crash, the buffered portfolio still finished the 2-year period +$7,777 ahead of the uncapped S&P 500 with dramatically lower volatility.
While not for everyone and likely not all of anyone's investable funds, you see how a Buffer Fund can be of value. They may now be uniquely timely after a long, strong advance in stocks for an investor wanting to maintain stock market exposure but with less risk and willing to settle for "just 10%".
| | Proper Perspective: In our hectic and often hard to comprehend world, it is very easy to lose perspective. You may agree it is sometimes difficult to see the big picture. The media often doesn't help with this, but unfortunately instead encourages us to see things in a most negative light. Here is hopefully a pause to gain positive perspective. | | |
Famous Quote For Today: "Fame was sufficiently novel for me to be flattered by the company I would be keeping."
~~Henry Kissinger, 1979
Today in History - On this day in 2001, President George W. Bush announces establishment of Office of Homeland Security.
| | |
INDICATORS OF INTEREST:
-
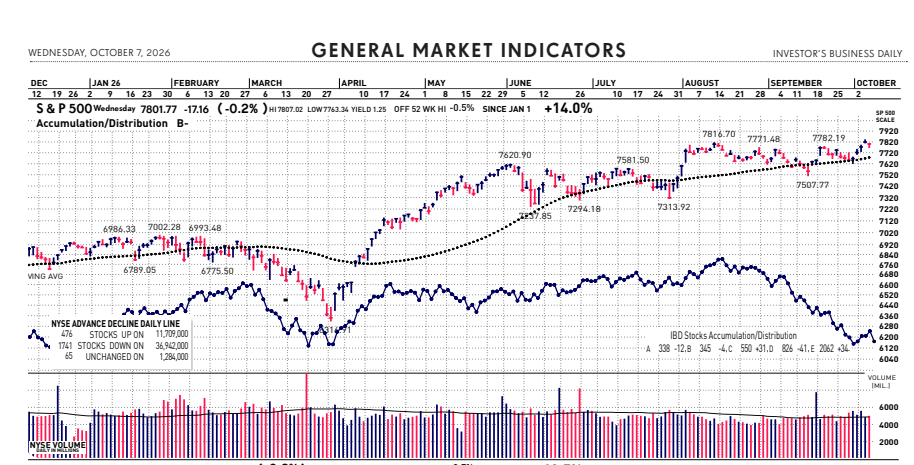
Market's Current Signal: Confirmed Uptrend. Analysis of the stock market over 130 years of history shows we can view it in terms of three stages -market in uptrend, uptrend under pressure and market correction. Since the 1880's, this perspective has led to investment out-performance relative to market indexes. This is due to trend analysis which determines risk reducing, return enhancing market entry and exit points.
Starting June 1 the market's trend strength weakened as an increasing number of heavy distribution days mounted. On June 23, with the Nasdaq shouldering eight instances of pronounced professional selling, the market's Confirmed Uptrend signal flashed a trend change to Uptrend Under Pressure. As the index received its ninth distribution day within a 25-session time frame on July 2, indicators began to flash more caution. July 24's market action came close to a trend change to Market in Correction. That reversed positively to a trend turnaround to Confirmed Uptrend August 4 and was further confirmed with a follow-through August 27. Following that, the market weakened as rally attempts failed in the face of higher oil prices, increased inflation pressures and climbing interest rates. That weakness triggered a signal change to Uptrend Under Pressure which reversed back to renewed bullish price action in late September moved the trend signal up to Market in Confirmed Uptrend.
| |
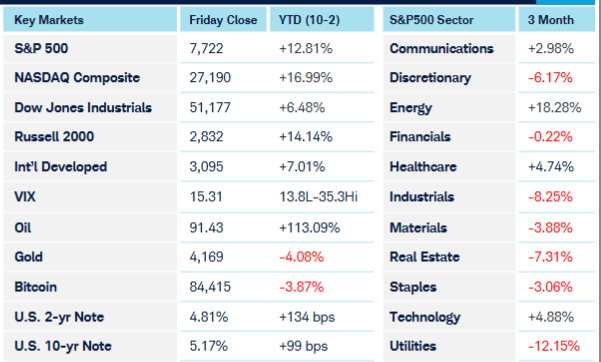
Here are key market levels as of Monday, October 2: | |
Recapping Last Week
Global equity markets remained resilient last week despite another sharp rise in Treasury yields, with the 10-year yield surging to 5.34%, its highest level since 2002, before pulling back following Friday’s benign employment report. The rise in yields reflected persistent inflation concerns, elevated energy costs and increasing expectations that interest rates will remain higher for longer. The move was not confined to the U.S., with European bond markets also under pressure as the French 10-year vs. German 10-year spread widened to over 150 basis points. While the U.S. Dollar continues to benefit from the widening yield differentials, the intra-Europe turmoil driven by French fiscal issues led to a sharp selloff in the Euro, notably against the zero-interest-rate- bearing Swiss Franc, which resumed its historical role as a “flight to quality” instrument. Energy prices provided some relief late in the week after the G-7 countries agreed to release 100 million barrels of crude oil and diesel from their strategic reserves. This came after reports that the Trump administration had been pressuring European countries to do so with the threat of the U.S. implementing a ban on diesel exports. China did in fact implement an export ban on refined petroleum products, reflecting the continued constraints on refining capacity and delivery being felt globally. In U.S. equities, mega-cap tech propelled the Nasdaq 100 into all-time highs, led by market cap leader Nvidia and buoyed by accelerating record earnings out of Micron. Short-term interest rate markets also didn’t need to await the release of Friday’s employment report to adjust expectations of Fed policy as the chance of a rate hike at the October meeting was steadily reduced throughout the week from 64% to only 18%. Helping along the way was the mid-week release of the Personal Consumption Expenditures index—which we all know is “The Fed’s Preferred Inflation Gauge.” The annualized rate came in at 3.0%, a tenth below the low-end of market expectations and 1% away from the Fed’s stated target. The employment report showed considerably weaker job creation than expected. September payrolls increased only 29k, versus expectations of 85k, while the unemployment rate up ticked a tenth to 4.2%. The knee-jerk reaction to the release of the data was a rally in stocks, bonds, precious metals and crypto, and a decline in the dollar amid lessened expectations of an urgency for the Fed to hike rates. However, the reaction was short-lived as all the asset classes soon reversed course—with the exception of the ever-resilient tech-heavy equity indices.
Current View
The stock market's bullish trend is still in force. Even yesterday's weak opening closed strong - well off the intraday lows. Interest rates, oil prices and earnings remain the major market movers. Interest rates climbed early yesterday to a level not seen in 24 years (measured by the 10-year Treasury yield). By the session's end rates retreated. Oil dipped to the lowest price per barrel for West Texas Intermediate since August 31. While Q3 earnings season is just days away from leading the market's news flow, expectations are high. The macro market trend remains strong as the current signal is Market in Confirmed Uptrend. As sector rotation and price swings are accelerating along with rising rates, the market's trend can change quickly.
| |
-
Industry Group Strength: NEUTRAL. As of yesterday, 79 out the 145 groups I monitor are up year-to-date. 66 are down.
-
New Highs vs. New Lows: BEARISH. In yesterday's session, there were 91 new 52-week highs and 371 new 52-week lows.
-
Dow Dividend Yield: BEARISH. The current yield for the Dow Jones Industrial Average is 1.66%. The 10-year Treasury now 5.24%, back to where is was in 2004.
-
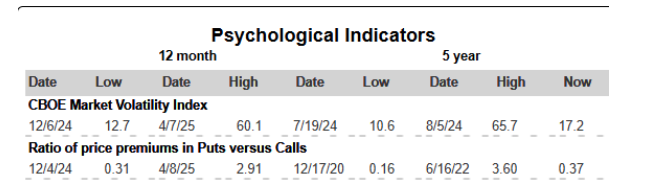
Volatility Index: BEARISH. Volatility has been volatile. The "VIX" is now 16, it is the same as two weeks ago. The index is also known as the "Fear Index." It is considered a contrarian indicator and therefore viewed as bullish as it rises indicating investors are becoming more fearful. The VIX:
| | -
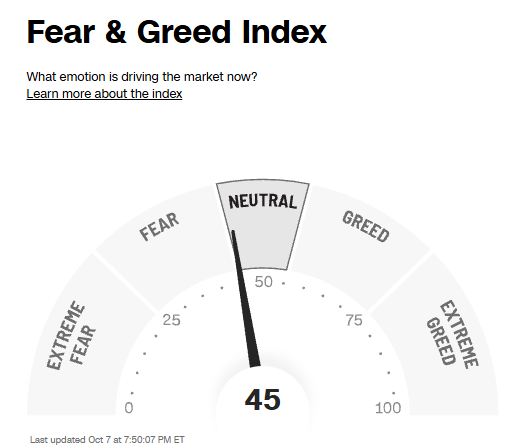
Fear / Greed Index: NEUTRAL. Investors are driven by two emotions: fear and greed. Too much fear can create a condition of oversold/ undervalued stock prices. Too much greed can result in overbought/overvalued stock prices. The AAII Investor Sentiment Index is now neutral. BE FEARFUL WHEN OTHERS ARE GREEDY. At 45, the Fear & Greed Index is up from 35 two weeks ago.
| | CLICK VIDEO FOR MORE ON THE "FEAR & GREED INDEX" | | |
-
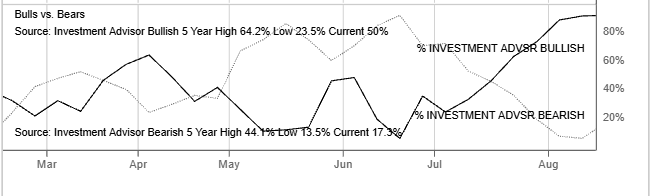
Bull / Bear Barometer: NEUTRAL. This secondary market indicator should also be viewed with a contrarian perspective. As of yesterday, according to the latest survey of stock market newsletter writers by Investor's Intelligence, the bullish tally is 51.9%, up from 50% two weeks ago. The bears are 15.4%, down from 17.3% two weeks ago. Consider this a contrarian indicator because the crowd is often wrong at market tops and bottoms. In other words, extreme bullishness has been seen near several market tops in the past, while extreme bearishness has been seen at market bottoms.
| -
Put / Call Ratio: BEARISH. The ratio of put-to-call options is .67, down from 0.84 two weeks ago. The put-call ratio tracks the mood of what options investors are doing, not just saying. They typically buy puts if they think a stock will decline and calls if they think it will rise. If they're buying lots of puts, they see the market declining. And if they're loading up on calls, they're generally bullish. Historically, market bottoms occurred when the reading spikes to 1.2 or more. Market tops are often made when the reading is 0.6 or less. Note how reliable this is with respect to the February record low coinciding with the market high. Keep in mind this is also a contrarian indicator.
| | |
Global Economic Indicators & Analysis:
POSITIVE INDICATORS
Jobless Claims Down: The number of people claiming unemployment benefits fell by 2,000 to 197,000 in the week ending October 3, 2026, coming in below market expectations of 200,000 and marking the lowest initial claim count since the 60-year low of 189,000 in mid-July. Continuing claims, a gauge of ongoing unemployment in the US, rose by 17,000 to 1,716,000, remaining relatively close to the more-than-three-year low touched in the previous week. The data extended a period of resilience in the US labor market as the Federal Reserve continues to cite full employment. Meanwhile, initial claims filed by federal employees, which remain in the spotlight due to the administration's push to shrink the public sector, rose by 26 to 395, remaining well below historical levels.
US Services Index Up: The S&P Global US Services PMI rose to 58.8 in September 2026 from 56.5 in August, slightly above the flash estimate of 58.7. The index has signaled sustained growth in business activity for six months, with the latest expansion the strongest since July 2021. Technology remained the strongest-performing sector, while growth also accelerated across consumer businesses, industrials and healthcare. New orders rose at their fastest rate in over four years, driven by strong domestic demand, while employment increased for a third consecutive month, with job creation at its fastest since June 2022. Strong new orders continued to outpace capacity, pushing backlogged work higher for the 19th consecutive month. Cost pressures intensified, with input costs rising sharply to their highest level since November 2022 amid higher gas and labor costs. Output prices also increased faster, with inflation the second-highest in just over a year. Business confidence strengthened to a one-year high.
GDP Up: The US economy expanded at an annualized rate of 2.2% in Q2 2026, revised up by 0.7 percentage point from the 2nd estimate, following an upwardly revised 2.5% growth in Q1. The stronger estimate reflected upward revisions to investment, consumer spending, and government spending. The upward revision to investment reflected stronger private inventory and fixed investment, with nonresidential structures (particularly commercial and healthcare construction, led by data centers) providing the largest contribution. From an industry perspective, the growth was driven by increases in real value added across private services-producing industries (2.5%), private goods-producing industries (2.3%), and government (less than 0.1%). The largest contributions came from real estate and rental and leasing, information, durable goods manufacturing, and finance and insurance. These gains were partly offset by declines in transportation and warehousing, retail trade, and nondurable goods manufacturing.
| |
WEAK INDICATORS
Jobs Report Down: Last Friday's Nonfarm payroll employment and unemployment rate reports were little changed in September and below expectations. Nonfarm payrolls increase by 29,000 in September, just under a third of the 90,000 rise economists had expected. Unemployment rate rises to 4.2% from 4.1% as more people enter labor force. First-time applications for unemployment benefits have been hovering at 57-year lows amid robust corporate profit growth and resilient domestic demand. Economists said the report reaffirmed the labor market's "low-hire, low-fire" state and likely had no impact on near-term monetary policy, with inflation remaining the key focus. This surprisingly weak economic data was perceived as good news for the stock market. It rallied on thought that the jobs data gives the Fed less reason to raise interest rates in October and puts a December hike in question.
| | |
Call me if you have any questions. I am always happy to help!
John J. Gardner, CFP®, CPM®.
| | For my Quarterly Market Focus podcast, click on the link below. I provide a review of global stock market highlights over the past quarter and preview of the quarter ahead. Forward insights and perspectives are based on current financial market and economic trends with an emphasis on relevant developments in various areas from Fed policy to company earnings announcements. | | Blackhawk Wealth Advisors is the parent corporation of Equity Research & Portfolio Evaluation and Blackhawk Asset Management. It's Chief Investment Officer is John J. Gardner. John is a Certified Financial Planner (CFP®) and Certified Portfolio Manager (CPM®). As an AIF®, John is also an Accredited Investment Fiduciary. | | | | |