|
The JUST RELEASED
2025 OUTLOOK is HERE!
In case you missed it, make sure to take a look at the...
2025 Outlook: Pragmatic Optimism
**IMPORTANT DISCLOSURES
This material is for general information only and is not intended to provide specific advice or recommendations for any individual. The economic forecasts may not develop as predicted. Please read the full OUTLOOK 2025: Pragmatic Optimism publication for additional description and disclosure. This research material has been prepared by LPL Financial LLC.
| |
Fait Accompli \fe takɔ̃ˈpli\ noun: an accomplished fact; a thing already done | |
|
Cornerstone Fait Accompli
It's March madness time! The first NCAA Division I men's basketball tournament was played in 1939. It had eight teams. Oregon is the first NCAA tournament champion, beating Ohio State for the title.
| | |
|
Did you see our latest post? | |
Never miss a Cornerstone announcement - make sure you are following us on Facebook!
When you follow us you'll get access to up to date market information, helpful financial planning tools like calculators, and all of the Cornerstone office happenings!
Click the button below,
make sure you're logged into your account and follow our Facebook page.
| |
Click on the buttons below and don't forget to like, comment and share our posts! | |
Earnings Season Recap: Strong Growth, Big Upside, Now What?
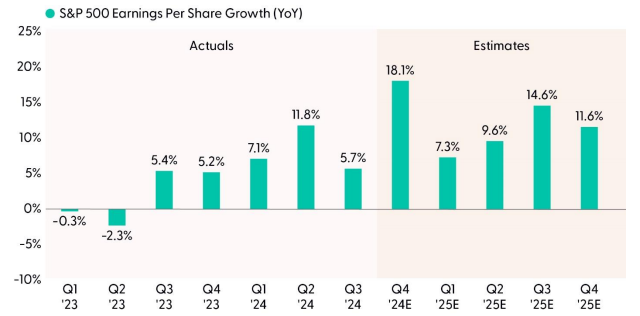
Fourth quarter earnings season is nearly complete, and it has been a good one. S&P 500 companies grew profits more than 18% year over year, according to FactSet data, with mega cap technology and financial companies doing most of the heavy lifting (about seven points of growth came from each). The Magnificent Seven grew earnings by an average of 37% and financials earnings jumped 50%. But the road ahead gets tougher. With new tariffs in place and more likely on the way, on top of mounting evidence that the U.S. economy is slowing, achieving double-digit earnings growth in 2025, as many expect, will be a tall task.
Big Numbers
Six weeks ago in our fourth quarter earnings preview, we wrote that we expected modest upside to the 12% consensus estimate for Q4 S&P 500 earnings growth. That turned out to be too pessimistic because corporate America delivered more than 6% average earnings upside — hardly modest. We expected economic growth to offset currency headwinds, but underestimated the amount of margin improvement companies could achieve, their ability to manage policy uncertainty, and upside in financials. Operating margins rose a full point year over year, while financials generated average earnings upside of 13%, compared to 8% in the prior quarter.
Strong Earnings Outlook Intact After Big Quarter but Tariff Overhang Lingers
| |
Source: LPL Research, FactSet, 02/27/25 Disclosures: All indexes are unmanaged and cannot be invested in directly. Past performance is no guarantee of future results. Estimates may not materialize as predicted and are subject to change
Perhaps the toughest test this earnings season was around maintaining the optimistic earnings outlook for 2025. As we wrote in our preview commentary:
“The key to the market’s reaction to results will be whether guidance is upbeat enough to keep market expectations for double-digit earnings gains in 2025 intact. To that end, trade policy expectations will be important factors.”
Estimates held up well enough to keep that double-digit earnings growth outlook within reach — it just may be a bit of a stretch depending on how hard tariffs hit and how much the economy slows. Market reactions to earnings beats and misses have been near historical averages, suggesting overall results and outlooks met expectations.
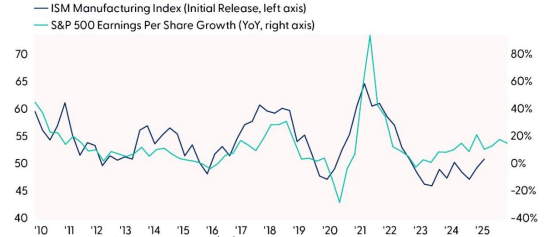
Improving Manufacturing Outlook Bodes Well
An improving manufacturing outlook was supportive late last year. Historically, the Institute for Supply Management (ISM) Manufacturing Index has correlated well with S&P 500 earnings growth because earnings are more manufacturing-driven than the more consumer-oriented economy.
The accompanying chart illustrates the recent improvement in the outlook for manufacturing activity. Remember, this survey measures expectations — whether companies expect to spend more or less — so it tends to signal near term earnings direction. That means the improvement from a contractionary reading of 47.2 in September up to an expansionary 50.9 in January points to further earnings gains ahead. The new orders reading from the ISM, which is more forward-looking, has had an even bigger move — from 46.1 in September to a firmly expansionary 55.1 in January.
However, healthy economic activity in the fourth quarter and optimism from manufacturers was not enough to overcome downward pressure on estimates — the consensus S&P 500 earnings per share (EPS) estimate for the first quarter was cut by about 5% over the past six weeks. Near-quarter estimates almost always get cut by 2–3%, potentially more as a new year begins. Plus, the currency headwind stiffened into reporting season, tamping down on guidance. Earnings still could grow 10% in the first quarter, but corporate America will need help from the economy, including more productivity, less inflation, and lower interest rates. Policy matters too, of course, where tariffs remain a big wildcard.
Manufacturing Activity Picking Up, Consistent With Modest Earnings Growth
| |
Source: LPL Research, Bloomberg, FactSet, 02/27/25 Disclosures: All indexes are unmanaged and cannot be invested in directly. Past performance is no guarantee of future results.
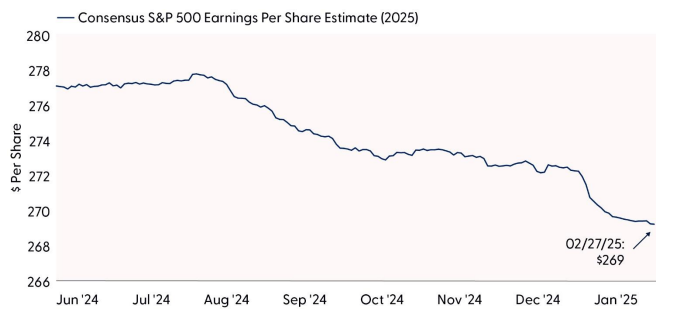
Double-Digit Earnings Growth in 2025 May Be a Stretch
To be clear, LPL Research’s forecast for S&P 500 EPS in 2025 at $260 is an 8–9% increase over 2024, obviously very close to double digits. But both the bottom-up and top-down consensus estimates are calling for a 12% increase. Given actual earnings tend to come in 5–6% below estimates at the start of the year, tariffs probably aren’t in the numbers yet, and most economists aren’t factoring in much of a slowdown in the economy, our forecast seems much more realistic. Upside could come from an artificial intelligence (AI) productivity boost or continued margin improvement, while downside could come from harder-hitting tariffs and more retaliation from our trading partners. With this much uncertainty (including currency uncertainty), it seems prudent to factor in some downside. Hopefully we’ll be pleasantly surprised. The resilience of S&P 500 earnings estimates for the full year – down just 1.4% year to date – is encouraging.
Consensus S&P 500 Earnings Estimate Has Fallen As Expected but More to Go
| |
|
Source: LPL Research, FactSet, 02/27/25 Disclosures: All indexes are unmanaged and cannot be invested in directly. Past performance is no guarantee of future results. Estimates may not materialize as predicted and are subject to change.
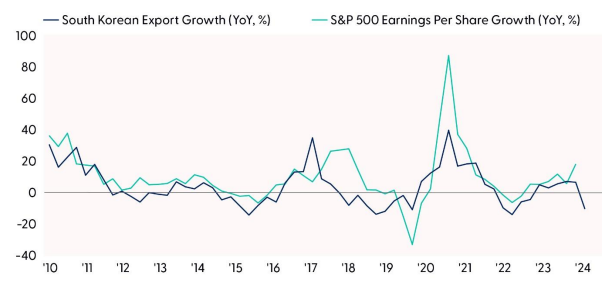
Watching Asian Export Markets
Another economic data point we monitor to gauge earnings trends is South Korean export activity. The U.S. earnings relationship historically has been tight, highlighted in the accompanying chart, indicative of the significant influence technology has on corporate America’s overall profits.
South Korean exports fell 10% year over year in January, the first drop since September 2023, and following a more than 6% increase in December. Taiwan’s exports are important to monitor as well, and the story is similar there.
Some of this reduction in trade activity is likely related to chip export controls to China, which highlights the risk to earnings going forward. Again, high-single-digit earnings growth is probably still a reasonable expectation, but a trade war with China that affects the global tech supply chain is a risk to tech earnings in 2025. The tech sector is expected to drive about half of S&P 500 EPS growth in 2025. Something to watch closely.
Dip in South Korean Exports May Signal U.S. Earnings Slowdown
| |
Source: LPL Research, Bloomberg, FactSet 02/27/25 Disclosures: All indexes are unmanaged and cannot be invested in directly. Past performance is no guarantee of future results.
Conclusion
Earnings grew rapidly in the fourth quarter with solid upside surprises, but the road ahead gets tougher. Companies not only did a good job managing costs and currency headwinds last quarter, but they also waded through policy uncertainty quite well. Doing that again in 2025 will be more difficult as tariffs go into effect and trade tensions potentially ratchet higher as the economy likely slows. Higher productivity following heavy technology investment may help, but with so much uncertainty, it seems prudent to factor in some additional earnings downside. We reiterate our forecast for high-single-digit growth in S&P 500 EPS in 2025, below current consensus estimates calling for a 12% increase. We believe that’s enough to support similar mid-to-high single-digit gains for stocks this year, though the ride to get there may be bumpy.
Asset Allocation Insights
LPL’s Strategic and Tactical Asset Allocation Committee (STAAC) maintains its tactical neutral stance on equities, with a preference for the U.S. over international and emerging markets, growth over value, and large caps over small. However, we do not rule out the possibility of additional short-term weakness, as a lot of good news is still priced into markets and geopolitical uncertainty remains high.
Within fixed income, the STAAC continues to hold an overweight tilt in preferred securities as valuations remain attractive. However, the risk/reward for core bond sectors (U.S. Treasury, agency mortgage-backed securities, investment-grade corporates) is more attractive than plus sectors. In our view, adding duration isn't attractive at current levels, and the STAAC remains neutral relative to our benchmarks.
| |
This statement is a testimonial by a client of the financial professional as of 11/14/23. The client has not been paid or received any other compensation for making these statements. As a result, the client does not receive any material incentives or benefits for providing the testimonial. These views may not be representative of the views of other clients and are not indicative of future performance or success. | |
Etymology /edəˈmäləjē/ noun: the origin of a word and the historical development of its meaning. | |
|
Triple Bottom Line: maintains that companies should commit to focusing as much on social and environmental concerns as they do on profits. TBL theory posits that instead of one bottom line, there should be three: profit, people, and the planet. A TBL seeks to gauge a corporation's level of commitment to corporate social responsibility and its impact on the environment over time.
In 1994, John Elkington—the famed British management consultant and sustainability guru—coined the phrase "triple bottom line" as his way of measuring performance in corporate America. The idea was that a company can be managed in a way that not only makes money but which also improves people's lives and the well-being of the planet.
| |
|
Have you taken advantage of
CAPS
yet?
Don't miss out!
Many of our clients ask how they benefit from taking action and initiating a Financial Plan for themselves.
When you sign up for our CAPS program, you will get access to:
A personalized financial plan, a place to keep all of
your accounts in one location and a secure place to store your
important documents.
Click Here to Learn More
| |
Le commentaire \ˈkɒmɛnt\ masculine noun: a French word meaning a remark or comment | |
|
Cornerstone Commentaire
"Don't follow the path. Go where there is no path and begin the trail. When you start a new trail equipped with courage, strength and conviction, the only thing that can stop you is you!"
-Ruby Bridges
| |
Stay Safe, Stay Kind, Stay Strong, Stay Well | |
|
P.S. Please feel free to forward this commentary to
family, friends, or colleagues.
+++++++++++++++++++++++++++
The highest compliment
you can give us would be the
referral
of your friends or family!
| |
|
The information contained in this email message is being transmitted to and is intended for the use of only the individual(s) to whom it is addressed. If the reader of this message is not the intended recipient, you are hereby advised that any dissemination, distribution, or copying of this message or content is strictly prohibited. If you have received this message in error, please immediately delete.
Information and interactive calculators are made available to you as self-help tools for your independent use and are not intended to provide investment, tax, or legal advice. We cannot and do not guarantee their applicability or accuracy in regards to your individual circumstances. All examples are hypothetical and are for illustrative purposes. We encourage you to seek personalized advice from qualified professionals regarding all personal finance issues.
Securities and advisory services offered through LPL Financial (LPL), a registered investment advisor and broker-dealer (member FINRA/SIPC). Insurance products are offered through LPL or its licensed affiliates. To the extent you are receiving investment advice from a separately registered independent investment advisor that is not an LPL affiliate, please note LPL makes no representation with respect to such entity.
Important Disclosures
This material is for general information only and is not intended to provide specific advice or recommendations for any individual. There is no assurance that the views or strategies discussed are suitable for all investors or will yield positive outcomes. Investing involves risks including possible loss of principal. Any economic forecasts set forth may not develop as predicted and are subject to change.
References to markets, asset classes, and sectors are generally regarding the corresponding market index. Indexes are unmanaged statistical composites and cannot be invested into directly. Index performance is not indicative of the performance of any investment and do not reflect fees, expenses, or sales charges. All performance referenced is historical and is no guarantee of future results.
Any company names noted herein are for educational purposes only and not an indication of trading intent or a solicitation of their products or services. LPL Financial doesn’t provide research on individual equities.
All information is believed to be from reliable sources; however, LPL Financial makes no representation as to its completeness or accuracy.
All investing involves risk, including possible loss of principal.
U.S. Treasuries may be considered “safe haven” investments but do carry some degree of risk including interest rate, credit, and market risk. Bonds are subject to market and interest rate risk if sold prior to maturity. Bond values will decline as interest rates rise and bonds are subject to availability and change in price.
Mortgage-backed securities are subject to credit, default, prepayment, extension, market and interest rate risk. Because of their narrow focus, investments concentrated in certain sectors or industries will be subject to greater volatility and specific risks compared with investing more broadly across many sectors, industries, and companies.
Because of their narrow focus, investments concentrated in certain sectors or industries will be subject to greater volatility and specific risks compared with investing more broadly across many sectors, industries, and companies.
The Standard & Poor’s 500 Index (S&P500) is a capitalization-weighted index of 500 stocks designed to measure performance of the broad domestic economy through changes in the aggregate market value of 500 stocks representing all major industries.
The PE ratio (price-to-earnings ratio) is a measure of the price paid for a share relative to the annual net income or profit earned by the firm per share. It is a financial ratio used for valuation: a higher PE ratio means that investors are paying more for each unit of net income, so the stock is more expensive compared to one with lower PE ratio.
Earnings per share (EPS) is the portion of a company’s profit allocated to each outstanding share of common stock. EPS serves as an indicator of a company’s profitability. Earnings per share is generally considered to be the single most important variable in determining a share’s price. It is also a major component used to calculate the price-to-earnings valuation ratio.
All index data from FactSet or Bloomberg.
This research material has been prepared by LPL Financial LLC.
| |
For public use.
Member FINRA/SIPC.
RES-0003080-0225 Tracking #702857 | #702858 (Exp. 03/26)
Securities and Advisory Services offered through LPL Financial, a Registered Investment Advisor. Member FINRA / SIPC .
Privacy Policy | LPL.com
| | | | |