Economic Trends
December 2019
|
Creighton Institute for Economic Inquiry
|
Greetings!
Welcome to our December report covering results from Creighton's two November economic surveys.
Creighton's monthly survey of supply managers and procurement experts in nine Mid-America states indicates economic growth is in a range indicating significantly weaker manufacturing growth and modest inflationary pressures. The overall index from Creighton's monthly survey of bank CEOs in rural areas of 10 states indicates the Rural Mainstreet Index (RMI) is improving, but with declining farmland prices and agriculture equipment sales.
I hope you, your family and friends have a wonderful Christmas and holiday season.
Creighton University
Jack MacAllister Chair in Regional Economics
|
|
|
From the Desk of Ernie Goss
An Economic Misery Index for States: Income Inequality and Slow GDP Growth Produce Misery
Candidates for the Democrat presidential nomination have almost uniformly argued for reducing income inequality by raising taxes on businesses, and on, yet to be defined, high income earners.
What is the evidence that such a shift would in fact produce positive outcomes? In this essay, I combine an a widely accepted measure of income inequality, the Gini Coefficient, and gross domestic product (GDP) to arrive at a Misery Index.
Those states with high income inequality (high Gini Coefficients) and low GDP growth are awarded a high Misery Index. States with low income inequality (low Gini Coefficients) and high GDP growth are awarded a low Misery Index. I then calculate state and local tax burdens to gauge whether higher taxes are likely to lead to a lower, or higher Misery Index.
Inequality Misery
: The 10 states with greatest 2018 income inequality were: DC (#50, last in nation), New York, Connecticut, Louisiana, California, New Mexico, Florida, Massachusetts, Alabama, and Illinois (#41). The 10 states with the least income inequality for 2018 were: Utah (top state), Alaska, Iowa, North Dakota, South Dakota, Hawaii, Idaho, Vermont, Wisconsin, and Nebraska (#10).
Economic Growth Misery
: The 10 states with the poorest 2015-18 GDP growth were: Delaware (#50, last in nation), Wyoming, North Dakota, Alaska, Oklahoma, Connecticut, Rhode Island, Iowa, Louisiana, and South Dakota (#41). The 10 states with the highest 2015-18 GDP growth were: Washington (top state), Oregon, California, Utah, Idaho, Arizona, Nevada, Colorado, Florida, and Georgia (#10).
Overall Misery Index
: In terms of the overall Misery Index, from most Misery to least Misery: 51. (Highest Misery Index) Connecticut, 50. Louisiana, 49. New Mexico, 48. Mississippi, 47. New York, 46. Arkansas, 45. Illinois, 44. Oklahoma, 43. Rhode Island, 42. District of Columbia, 41. Delaware, 40. West Virginia, 39. New Jersey, 38. Kentucky, 37. Alabama, 36. Wyoming, 35. Missouri, 34. Pennsylvania, 33. Virginia, 32. North Carolina, 31. Massachusetts, 30. Ohio, 29. Florida, 28. North Dakota, 27. Texas, 26. Alaska, 25. Montana, 24. California, 23. Georgia, 22. Iowa, 21. South Dakota, 20. Tennessee, 19. Vermont, 18. Kansas, 17. Michigan, 16. South Carolina, 15. Nebraska, 14. Indiana, 13. Nevada, 12. Wisconsin, 11. New Hampshire, 10. Minnesota, 9. Maryland, 8. Maine, 7. Arizona, 6. Colorado, 5. Oregon, 4. Hawaii, 3.Washington, 2. Idaho, 1. Utah (Lowest Misery Index).
State and Local Tax Burdens: States with the highest Misery Index had the highest average per capita state and local taxes of $5,092 compared to states with the lowest Misery Index with the lower per capita state and local taxes of $4.580. In terms of states' business tax climate ranking, the highest Misery Index states had a worse business tax climate ranking of 28 compared to 23 for the low Misery Index states (lower ranking connotes a superior business tax climate).
Data support the hypothesis that Misery Indices were higher for high tax states, and lower for lower tax states, underpinning the contention that raising taxes will not reduce economic misery, but may in fact produce more economic misery, or slower economic growth, and higher income inequality
|
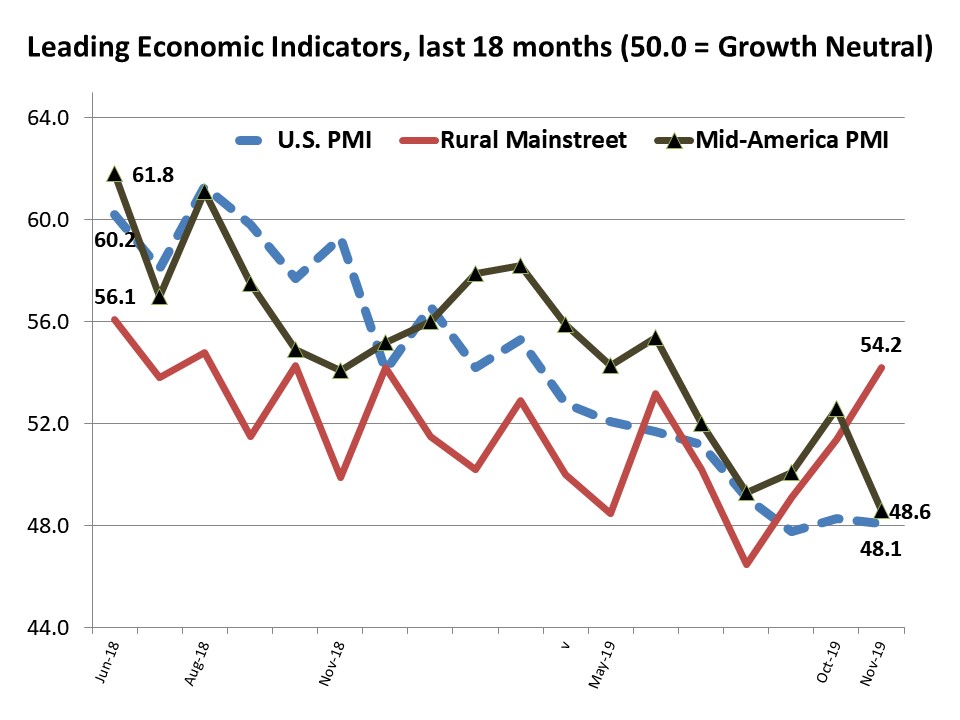
Mid-America & Rural Mainstreet
Indicators Graph
|
Mid-America
Index Falls to Three-Year Low:
Imports Rise in Anticipation of Tariffs
|
|
|
Mid-America Business Conditions Index November 2019
|
November survey highlights:
- The overall index declined below growth neutral for the third time in the past four months to its lowest level in three years.
- Regarding tariffs on purchased goods, only 17% of supply managers expect their firms to absorb the cost of the tariffs. Approximately 77% expect consumers to pay the costs of tariffs.
- Supply managers advanced purchasing from abroad to combat impending December tariffs.
- Despite the negative impact of the trade war on jobs, 60% of supply managers in the survey support continuing, or even expanding, trade restrictions and tariffs on imports from China.
- Hiring index declined to its lowest level in four years.
|
Rural Mainstreet
Index 2019 High: Bankers Expect Holiday Sales to Grow by only 1.3% from 2018
November survey results at a glance:
- Overall index climbs to highest reading for 2019. It also marked the fourth time in the past five months that the overall index has risen above growth neutral.
- The trade war with China and the lack of passage of the USMCA (NAFTA's replacement) are driving confidence and the economic outlook lower for most areas of the region.
- On average, bankers, expect a 1.3% expansion with 17.1% of bank CEOs anticipating a decline in retail sales from last year.
- Bankers reported that approximately 16.7% of farmers and 5.5% of business owners in their area had no organization succession plan.
|
|
The Outlook
Professor Goss' Forecast - December 2019:
- Expect annualized GDP growth of 1.3% for Q4, 2019 and 1.7% for Q1, 2020.
- Year-over-year increase in U.S. housing prices (Case-Shiller) to fall below 3.0% in Q4 (and to continue to drop).
- The Federal Reserve Open Market Committee (FOMC) to make no changes in short-term interest rates for the rest of 2019 and for the first half of 2020.
Conference Board (December 2019) - Global Economic Outlook 2020:
- "Stagnating Growth amid an Uncertain Outlook. The global economy took a bigger hit in 2019 than anticipated, slowing to 2.3 percent in 2019, down from 3.3 percent in 2017 and 3.0 percent in 2018. The slowdown is disconcerting because over the past two decades, a dip in global growth below 2 percent has often meant recessions in the form of GDP contractions across a broad range of regional economies.[1] Recession fears are currently widespread but appear to be overblown. We expect global growth to remain slow but slightly improve next year, reaching 2.5 percent."
- "Overall, we have arrived in a world of stagnating growth. While no widespread global recession has occurred in the last decade, global growth has now dropped below its long-term trend of around 2.7 percent. The fact that global GDP growth has not declined even more in recent years is mainly due to solid consumer spending and strong labor markets in most large economies around the world. Of course, current conditions and future challenges differ in regions throughout the world. In this edition of the Global Economic Outlook, we've included regional sections for the US, Asia, and Europe that describe the underlying forces that will shape growth in the short and medium term. The overarching theme of this year's outlook is stagnating growth and stalling globalization and what this means for business."
|
|
Opportunities
- The U.S. goods and services trade deficit was $47.2 billion in October, down $3.9 billion from $51.1 billion in September. However, trade deficits normally decline as U.S. growth falls.
- Inflation adjusted gross domestic product (GDP) increased at an annual rate of 2.1% in Q3, 2019 compared to 2.0% in Q2, 2019.
- The November jobs report was all peaches and cream as the nation added 266,000 jobs and the unemployment rate sank to 3.5%, its lowest since 1969.
Bad News
- Both Creighton's and ISM's Purchasing Management Indices (PMI) fell to their lowest level in 3 years signaling slower economic growth.
- U.S. labor productivity fell 0.3% in Q3, 3019. This is a troubling statistic since worker wages are tied to productivity.
- Over the past two years, the trade weighted value of the U.S. dollar has climbed by 9.4% making U.S. manufactured and farm goods less competitively priced abroad.
|
|
|
|
9-State
Supply Manager Report
* Arkansas
* Iowa
* Kansas
* Minnesota
* Missouri
* Nebraska
* North Dakota
* Oklahoma
* South Dakota
Read state-by-state, six-month projections (scroll down) by supply managers from nine states. Participants were surveyed about current economic conditions in their communities.
|
More From
Economic Trends
|
Between 2013 and 2018,
6 states experienced a decline in net farm income greater than 50%: Tennessee (79.0%),
Nebraska (64.8%),
South Carolina (61.8%), Indiana (61.3%),
Kansas (53.4%), and Missouri (51.8%).
|

Goss Eggs
Recent Dumb
Economic Moves
France enacted a 3% tax on cross-border digital service providers such as Facebook, Apple, and Google. This punishes French businesses and consumers with higher prices at the same time
it invites retaliation from the U.S.
President Trump announced it would strike back by raising tariffs on French goods just as it did on steel and aluminum from Argentina and Brazil in November. Consumers and businesses across the globe are being harmed by these tariff tantrums.
|
|
Keep an Eye on ...
ISM and Creighton's PMIs for December
On January 2, the Institute for Supply Management and Creighton University release their surveys of supply managers in the U.S. and Mid-America, respectively. This is an early reading of manufacturing growth. Both are weak and trending downward.
_ _ _
BLS's jobs report
On January 10, the BLS will report job gains and the hourly wage value for December. A job gain greater than 150,000 and an annual wage gain of more than 3% will be very bullish indicator for the economy.
_ _ _
On January 16, the U.S. Census Bureau releases its retails sales number for December. This will be an important gauge of consumer strength. A monthly increase greater than 0.4% will be a positive.
|
|