Economic Trends
February 2020
|
Creighton Institute for Economic Inquiry
|
Greetings!
Welcome to our February report covering results from Creighton's two January surveys. Creighton's monthly survey of supply managers in nine Mid-America states indicates economic growth is in a range pointing to a stronger manufacturing sector with modest inflationary pressures. Creighton's survey of bank CEOs indicates positive, but slight growth in rural areas of 10 Rural Mainstreet states.
Creighton University
Jack MacAllister Chair in Regional Economics
|
|
|
From the Desk of Ernie Goss
Voting with Their Feet: Low Tax Red States Win,
High Tax Blue States Lose
The Tax Cuts and Jobs Act of 2017 passed in December 2017 limited the federal deductibility of state and local taxes to $10,000. Prior to its passage, states were able to raise state and local taxes and transfer a portion of the burden to residents of other states via federal deductibility.
In effect, the 2017 tax law made living in a high tax jurisdiction less economically desirable. That is, the 2017 tax law made it more expensive to live in high tax states and incentivized workers, particularly high-income workers, to move from high tax states to low tax states. Has this happened?
Data in the accompanying table shows net interstate population migration for the period 2017-19 by state and local tax burdens:
States are ranked from the highest tax state (Vermont) to the lowest tax state (Alaska). States are also categorized as Red, Blue or Purple depending on voting records over the past four presidential elections. States that voted Republican in all four presidential elections are labeled Red "R", states that voted Democrat in all four elections are branded Blue "B", and states that split their electoral votes in the four elections are identified as Purple "P."
Table 1: 2017 state tax burden ranking; 2017-19 net population migration
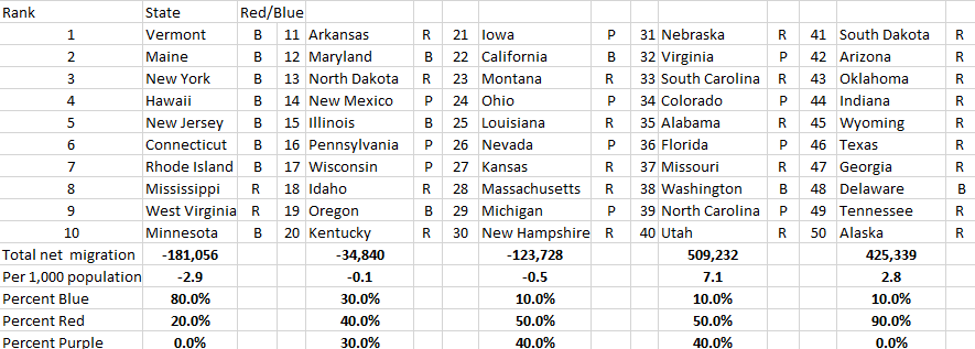
- The 10 states with the highest tax burdens in 2017 suffered a loss of 181,056 residents via migration, or 2.9 residents for each 1,000 in population.
- 80% of these high tax states were Blue states, and 20% were Red states.
- The 10 states with the lowest tax burdens in 2017 experienced a net gain of 425,339 residents via migration, or 2.8 residents per 1,000 in population between 2017 and 2019.
- 90% of these migration gainers were Red states, and 10.0% were Blue states.
Passage of the 2017 tax law reduced the ability of high tax states to transfer a portion of their taxes to residents of low tax states. While not conclusive, data presented in Table 1 supports the proposition that passage of the 2017 federal tax law incentivized migration from high tax to low tax states.
|
Mid-America & Rural Mainstreet
Indicators Graph
|
Mid-America
Business Index Climbs Again:
Confidence Rises from USMCA and Phase 1 Signing
|
|
|
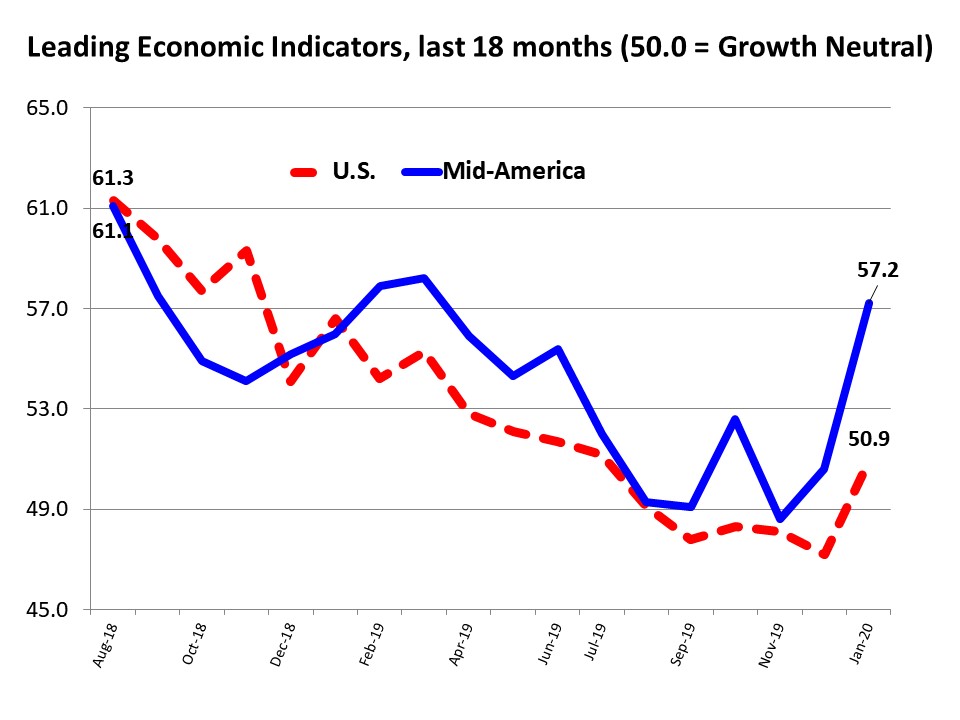
January 2020 Mid-America Business Conditions Index
|
January survey highlights:
- The overall index moved above growth neutral for the third time in the past four months, rising to its highest reading since March 2019.
- Hiring index rose above growth neutral.
- January passage of the USMCA and Phase 1 of the Chinese trade agreement boosted the regional business confidence index.
- Approximately 56% expect signing of USMCA and Phase 1 of the Chinese agreement to have a positive impact on business prospects.
- Due to the trade war, 28.2% of supply managers report changing international vendors for purchases.
|
Rural Mainstreet
Index
Begins 2020 on Strong Footing:
Bank Loans to Farms Lowest in Almost 7 Years
January survey results at a glance:
- Overall index remained above growth neutral rising to its highest level since June 2018.
- Farm loans fell to lowest level in almost seven years.
- Two of three Nebraska bankers reported property taxes as a significant factor reducing farm profitability, while only one of ten non-Nebraska bankers indicated that property taxes were a significant factor reducing farm profitability
- Farm equipment sales declined for the month.
- On average, bankers expect sales to decline by another 4.2% in 2020.
|
|
The Outlook
Professor Goss' Forecast - February 2020:
- Expect Annualized GDP growth of 2.0% for Q1, 2020.
- Year-over-year increase in U.S. housing prices (Case-Shiller) will fall below 2.0% in Q1, 2020.
- The annualized Consumer Price Index will move above 2.5% in the first half of 2020. Even so, the Federal Reserve Open Market Committee (FOMC) will make no changes in short-term interest rates for the first half of 2020.
NABE Panel Reports a Rosier View of GDP Growth, As Outlook Brightens for Sales, Employment, and Wages:
- COMMENTS: "Respondents to the January 2020 NABE Business Conditions Survey are more bullish about economic growth over the coming 12 months than they were in October," said NABE President Constance Hunter, CBE, chief economist, KPMG. "As in the October 2019 survey, about two-thirds of respondents expect inflation-adjusted gross domestic product (real GDP) to increase by 1.1% to 2.0% over the next four quarters. But the share expecting stronger growth jumped from 20% of respondents in October to 31% in the current survey."
-
"For the first time in a decade, there are as many respondents reporting decreases as increases in employment at their firms than in the previous three months," added NABE Business Conditions Survey Chair Megan Greene, senior fellow, Harvard Kennedy School. "However, this may have been due to difficulty finding workers rather than a pullback in demand. There was a significant increase in the percentage of firms reporting shortages of unskilled labor, while nearly half reports shortages of skilled labor."
|
|
Opportunities
- Both Creighton's and the U.S.'s Purchasing Management Indices (PMI) for January rose above growth neutral.
- The U.S. economy added a much stronger than expected 225,000 jobs in January as hourly wages ticked up a solid 3.1% over the past 12 months.
- The Case-Shiller U.S. Home Price covering all nine U.S. census divisions, for November reported a 2.6% year-over-year gain, up from 2.2% in the previous month.
Bad News
- U.S. GDP growth for 2019 slowed to 2.3% from 2.9% in 2018.
- The Congressional Budget Office estimates that the U.S. budget deficit will average $1.3 trillion yearly between 2020 and rise from 4.6% of GDP in 2020 to 5.4% of GDP in 2030.
|
|
|
|
9-State
Supply Manager Report
* Arkansas
* Iowa
* Kansas
* Minnesota
* Missouri
* Nebraska
* North Dakota
* Oklahoma
* South Dakota
Read state-by-state, six-month projections (scroll down) by supply managers from nine states. Participants were surveyed about current economic conditions in their communities.
|
More From
Economic Trends
|
Approximately 60% of Democrat primary voters support cancellation of all student debt. This would mean liquidation of almost $36,000 for each of the 45,000,000 current and former college students. Instead of burdening each U.S. worker with additional taxes of more than $10,000 to pay for this, why not instead assess the universities and colleges that benefited from these loans with the burden?
|

Goss Eggs
Recent Dumb
Economic Moves
Last month, the
Seattle City Council attacked landlord property rights by passing two measures. First, Seattle's "first in time" rule requires landlords to set rental criteria in advance and then rent to the first person who walks in the door with an adequate application.
The second law prohibits a landlord from inquiring about or considering an applicant's criminal history-deemed an "unfair practice" that can subject the landlord to severe civil penalties. Both measures will have the same outcome---making the current shortage of rental units more severe.
|
|
Keep an Eye on ...
ISM and Creighton's PMIs for
February
On March 2, the Institute for Supply Management and Creighton University release their surveys of supply managers in the U.S. and Mid-America, respectively. This is an early reading of manufacturing growth. Continuation of January's stronger growth will be bullish.
_ _ _
BLS's jobs report
On March 6, the BLS will report job gains and the hourly wage value for January. A job gain greater than 150,000 and an annual wage gain of more than 3% will be very bullish indicator for the economy.
_ _ _
Yield on 10-Year U.S. Treasury bond.
Find instantaneously, at finance.yahoo.com. As economic risks rise the yield (rate) will drop from its current 1.58%. On the other hand, as inflation ticks up, the yield the bond will rise.
|
|