Cornerstone Ruminations: Self-Care Advice for Younger Self | | |
September is Self-Improvement Month, and we’re taking a moment to reflect on one of the most powerful forms of growth: self-care.
If you could sit across from your younger self, what advice would you give? At CWMP, our team shared the words they wish they’d heard earlier in our latest Rumination. Click here to see what they'd share
| 2025 Midyear Outlook is Here! |
| Get market insights from LPL Research on what they believe is in store for the rest of 2025 and what it may mean for portfolios. | | |
IMPORTANT DISCLOSURES
This material is for general information only and is not intended to provide specific advice or recommendations for any individual. The economic forecasts may not develop as predicted. Please read the full 2025 Midyear Outlook: Pragmatic Optimism, Measured Expectations for additional description and disclosure. This research material has been prepared by LPL Financial LLC.
Tracking #762971 | LPLE #762973 (Exp. 07/26)
| | |
In A Jam
Believe it or not, "in a jam" has a history in the hunting arena, and the phrase is said to date back to the early 1800's. Appalachian frontiersman were said to have discovered that homemade jam and fruit preserves were quite an attraction for animals such as raccoons, skunks, and even bears. Before long, jam became the bait for trappings. When a scavenger, lured by the smell of the fruits and seasonings, was caught in a jam, nearby hunters would shoot away. The phrase quickly spread throughout the East to describe any sticky or difficult situation!
| | |
Equity Market Melt-Up Cools as Government Shutdown Looms
U.S. equity markets have bucked the weak September seasonality trend (thus far) and rallied to fresh highs this month, with the S&P 500 holding onto a 2.7% monthly gain as of September 26. The melt-up has been underpinned by the Federal Reserve (Fed) delivering on rate cut expectations without any hawkish surprises, earnings optimism, and continued support of the artificial intelligence (AI) secular growth theme. Economic data has also mostly surprised to the upside this month, including last week’s upward revision to second-quarter GDP (supported by an unexpected jump in consumer spending) and a drop in weekly jobless claims. Friday’s Core Personal Consumption Expenditures Price Index (PCE, the Fed’s preferred inflation gauge) matched expectations, while personal spending came in stronger than expected. However, the market appears to be transitioning back into a good news is bad news backdrop, where signs of economic strength dampen expectations for future rate cuts. The threat of a U.S. government shutdown and new tariff announcements from the White House acted as a further overhang, with investors de-risking throughout most of the week, leaving the S&P 500 with a modest loss of 0.35%.
On the Brink of a Shutdown
Congress has until October 1 to reach a deal to avoid a government shutdown, an unlikely scenario given the cancellation of a meeting on Thursday between President Trump, Senate Democratic Leader Chuck Schumer, and House Democratic Leader Hakeem Jeffries. Republicans have proposed voting on a “clean” seven-week continuing resolution, which would provide additional time for negotiations on full-year spending bills. Democrats insist they will not pass a spending bill unless it includes concessions on health care, including the rolling back of the White House’s Medicaid cuts, and an extension of the Affordable Care Act insurance subsidies. In addition to furloughing workers during a potential shutdown, the Office of Management and Budget (OMB) announced last week that executive agencies should consider permanent cuts to federal employees working in discretionary areas “not consistent with the President's priorities." In terms of odds of a shutdown, the betting markets are pricing in a 70% probability of the government shutting down on Wednesday.
What Does a Shutdown Mean for Markets
Government shutdowns introduce a new layer of uncertainty for markets, but fortunately, they tend to be short-lived and, as a result, have had minimal impact on the economy. Investors have generally looked past budget-related disruptions, prioritizing corporate earnings, broader economic trends, and other key macroeconomic factors. However, sectors that depend heavily on government contracts — such as defense and life sciences — can be more sensitive to shutdowns. These areas often experience short-term pullbacks due to funding uncertainty, but tend to outperform once government spending resumes. Additionally, a shutdown could result in delayed economic data releases, including this Friday’s highly anticipated Employment Report.
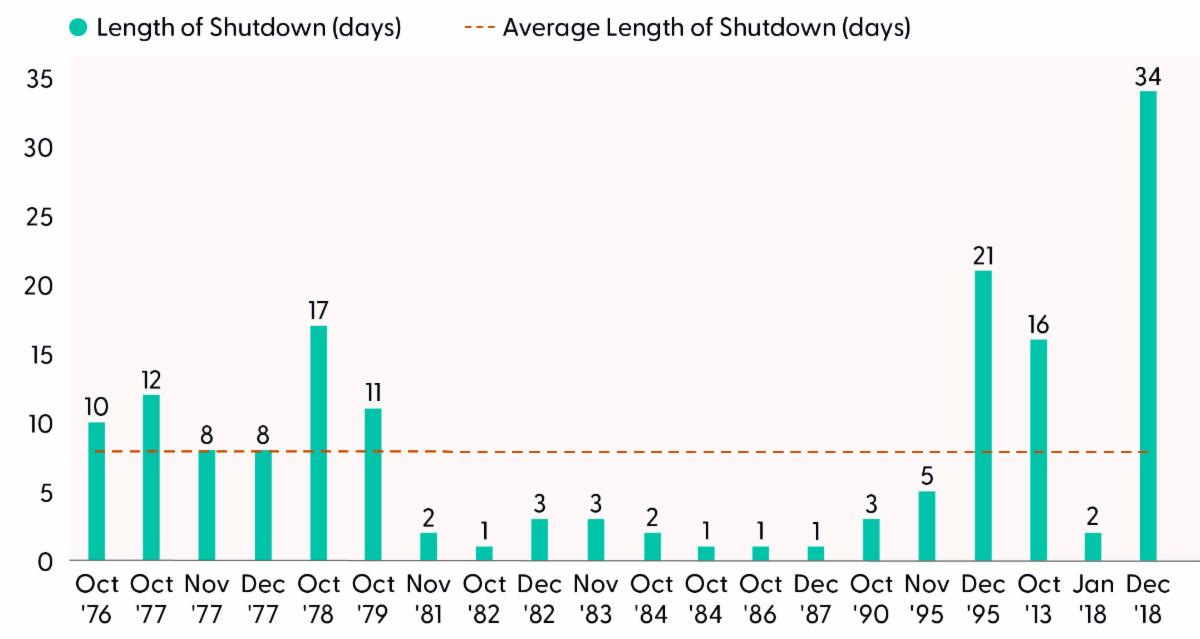
As highlighted in the Duration of Government Shutdowns chart, the U.S. government has experienced 20 shutdowns since 1976. The average duration of those shutdowns was eight days, with the longest spanning 34 days from December 22, 2018, to January 25, 2019. Moreover, during the one- and three-month periods following the passage of a budget, the average one- and three-month returns for the S&P 500 were 1.2% and 2.9%, respectively.
Duration of Government Shutdowns
| | |
Source: LPL Research, U.S. House of Representatives, 09/25/25
Disclosure: Data includes showdowns/funding gaps from 1976–YTD. Only 1/4 of the government was shutdown from December 2019–January 2019
Sliding Into Month End
While a potential government shutdown may be impacting price action across markets, there is building evidence that the rally in stocks could be due for a breather. It has been an impressive run since the April 8 low, with the S&P 500 amassing a gain of over 30% with minimal drawdowns along the way. However, overbought conditions have developed as the broader market recently reached an 11% premium to its closely watched 200-day moving average (dma), marking the highest reading since December 2024. Furthermore, participation in the latest leg higher has been underwhelming.
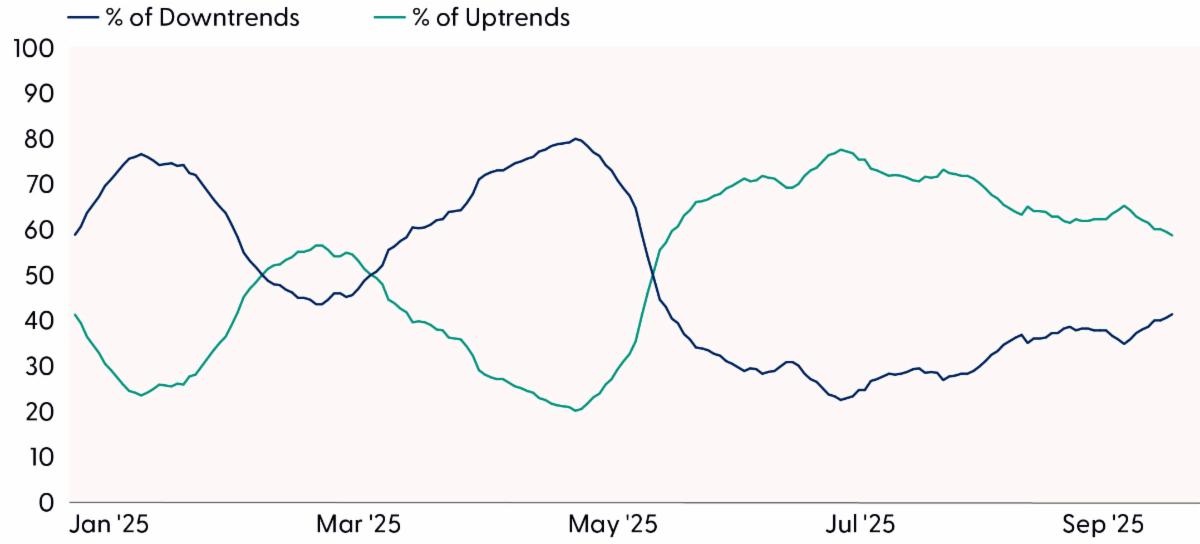
As highlighted in the Internal S&P 500 Trends Are Weakening chart, our proprietary trend model, which utilizes positioning across short-, intermediate-, and longer-term moving averages, reveals that fewer and fewer S&P 500 stocks are trading in uptrends. In contrast, the percentage of stocks in downtrends continues to increase. Perhaps even more concerning is the deteriorating trends within the technology sector, which holds a 33.5% weight within the S&P 500. As of September 26, only 53% of tech stocks were trading in an uptrend, a marked slowdown from the 80% reading reached in early August. As a reminder, the tech sector has consistently led the broader market, both on the way up and on the way down. Therefore, any pullback in the sector has the potential to drag the rest of the market down with it.
Internal S&P 500 Trends Are Weakening
| | |
Source: LPL Research, Bloomberg 09/25/25
Disclosure: Indexes are unmanaged and cannot be invested in directly. Past performance is no guarantee of future results. Trend definitions defined by the relationship between the 21-, 63-, and 126-day moving averages.
Silver Lining Playbook
While we believe the odds for a pullback (5–10% drawdown) are rising, there is a silver lining. First and foremost, we don’t think the bull market is at risk of ending. Strong earnings, a good enough economy, the resumption of the rate-cutting cycle, runway for AI spending and its potential productivity gains, and stimulative measures from the One Big Beautiful Bill Act (OBBBA) are a few of the many catalysts that should keep this bull market alive. Second, although some shorter-term technical cracks have recently developed, the S&P 500 remains in an uptrend driven by consistent cyclical leadership. Third, a pullback could reset overbought conditions and allow fundamentals to catch up with price. Finally, and perhaps most importantly for investors, a pullback would provide a tactical opportunity to buy into a seasonally strong period.
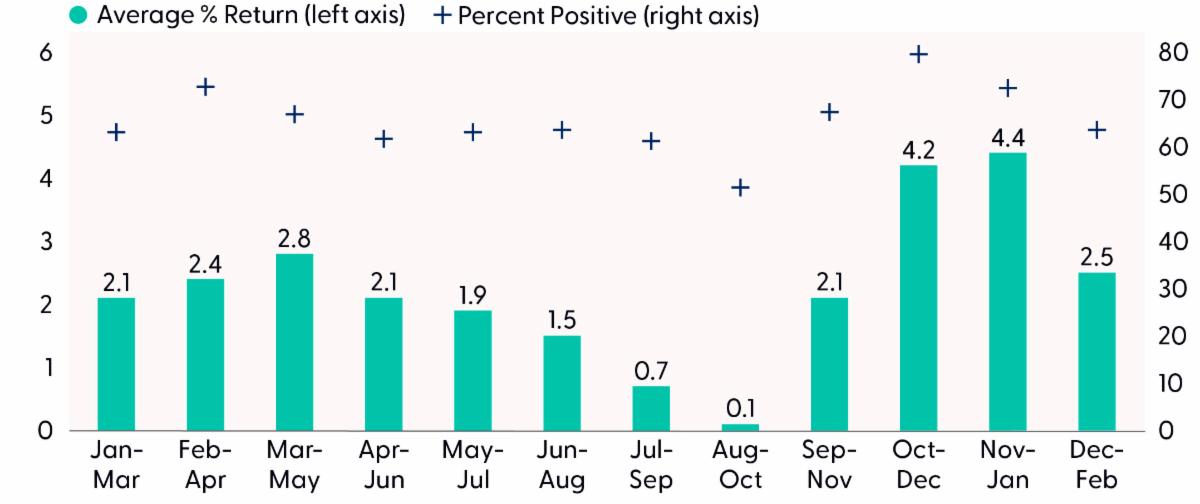
October marks the beginning of one of the best potentially three-month periods for stocks. Since 1950, the S&P 500 has generated an average gain of 4.2% from October through December, with 80% of periods producing positive results. And when results are positive, the average gain increases to 7%, compared to a 6.7% decline when the three-month window is negative, though past perfomance does not guarentee future results.
S&P 500 3-Month Return Windows (1950-YTD)
| | |
Source: LPL Research, Bloomberg 09/25/25
Disclosure: Indexes are unmanaged and cannot be invested in directly. Past performance is no guarantee of future results.
Don’t Fight the Fed
The Fed delivered a highly anticipated 0.25% interest rate cut during its September 16-17 meeting of the Federal Open Market Committee (FOMC). Fed Chair Powell said the move should be viewed as a “risk-management cut” in response to signs of a weakening labor market. Policymakers also penciled in two additional 0.25% interest rate reductions for 2025, as well as an additional 0.25% cut by year-end 2026. With this major risk-clearing event in the rearview mirror, investors are now asking what happens next.
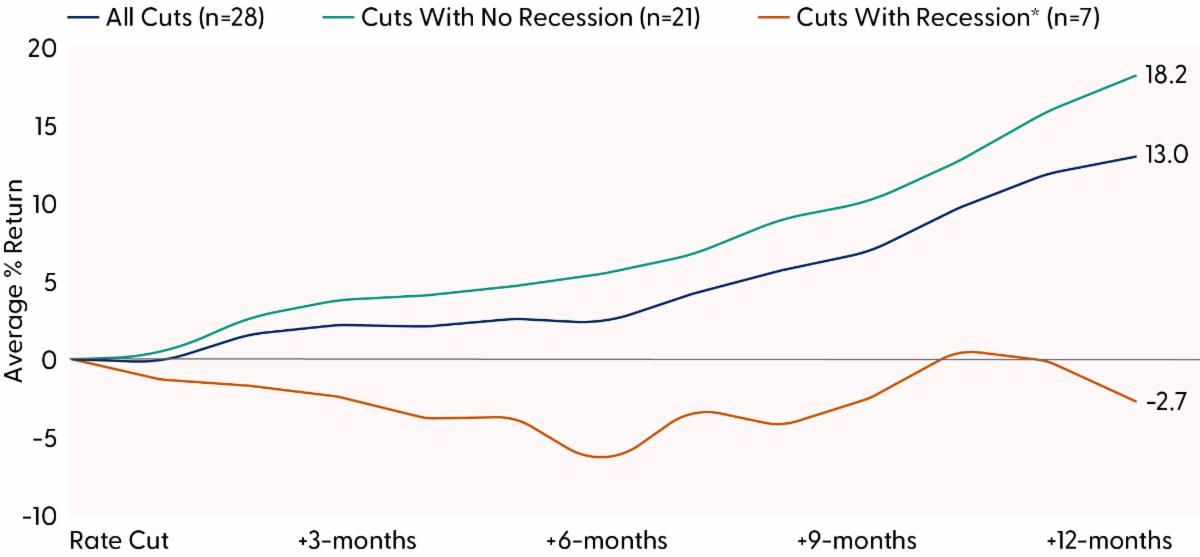
For stocks, history suggests that the path ahead is likely higher, based on previous instances when the Fed cut rates when stocks were trading near or at record highs, although past performance is no guarantee of future results. Since 1984, the Fed has cut rates 28 different times when the S&P 500 was within 3% of an all-time high. After the cut, the broader market traded higher by an average of 13.0% 12 months later, with 93% of periods producing positive returns. When there was no recession near or during the rate cut (we filtered for cuts occurring at least six months prior to a recession), the average 12-month return for the S&P 500 increased to 18%, with 21 out of 21 periods producing positive results. When a recession overlapped near or during a rate cut, the market posted an average loss of 2.7% in the 12 months after the Fed reduced rates, with only 25% of periods generating a gain.
S&P 500 Performance After Fed Cuts Rates At/Near Record Highs
| | |
Source: LPL Research, Bloomberg 09/25/25
Disclosure: All indexes are unmanaged and cannot be invested in directly. Past performance is no guarantee of future results. At/Near record highs defined as periods when the S&P 500 was within 3% of an all-time high. Data based on dates from 1984-YTD *Cuts with recession are defined as Federal Reserve interest rates occurring within six months of a recession
Summary
The restart of the Fed’s rate-cutting cycle — especially with equities trading near record highs — has historically been a constructive signal for markets. Still, the recent deterioration in labor market data raises concerns. The end of a long streak of positive monthly payroll prints serves as a cautionary marker, particularly if recession risks begin to build.
At this stage, LPL Research views near-term recession risk as relatively low. Our base case calls for an economy that continues to muddle through, with potential upside to GDP growth supported by a lower fed funds rate, stimulative measures from the One Big Beautiful Bill Act (OBBBA), and productivity gains amid easing cost pressures.
From a technical perspective, it is hard to argue with a bull market that is making new highs and powered by cyclical leadership. However, recent overbought conditions paired with diverging market breadth suggest this melt-up could be due for some cooling off — something we would consider as a potential tactical opportunity to buy the dip.
Asset Allocation Insights
LPL’s Strategic and Tactical Asset Allocation Committee (STAAC) maintains its tactical neutral stance on equities. Investors may be well served by bracing for occasional bouts of volatility given how much optimism is reflected in stock valuations, lingering tariff and inflation risks. STAAC’s regional preferences across the U.S., developed international, and emerging markets (EM) are aligned with benchmarks. The Committee still favors growth over value, large caps over small caps, and the communication services and financials sectors.
Within fixed income, the STAAC holds a neutral weight in core bonds, with a slight preference for mortgage-backed securities (MBS) over investment-grade corporates. The Committee believes the risk-reward for core bond sectors (U.S. Treasury, agency MBS, investment-grade corporates) is more attractive than plus sectors. The Committee does not believe adding duration (interest rate sensitivity) at current levels is attractive and remains neutral relative to benchmarks.
| | |
Many of our clients ask how they benefit from taking action and initiating a Financial Plan for themselves.
When you sign up for our CAPS program, you will get access to:
A personalized financial plan, a place to keep all of your accounts in one location and a secure place to store your important documents.
| |  | |
Did you know LPL is #1? Learn more about our partnership with LPL and how their support benefits your financial future.
*No. 1 Independent Broker-Dealer in the U.S (Based on total revenues, Financial Planning magazine 1996-2023); No. 1 provider of third-party brokerage services to banks and credit unions (2020-2021 Kehrer Bielan Research & Consulting Annual TPM Report); Fortune 500 Company as of June 2021. LPL and its affiliated companies provide financial services only from the United States.
| | | |
Do you follow us on social?
Click below to stay in the know with Cornerstone!
| | |
Important Disclosures
This material is for general information only and is not intended to provide specific advice or recommendations for any individual. There is no assurance that the views or strategies discussed are suitable for all investors or will yield positive outcomes. Investing involves risks including possible loss of principal. Any economic forecasts set forth may not develop as predicted and are subject to change.
References to markets, asset classes, and sectors are generally regarding the corresponding market index. Indexes are unmanaged statistical composites and cannot be invested into directly. Index performance is not indicative of the performance of any investment and do not reflect fees, expenses, or sales charges. All performance referenced is historical and is no guarantee of future results.
Any company names noted herein are for educational purposes only and not an indication of trading intent or a solicitation of their products or services. LPL Financial doesn’t provide research on individual equities.
All information is believed to be from reliable sources; however, LPL Financial makes no representation as to its completeness or accuracy.
All investing involves risk, including possible loss of principal.
US Treasuries may be considered “safe haven” investments but do carry some degree of risk including interest rate, credit, and market risk. Bonds are subject to market and interest rate risk if sold prior to maturity. Bond values will decline as interest rates rise and bonds are subject to availability and change in price.
The Standard & Poor’s 500 Index (S&P500) is a capitalization-weighted index of 500 stocks designed to measure performance of the broad domestic economy through changes in the aggregate market value of 500 stocks representing all major industries.
The PE ratio (price-to-earnings ratio) is a measure of the price paid for a share relative to the annual net income or profit earned by the firm per share. It is a financial ratio used for valuation: a higher PE ratio means that investors are paying more for each unit of net income, so the stock is more expensive compared to one with lower PE ratio.
Earnings per share (EPS) is the portion of a company’s profit allocated to each outstanding share of common stock. EPS serves as an indicator of a company’s profitability. Earnings per share is generally considered to be the single most important variable in determining a share’s price. It is also a major component used to calculate the price-to-earnings valuation ratio.
All index data from FactSet or Bloomberg.
This research material has been prepared by LPL Financial LLC.
| | RES-0005819-0825 | For Public Use | Tracking #802437 (Exp. 09/2026) | | | | |