|
Gordon T Long Research exclusively distributed at MATASII.com
Subscribe to Gordon T Long Research - $35 / Month - LINK
Complete MATASII.com Offerings - $55/Month - LINK
SEND YOUR INSIGHTFUL COMMENTS - WE READ THEM ALL - [email protected]
| |
|
UnderTheLens - NOVEMBER 2023
Macro Analytics - 11/06/23
| |
EXPLODING US DEBT INTEREST WILL REQUIRE MASSIVE INCREASES IN TAX REVENUES
OBSERVATIONS: YELLEN IS NOT SIMPLY A MISPLACED ACADEMIC, IT IS WORSE THAN THAT!
I recently wrote that I witnessed first hand how well retirees in Austria were so well taken care of. It was certainly an eye opener to me compared to the discussions I have had with comparable US retirees! The Austrian government clearly deserves credit for their fiduciary and financial responsibility! What did they do right?
I recall when we were in the throws of negative interest rates and zero bound how the Austrian government startled financial markets globally by issuing 100 Year Bonds. By doing this they locked in low rates and consequentially funding for multiple generations of retirees. Other countries such as Mexico and Venezuela took similar actions. What did Treasury Secretary Janet Yellen do? -- NOTHING!
Out of respect I won't criticize an elected standing US President. I do however need to point out that former US Defense Secretary and Director of the CIA for both Republic and Democratic Presidents stated that Joe Biden was on the wrong side of every policy decision during Gates long tenures. It was Joe Biden who appointed Janet Yellen as his Secretary of the Treasury and the architect of Bidenomics. Since she has never held any elected office, I feel as a professional bureaucrat she should be held to full scrutiny. Secretary Yellen is accountable for the following thinking and policy actions:
- As Chair of the Federal Reserve by extending QE, she held rates much too low for much too long. - AN ACKNOWLEDGED MISTAKE
- After Covid she stated strongly and consistently that Inflation was not a concern and would shortly be viewed as transitory. - BLATANT MISTAKE
- Yellen is responsible for the Inflation Reduction Act which she told us would require 84,000 new IRS agents within the IRA. These agents would not target tax payers making < $400K. The IRS now tells us this is simply not possible and is going to happen. - MISTAKENLY MISLEADING
- Yellen is fully responsible for US government Fiscal Policy and deficit spending, which has directly forced the Fed into the most rapid rise in rates in US history.
- Yellen recently claimed that the Q3 GDP of 4.9% was a result of a strong US economy. She is quiet now that Q4 is expected to be barely over 1% at 1.2%. A strong economy simply does not plummet like that! - BLATANTLY MISTAKEN
- Yellen claimed you "can't have a recession when Jobless claims are at these low levels". This week we see Jobless claims exploding higher, - MISTAKENLY OUT OF TOUCH
The list unfortunately goes on. As I see it, Treasury Secretary Yellen is either completely incompetent, solely a political animal, outright corrupt or an academic whose day has long passed. As an academic and professional bureaucrat with a shocking net worth of $20M, we are left to wonder whether she would actually give Social Security & Medicare the fiduciary concern it requires. She does however need to be immediately held accountable for her mistakes before Social Security and Medicare are left beyond being salvagable after her tenure ends.
This week's Yelllen'sTreasury requirements detailed US government Bonds now urgently needing to be auctioned off. The historic $1.7T requirement over the next two quarters was a shocking disruption to the financial markets. This will take US spending on a GDP basis to a level larger than needed during WWII --->>>>>
| |
 | |
THIS WEEK WE SAW
Exp=Expectations, Rev=Revision, Prev=Previous
US EMPLOYMENT
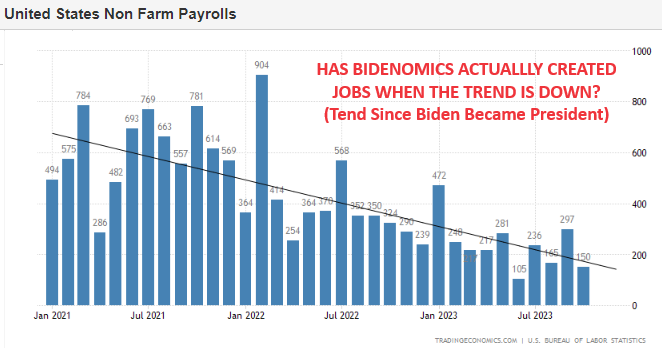
US Non-Farm Payrolls* (Oct) 150.0k vs. Exp. 180.0k (Prev. 336.0k, Rev. 297k); two-month net revisions: -101k (prev. +119k).
US Unemployment Rate* (Oct) 3.9% vs. Exp. 3.8% (Prev. 3.8%)
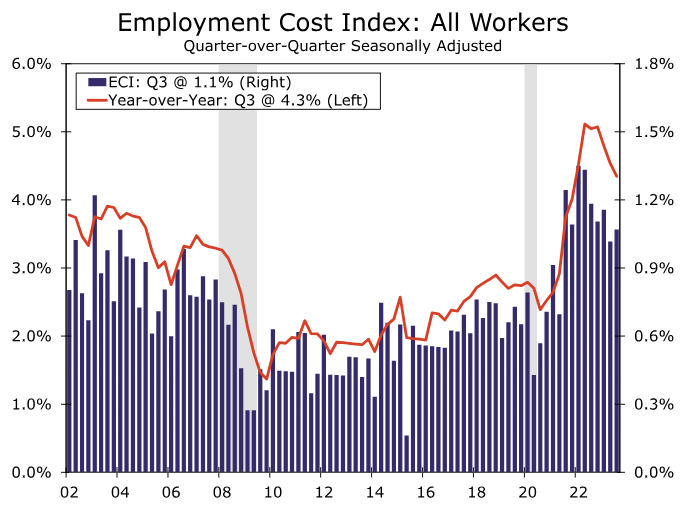
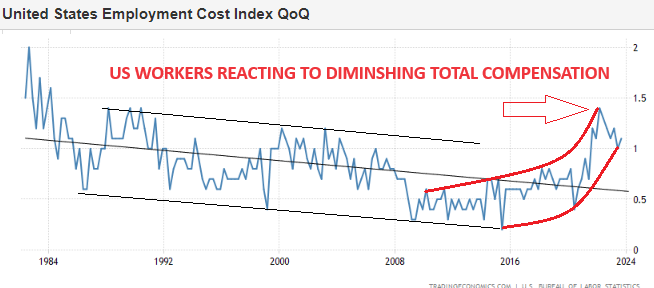
US Employment Costs (Q3) 1.1% vs. Exp. 1.0% (Prev. 1.0%)
US ISM Manufacturing Employment Index (Oct) 46.8 vs. Exp. 50.3 (Prev. 51.2)
US ADP National Employment (Oct) 113k vs. Exp. 150k (Prev. 89k)
US Initial Jobless Claims 217k vs. Exp. 210k (Prev. 210k, Rev. 212k)
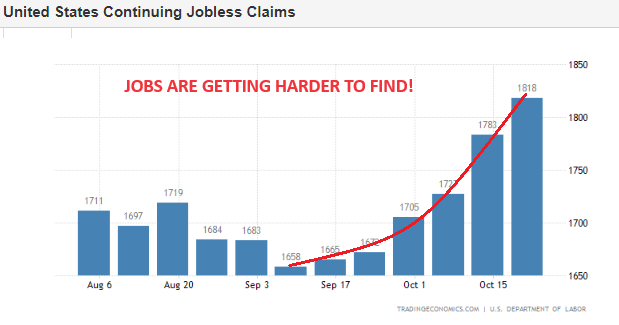
US Continued Jobless Claims 1.82M vs. Exp. 1.80M (Prev. 1.79M, Rev. 1.78M)
US MANUFACTURING
US ISM Manufacturing PMI (Oct) 46.7 vs. Exp. 49.0 (Prev. 49.0)
US ISM Manufacturing New Orders Index (Oct) 45.5 (Prev. 49.2)
GLOBAL MANUFACTURING
US S&P Global Manufacturing PMI Final (Oct) 50.0 (Prev. 50.0)
--- >>>> What we now have is war time spending in a peace time economy? Climate Change with Yellen simply parroting party lines is driving this spending crisis. Little actual detail or public communications is given for the trillions of dollars apparently needed? Just pay your taxes, don't worry about the 84,000 new IRS agents being hired and "move along"!
The fact is Yellen is on the verge of destroying the US credit rating, removing all fiscal sanity from from the governing administration and saddling the US with debt levels that are mathemtically unpayable and inexdistinquishable.
As the architect of Bidenomics, was Janet Yellen just another Biden mistake?
| |
========================= | |
|
WHAT YOU NEED TO KNOW!
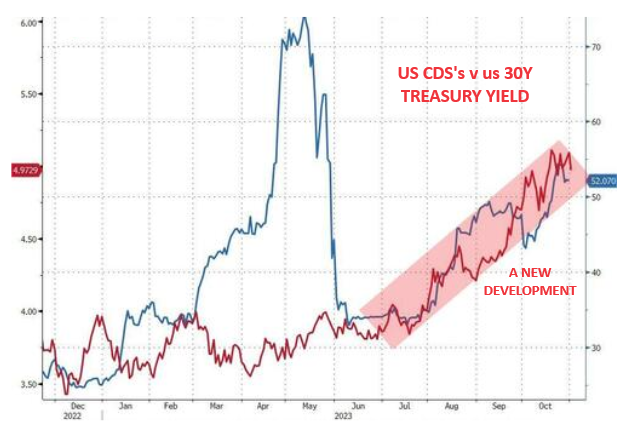
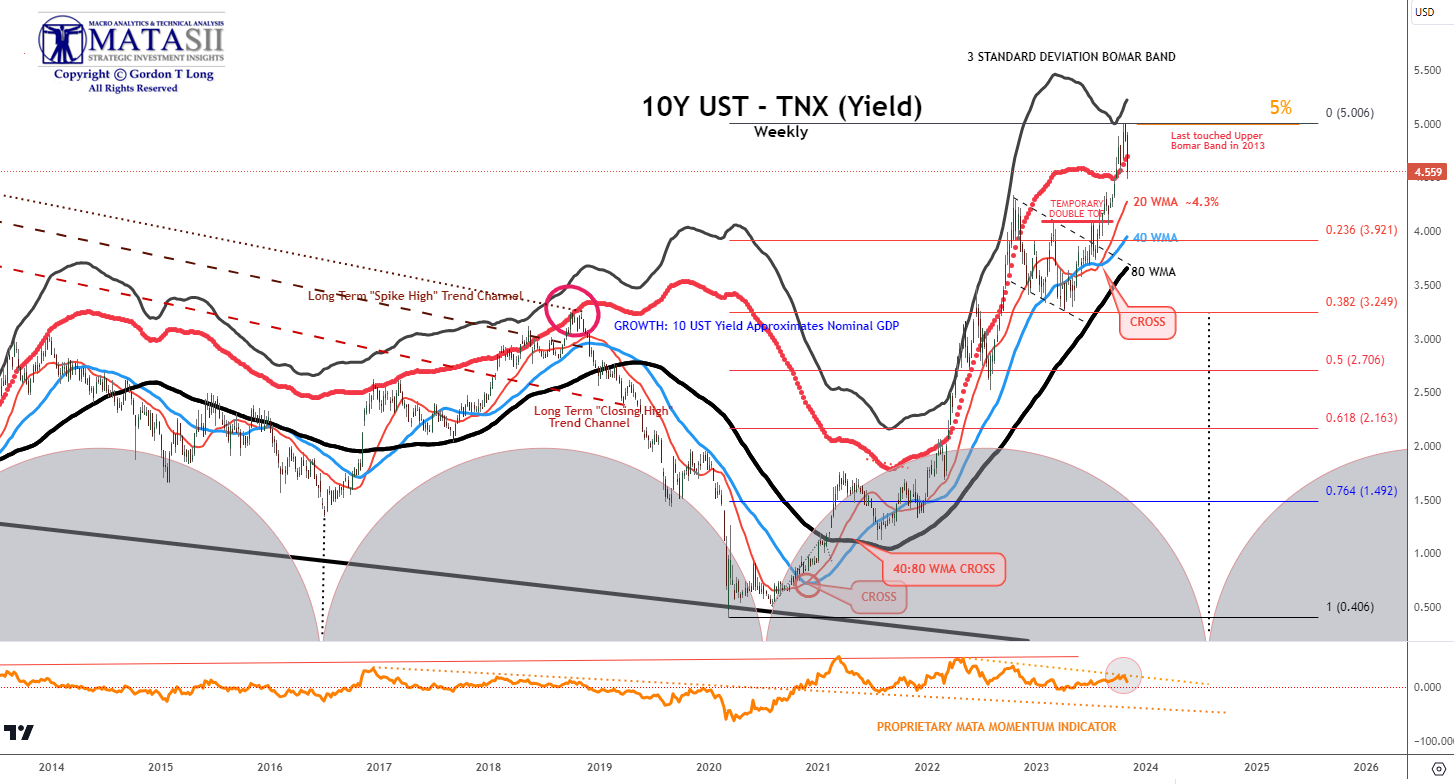
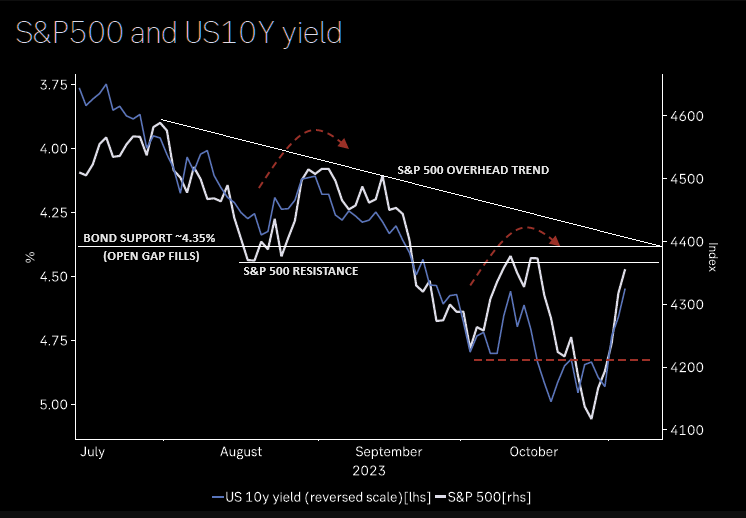
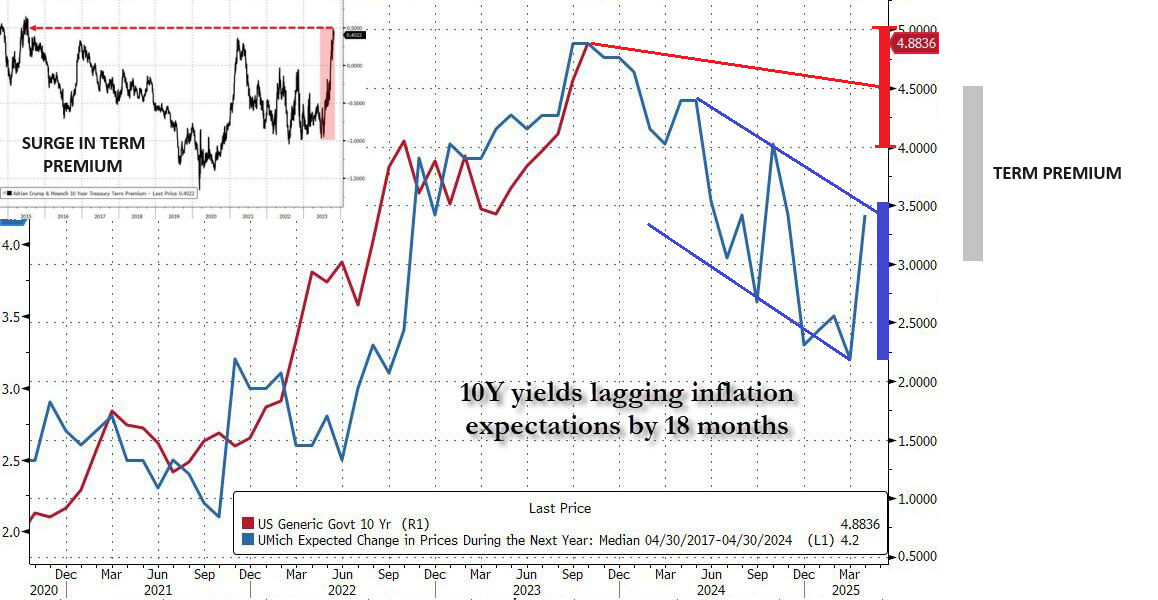
INCREASING BOND TERM PREMIUMS
Sovereign US risk is on the rise and the long-bond appears to be reflecting that 'risk' (Chart Right). This is something it has not done in the past and is an emerging development. Even Fed Chair Powell made it clear: "Longer-term rates that have moved up can’t just be a reflection of expected policy moves!"
Damn it, Janet! It is ridiculous for you to claim that higher long-end rates is due to US 'economic growth'. Someone should show you the latest Atlanta Fed's Q4 GDPNOW signal.
RESEARCH
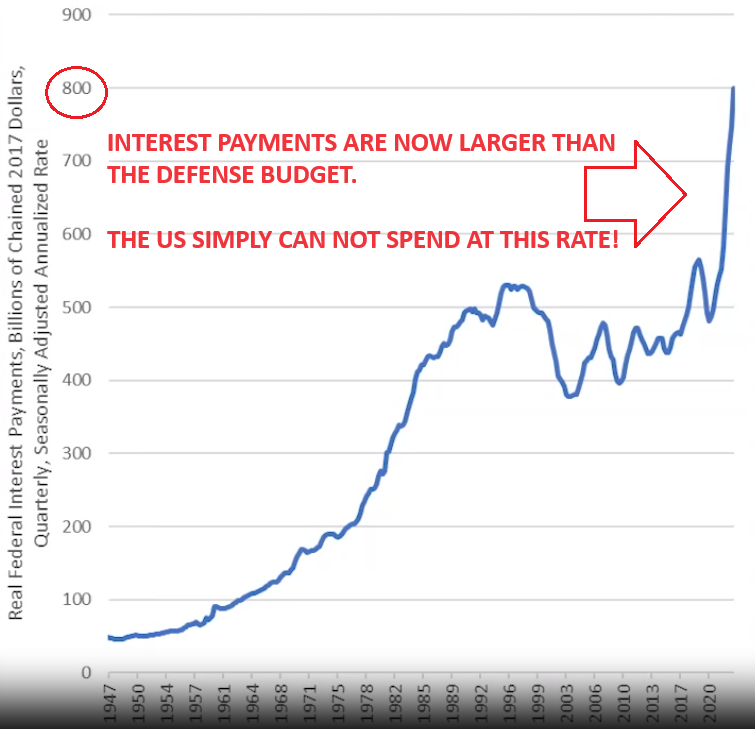
US DEBT INTEREST WILL REQUIRE MASSIVE INCREASES IN TAX REVENUES
- US Debt Interest payments have changed the funding mechanics of the nation. Rates may eventualy fall, but the new normal is well above 4% which tax revenues cannot support.
- The rapid rise in US yields to ~5% points to the government’s annual interest-rate bill rising to 4.5-5% of debt outstanding in the next six months. That’s in the region of $1.7 trillion - or the GDP of Australia - each year.
- Long Term US Term Premiums are highly llkely now to be maintained at >1.5% for the coming decade.
- There is a reason the US is hiring 84,000 IRS agents as part of the Inflation Reduction Act. Bidenomic deficit financing will require tax revenues to significantly increase.
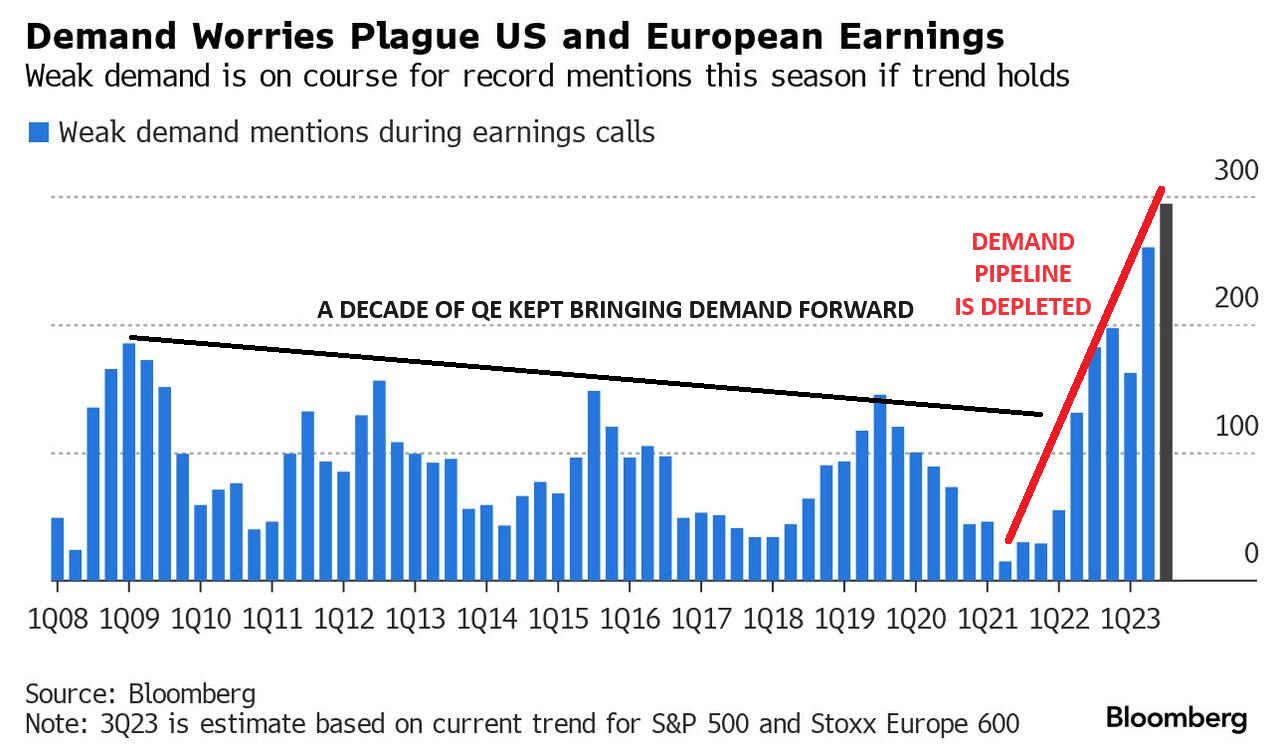
Q3 EARNINGS
- Warnings On "Weak Demand" Are Piling Up This Earnings Season.
- If the pace of mentions OF "Weak Demand" holds for the next few weeks, it would be the most on record going back to 2000.
- For Q4 2023, 48 S&P 500 companies have issued negative EPS guidance while only 27 S&P 500 companies have issued positive EPS guidance.
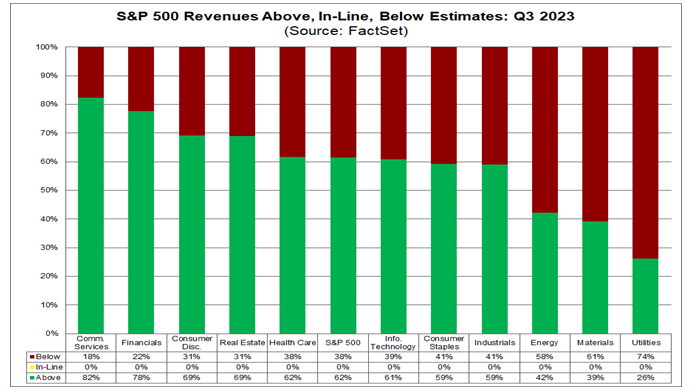
- For Q3 2023 (with 81% of S&P 500 companies reporting actual results), 82% of S&P 500 companies have reported a positive EPS surprise while tellingly only 62% of S&P 500 companies have reported a positive top line revenue surprise.
GLOBAL ECONOMIC REPORTING: What This Week's Key Global Economic Reports Tell Us?
-
US TREASURY REFUNDING ALLOCATIONS - The Treasury announced a smaller pace of increases at the quarterly refunding announcement than the prior and not surprisingly targeted more short term T-Bills, which would attract more Reverse Repo withdrawals.
-
OCTOBER'S NON-FARM PAYROLLS - The US economy added 150K jobs in October 2023, about half of a downwardly revised 297K in September, and below market forecasts of 180K. The report showed the labor market is slowly cooling as several strikes including from members of the UAW weighed on the manufacturing payrolls.
-
JOBLESS CLAIMS SPIKE - Initial jobless claims rose to a 7wk-high of 217k from 212k, and above the expected 210k, while continued claims rose above expectations to 1.818mln (exp. 1.8mln, prev. 1.783mln), the highest level in 6 months.
-
US EMPLOYMENT COST INDEX (ECI) - Q3 US Employment Costs Index rose by 1.1%, accelerating from the 1.0% prior and above the 1.0% expectation.
-
CONSUMER CONFIDENCE - US Consumer Confidence came in above expectations at 102.6 (exp. 100.0, prev. 104.3), but declined for the third consecutive month.
| |
|
DEVELOPMENTS TO WATCH
THE POST COVID GAP
This week we witnessed Continuing Jobless Claims climbing while the October Employment numbers collapsed. We have been fully expecting this as we move closer to the coming recession.
We should now be paying attention to the gap between retail sales and jobs (chart right). The current gap is likely unsustainable, because the income needed to consume came from massive government Stimulus checks, Covid Forebearance savings (deferred payments) and employment. All have come to an end. Unsurprisingly, that gap will be rectified with the coming recessionary downturn in the economy.
MORE RECESSIONARY CONFIRMATIONS
Current real-time economic data suggests the economy is rapidly moving from economic slowdown toward recession. The signals are becoming more evident from inverted yield curves to the 6-month rate of change of the Leading Economic Index.
| |
|
In this week's expanded "Current Market Perspectives", we focus on this weeks big drop in bond yields and what it is likely to mean for the stock market.
=========
| |
|
US DEBT INTEREST WILL REQUIRE MASSIVE INCREASES IN TAX REVENUES
"The rapid rise in US yields to ~5% points to the government’s annual interest-rate bill rising to 4.5-5% of debt outstanding in the next six months. That’s in the region of $1.7 trillion - or the GDP of Australia - each year."
Bloomberg
EXPECT REGULAR TAX AUDITS TO SOON BE THE NEW US NORMAL
When it was first revealed that the so-called “Inflation Reduction Act” provided funding for 84,000 new IRS agents, Biden administration officials told Americans not to worry. They promised at every turn that these agents would only be set upon those earning over $400,000 a year. But the Act has done nothing to reduce inflation, so it’s hardly surprisingly to learn now that an army of IRS agents has the middle class in its crosshairs.
In a new report, the Treasury Inspector General for Tax Administration admitted that the Treasury would not be able to accurately distinguish whether many taxpayers are above or below President Joe Biden’s $400,000 threshold. When the Inspector General recommended addressing this shortcoming, the IRS declined to do so, claiming it needs to have the “agility” to target anyone.
In fact, the IRS went so far as to reject any threshold for defining “high-income taxpayers,” calling such figures “static and overly prescriptive.” That’s a fancy way of saying that the opponents of the Inflation Reduction Act were right all along: an army of IRS agents is coming for the middle class. This directly violates President Joe Biden’s oft-repeated pledge that he would not raise taxes nor increase audits on those earning less than $400,000 a year.
| |
|
That broken promise comes as no surprise. Earlier this year, Treasury Secretary Janet Yellen was cornered into admitting that 90 percent of new audits would affect those earning less than $400,000. The new IG report confirms what Yellen was forced under oath to admit, and what many in Congress knew when they voted for the Inflation Reduction Act.
Countless middle-class Americans will now live in fear of an audit from Ms. Yellen’s henchmen, despite the hollow assurances of Mr. Biden. And the hackneyed line from the left that only tax cheats should be fearful of an audit is preposterous. The tax code is so startlingly large and complex, that no one person understands the entirety of it.
When Money magazine gave a family’s finances to 46 professional tax preparers, they received back 46 different tax returns. Yet that’s the predictable result of a tax code 4.1 million words in length. That’s longer than the Bible, War and Peace, the complete works of Shakespeare, and the entire Harry Potter series—combined.
Even those with the best of intentions are highly likely to make mistakes on their taxes, because the system is obscenely complex. That’s why Americans spend 6.5 billion manhours and $364 billion annually trying to comply with tax law. Yet countless mistakes are still made.
The IRS accused a friend of mine of making one such mistake and handed him a bill for tens of thousands of dollars in allegedly unpaid taxes, interest and fines. He took this information to his tax accountant, who informed my friend that he was 100 percent in the right and the IRS agents were wrong. But his tax attorney said to just pay the bill, because it would be less expensive than pursuing litigation.
On principle, my friend decided to take the IRS to court and he won. In fact, the IRS owed him a small refund, but the fight had cost him over $100,000. Virtually no Americans have that kind of money lying around to fight the IRS. This leaves the middle class at a severe disadvantage, because they cannot match the hordes of accountants and attorneys at the beck and call of the Biden administration.
The next couple of years will likely be perilous for the middle class. Even keeping track of all your receipts might not be enough to keep the auditors satisfied. Absent your own army of tax professions, your best defense against the IRS at this point might be to pray.
BIDENOMICS IS PROVING TO HAVE BEEN A COMPLETE FAILURE!!
SPENDING HAS HIGHLY LIKELY RESET US TERM PREMIUMS TO > 1.5% FOR THE COMING DECADE.
|  | |
|
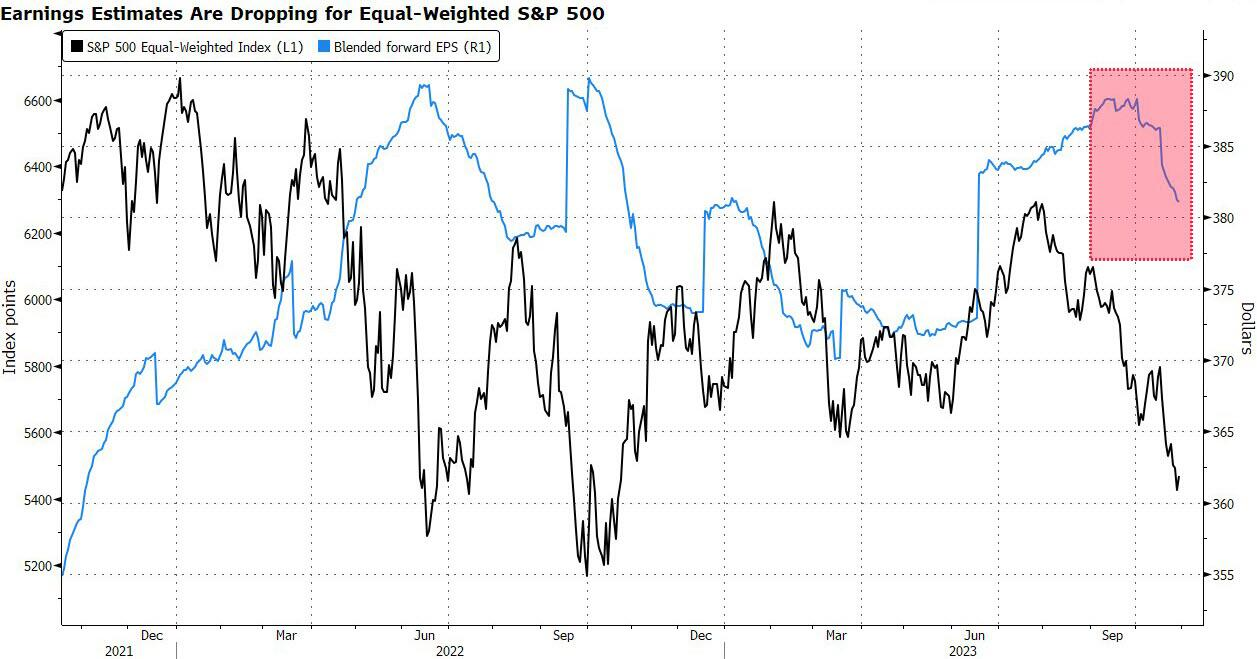
Q3 EARNINGS SEASON
While US firms are on pace to report a surprise increase in third-quarter earnings, forecasts for future quarters have been marked down as companies warned of tepid demand and an uncertain macroeconomic outlook.
At just over the half-way mark of the reporting period, “weak demand” is among the top trending phrases on earnings calls, according to a Bloomberg analysis of transcripts for the S&P 500 and the Stoxx Europe 600 benchmarks. If the pace of mentions holds for the next few weeks, it would be the most on record, according to data compiled by Bloomberg going back to 2000.
Bloomberg
|  | |
KEY METRICS (FACTSET Reporting)
Earnings Scorecard: For Q3 2023 (with 81% of S&P 500 companies reporting actual results), 82% of S&P 500 companies have reported a positive EPS surprise and 62% of S&P 500 companies have reported a positive revenue surprise.
Earnings Growth: For Q3 2023, the blended (year-over-year) earnings growth rate for the S&P 500 is 3.7%. If 3.7% is the actual growth rate for the quarter, it will mark the first quarter of year-over-year earnings growth reported by the index since Q3 2022.
Earnings Revisions: On September 30, the estimated (year-over-year) earnings decline for the S&P 500 for Q3 2023 was -0.3%. Nine sectors are reporting higher earnings today compared to September 30 due to positive EPS surprises and upward revisions to EPS estimates.
Earnings Guidance: For Q4 2023, 48 S&P 500 companies have issued negative EPS guidance and 27 S&P 500 companies have issued positive EPS guidance.
Valuation: The forward 12-month P/E ratio for the S&P 500 is 17.8. This P/E ratio is below the 5-year average (18.7), but above the 10-year average (17.5).
|  | |
|
GLOBAL ECONOMIC INDICATORS: What This Week's Key Global Economic ReleasesTell Us
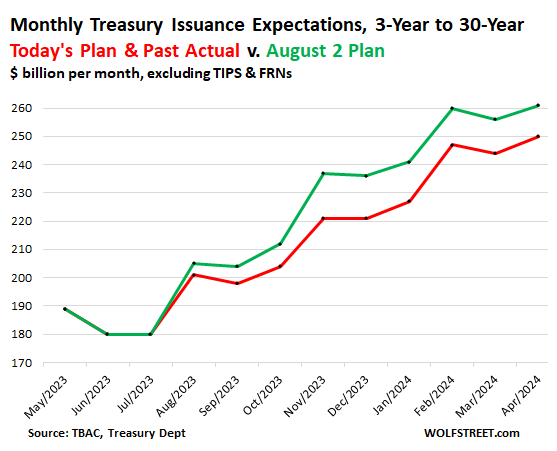
US TREASURY REFUNDING ALLOCATIONS
The Treasury announced a smaller pace of increases at the quarterly refunding announcement than the prior and not surprisingly targeted more short term T-Bills, which would attract more Reverse Repo withdrawals.
Wolf Richter for WOLF STREET.
Tsunami of Treasury Issuance Will Shift from Longer-Term Debt to Short-Term T-Bills & 2-Year Notes amid Intense Navel-Gazing about Spiking 10-Year Yield.
There was a lot of navel-gazing in the “Quarterly Refunding” documents released today and on Monday by the US Treasury Department about the explosive surge of the 10-year Treasury yield.
These documents project how much in marketable debt the government will have to issue to refinance maturing debt and add new debt to fund the ballooning deficits in Q4 2023 and Q1 2024.
The total amounts were released on Monday — $776 billion in Q4 and $816 billion in Q1 to be added to the marketable debt. Today, the details were released, including to what extent that new debt will be composed of longer-term notes and bonds.
There was a lot of navel-gazing, because the last Quarterly Refunding documents released on August 2 and the expectations of that info in the month before had triggered a 120-basis point surge in the 10-year yield from about 3.8% in early July to 5% briefly on October 23, which was quite a spectacle. And that had apparently rattled the government’s nerves.
So the recommendations today by the Treasury Borrowing Advisory Committee (TBAC) de-emphasized the issuance of longer-term securities, particularly those ranging from 7-year notes to 30-year bonds.
And instead, the recommendations shifted more weight to short-term Treasury bills (1 month to 1 year) and to 2-year notes and 5-year notes, which respectively increased by $11 billion and $10 billion over the next six months in today’s plan compared to the August 2 plan for the same period.
The chart (above) shows the TBAC’s issuance recommendations for 3-year notes through 30-year bonds, not including TIPS and FRNs, in today’s documents (red line), and the documents released on August 2 (green line). Issuance of those 3-year notes through 30-year bonds will still balloon, but less than projected on August 2.
OK, so T-bills out the wazoo. TBAC figured that the shift to T-bill issuance will cause the amount of T-bills outstanding to balloon by $460 billion in Q4 and by an additional $586 billion in Q1, or by a combined $1.05 trillion in just two quarters!
At the end of Q3, there were $5.26 trillion in T-bills outstanding. The additional issuance in Q4 and Q1 would increase the total by 20% to $6.31 trillion. At the end of Q3, T-bills accounted for 20% of marketable Treasury
securities outstanding. By the end of Q1 2024, the share of T-bills would rise to 23%.
| |
OCTOBER'S NON-FARM PAYROLLS
The US economy added 150K jobs in October 2023, about half of a downwardly revised 297K in September and below market forecasts of 180K.
The report showed the labour market is slowly cooling as several strikes including from members of the UAW weighed on the manufacturing payrolls.
- Job gains occurred in health care (58K), namely ambulatory health care services (32K) and hospitals (18K); government (51K), which has returned to its pre-pandemic February 2020 level, construction (23K), social assistance (19K), leisure and hospitality (19K), and professional and business services (15K).
- On the other hand, employment in manufacturing declined by 35K, way more than forecasts of a 10K fall, reflecting a 33K drop in motor vehicles and parts that was largely due to strike activity.
- Payrolls in October were also below the average monthly gain of 258K over the prior 12 months, but remain well above the 70K-100K needed per month to keep up with the growth in the working-age population. (source: U.S. Bureau of Labor Statistics)
| |
|
JOBLESS CLAIMS SPIKE
- US Initial Jobless Claims 217.0k vs. Exp. 210.0k (Prev. 210.0k, Rev. 212k)
- US Continued Jobless Claims 1.82M vs. Exp. 1.80M (Prev. 1.79M, Rev. 1.78M)
Initial jobless claims rose to a 7wk-high of 217k from 212k, and above the expected 210k, while continued claims rose above expectations to 1.818mln (exp. 1.8mln, prev. 1.783mln), the highest level in 6 months.
- The 217k initial claim print in the latest week took the 4wk average up to 210k from 208k.
- Note, that the seasonal factors had expected a 1.484k decline.
- On continued claims, Oxford Economics note, “the upturn suggests that, while the labor market may be characterized by few job losses, unemployed individuals are finding it more difficult to find new jobs, which would be consistent with a slower pace of hiring”.
| |
|
US EMPLOYMENT COST INDEX (ECI):
- US Employment Costs (Q3) 1.1% vs. Exp. 1.0% (Prev. 1.0%)
Q3 US Employment Costs Index rose by 1.1%, accelerating from the 1.0% prior and above the 1.0% expectation.
- Y/Y, it rose by 4.3% vs the Q2 Y/Y of 4.5%.
- Wages and salaries rose by 1.2% M/M from 1.0%, with the Y/Y at 4.6% once again.
- Benefits rose by 0.9%, matching the prior 0.9% increase, with the Y/Y easing to 4.1% from 4.2% Q/Q.
- The Employment Cost Index is something that the Fed examine carefully, given the implications of wages to inflation, although some on the Fed, particularly the doves, stress that wages are backwards-looking and lag inflation, not the other way round.
- Nonetheless, while this does not alter expectations for near-term rate moves, it does not support declaring a peak in rates either, with the Fed widely expected to keep rates unchanged on Wednesday, but they will likely aim to keep optionality in further rate hikes.
|  | |
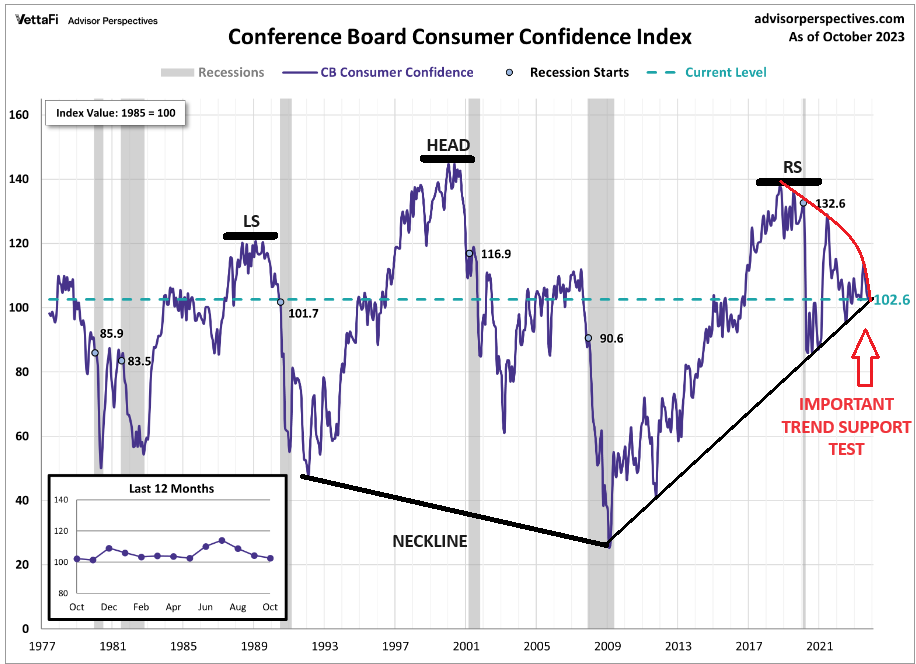
CONSUMER CONFIDENCE:
- US Consumer Confidence (Oct) 102.6 vs. Exp. 100.0 (Prev. 103.0, Rev. 104.3)
US Consumer Confidence came in above expectations at 102.6 (exp. 100.0, prev. 104.3), but declined for the third consecutive month.
- The present situation and expectations indices dipped to 143.1 (prev. 146.2) and 75.6 (prev. 76.4), respectively. Looking at jobs, hard-to get dropped to 13.1% (prev. 14.2%), while plentiful inched lower to 39.4% (prev. 39.7%).
- On inflation expectations, 12-month ahead for October lifted to 5.9% from 5.7%. Within the report it adds, “Write-in responses showed that consumers continued to be preoccupied with rising prices in general, and for grocery and gasoline prices in particular.”
- In addition, consumers also expressed concerns about the political situation and higher interest rates, while worries around war/conflicts also rose, amid the recent turmoil in the Middle East.
- Overall, “the decline in consumer confidence was evident across householders aged 35 and up, and not limited to any one income group.”
| |
|
GLOBAL MACRO
WHAT DOES YOUR SCAN OF THE DATA BELOW TELL YOU? - THE MEDIA AVOIDS BAD NEWS!
We present the data in a way you can quickly see what is happening.
THIS WEEK WE SAW
Exp=Expectations, Rev=Revision, Prev=Previous
| |
|
UNITED STATES
- US Dallas Fed Manufacturing Business Index (Oct) -19.2 (Prev. -18.1)
- US Consumer Confidence (Oct) 102.6 vs. Exp. 100.0 (Prev. 103.0, Rev. 104.3)
-
US Employment Costs (Q3) 1.1% vs. Exp. 1.0% (Prev. 1.0%)
- US CaseShiller 20 MM SA (Aug) 1.0% vs. Exp. 0.7% (Prev. 0.9%, Rev. 0.8%)
- US CaseShiller 20 YY NSA (Aug) 2.2% vs. Exp. 1.6% (Prev. 0.1%, Rev. 0.2%)
-
US S&P Global Manufacturing PMI Final (Oct) 50.0 (Prev. 50.0)
-
US ISM Manufacturing PMI (Oct) 46.7 vs. Exp. 49.0 (Prev. 49.0)
-
US ISM Manufacturing New Orders Index (Oct) 45.5 (Prev. 49.2)
-
US ISM Manufacturing Employment Index (Oct) 46.8 vs. Exp. 50.3 (Prev. 51.2)
- US ISM Manufacturing Prices Paid (Oct) 45.1 vs. Exp. 45.0 (Prev. 43.8)
- US Construction Spending MM (Sep) 0.4% vs. Exp. 0.4% (Prev. 0.5%, Rev. 1.0%)
-
US ADP National Employment (Oct) 113k vs. Exp. 150k (Prev. 89k)
- US JOLTS Job Openings (Sep) 9.55M vs. Exp. 9.25M (Prev. 9.61M, Rev. 9.50M)
- US Factory Orders MM (Sep) 2.8% vs. Exp. 2.4% (Prev. 1.2%, Rev. 1.0%)
-
US Initial Jobless Claims 217k vs. Exp. 210k (Prev. 210k, Rev. 212k)
-
US Continued Jobless Claims 1.82M vs. Exp. 1.80M (Prev. 1.79M, Rev. 1.78M)
- US Unit Labor Costs (Q3 P) -0.8% vs. Exp. 0.7% (Prev. 2.2%, Rev. 3.2%)
- US Factory Orders MM (Sep) 2.8% vs. Exp. 2.4% (Prev. 1.2%, Rev. 1.0%)
- US Initial Jobless Claims 217.0k vs. Exp. 210.0k (Prev. 210.0k, Rev. 212k)
- US Productivity (Q3 P) 4.7% vs. Exp. 4.1% (Prev. 3.5%, Rev. 3.6%)
- US Challenger Layoffs (Oct) 36.836k (Prev. 47.457k)
-
US Non-Farm Payrolls* (Oct) 150.0k vs. Exp. 180.0k (Prev. 336.0k, Rev. 297k); two-month net revisions: -101k (prev. +119k).
- US Unemployment Rate* (Oct) 3.9% vs. Exp. 3.8% (Prev. 3.8%)
- US Average Earnings YY* (Oct) 4.1% vs. Exp. 4.0% (Prev. 4.2%, Rev. 4.3%).
- US ISM N-Manufacturing Price Paid Index (Oct) 58.6 (Prev. 58.9)
- US ISM N-Manufacturing Business Act (Oct) 54.1 (Prev. 58.8)
- US ISM N-Manufacturing New Orders Index (Oct) 55.5 (Prev. 51.8)
- US S&P Global Comp Final PMI (Oct) 50.7 (Prev. 51)
- US S&P Global Services PMI Final (Oct) 50.6 (Prev. 50.9)
CHINA
- Chinese NBS Manufacturing PMI (Oct) 49.5 vs. Exp. 50.2 (Prev. 50.2)
- Chinese NBS Non-Manufacturing PMI (Oct) 50.6 vs. Exp. 51.8 (Prev. 51.7)
- Chinese Composite PMI (Oct) 50.7 (Prev. 52.0)
- Chinese Caixin Manufacturing PMI Final (Oct) 49.5 vs. Exp. 50.8 (Prev. 50.6)
- Chinese Caixin Services PMI (Oct) 50.4 vs. Exp. 51.2 (Prev. 50.2)
- Chinese Caixin Composite PMI (Oct) 50.0 (Prev. 50.9)
JAPAN
- Japanese Industrial Production MM (Sep P) 0.2% vs. Exp. 2.5% (Prev. -0.7%)
- Japanese Retail Sales YY (Sep) 5.8% vs. Exp. 5.9% (Prev. 7.0%)
- Japanese Unemployment Rate (Sep) 2.6% vs. Exp. 2.6% (Prev. 2.7%)
SOUTH KOREA
- South Korean CPI MM (Oct) 0.3% vs. Exp. 0.2% (Prev. 0.6%)
- South Korean CPI YY (Oct) 3.8% vs. Exp. 3.6% (Prev. 3.7%)
| |  |
|
EU
- EU Business Climate (Oct) -0.33 (Prev. -0.36, Rev. -0.35)
- EU Consumer Confidence Final (Oct) -17.9 vs. Exp. -17.9 (Prev. -17.9)
- EU Economic Sentiment (Oct) 93.3 vs. Exp. 93.0 (Prev. 93.3, Rev. 93.4)
- EU Services Sentiment (Oct) 4.5 vs. Exp. 3.4 (Prev. 4.0, Rev. 4.1)
- EU Industrial Sentiment (Oct) -9.3 vs. Exp. -9.5 (Prev. -9.0, Rev. -8.9)
- EU GDP Flash Prelim QQ (Q3) -0.1% vs Exp. 0.0% (Prev. 0.1%)
- EU GDP Flash Prelim YY (Q3) 0.1% vs. Exp. 0.2% (Prev. 0.5%)
- EU HICP Flash YY (Oct) 2.9% vs. Exp. 3.1% (Prev. 4.3%)
- EU HICP-X F&E Flash YY (Oct) 5.0% vs. Exp. 5.1% (Prev. 5.5%)
- EU HCOB Manufacturing Final PMI (Oct) 43.1 vs. Exp. 43 (Prev. 43); German HCOB Manufacturing PMI (Oct) 40.8 vs. Exp. 40.7 (Prev. 40.7)
GERMANY
- German GDP Flash QQ SA (Q3) -0.1% vs. Exp. -0.3% (Prev. 0.0%)
- German GDP Flash YY SA (Q3) -0.3% vs. Exp. -0.7% (Prev. -0.2%)
- German CPI Prelim MM (Oct) 0.0% vs. Exp. 0.2% (Prev. 0.3%)
- German CPI Prelim YY (Oct) 3.8% vs. Exp. 4.0% (Prev. 4.5%)
- German Unemployment Change SA (Oct) 30.0k vs. Exp. 15.0k (Prev. 10.0k); Rate SA (Oct) 5.8% vs. Exp. 5.8% (Prev. 5.7%)
- German Unemployment Total NSA (Oct) 2.607M vs. Exp. 2.59M (Prev. 2.627M)
UK
- UK BRC Shop Price Index YY (Oct) 5.2% (Prev. 6.2%)
- UK S&P Global/CIPS Manufacturing PMI Final (Oct) 44.8 vs. Exp. 45.2 (Prev. 45.2)
AUSTRALIA
- Australian Building Approvals (Sep) -4.6% vs. Exp. 1.3% (Prev. 7.0%, Rev. 8.1%)
- Australian Manufacturing PMI (Oct F) 48.2 (Prelim. 48.0)
- Australian AIG Manufacturing Index (Oct) -20.9 (Prev. -12.8)
- Australian AIG Construction Index (Oct) 18.5 (Prev. 7.1)
- Australian Trade Balance (AUD)(Sep) 6.8B vs. Exp. 9.4B (Prev. 9.64B)
- Australian Exports MM (Sep) -1.4% (Prev. 4.0%)
- Australian Imports MM (Sep) 7.5% (Prev. 0.0%)
- Australian Retail Trade (Q3) 0.2% vs. Exp. -0.2% (Prev. -0.5%)
NEW ZEALAND
- New Zealand ANZ Business Confidence (Oct) 23.4 (Prev. 1.5)
- New Zealand ANZ Activity Outlook (Oct) 23.1 (Prev. 10.9)
- New Zealand HLFS Job Growth QQ (Q3) -0.2% vs. Exp. 0.4% (Prev. 1.0%)
- New Zealand HLFS Unemployment Rate (Q3) 3.9% vs. Exp. 3.9% (Prev. 3.6%)
- New Zealand HLFS Participation Rate* (Q3) 72.0% vs. Exp. 72.5% (Prev. 72.4%)
- New Zealand Labour Cost Index QQ (Q3) 0.8% vs. Exp. 1.0% (Prev. 1.1%)
- New Zealand Labour Cost Index YY (Q3) 4.1% vs. Exp. 4.2% (Prev. 4.3%)
CANADA
- Canadian Unemployment Rate* (Oct) 5.7% vs. Exp. 5.6% (Prev. 5.5%)
| |
|
DEVELOPMENTS TO WATCH
THE POST COVID GAP
This week we witnessed Continuing Jobless Claims climbing while the October Employment numbers collapsed. We have been fully expecting this as we move closer to the coming recession.
We should now be paying attention to the gap between retail sales and jobs (chart right). The current gap is likely unsustainable, because the income needed to consume came from massive government Stimulus checks, Covid Forebearance savings (deferred payments) and employment has come to an end. Unsurprisingly, that gap will be rectified with the coming recessionary downturn in the economy.
| |
|
MORE RECESSIONARY CONFIRMATIONS
When we look at the unemployment rate versus real GDP, it is historically normal to see signs of a strong jobs market via low unemployment numbers. This is the cyclical high that normally warns of a coming recessionary onset (Chart Right).
Current real-time economic data suggests the economy is rapidly moving from economic slowdown toward recession. The signals are becoming more evident from inverted yield curves to the 6-month rate of change of the Leading Economic Index.(Chart Below)
| |
CURRENT MARKET PERSPECTIVE | |
|
A DRAMATIC RESET IN YIELD EXPECTATIONS!
YIELD MOVES LIKE THIS DON'T NORMALLY HAPPEN?
Click All Charts to Enlarge
| |
|
1 - SITUATIONAL ANALYSIS
AN 'EXPECTATIONS' RESET
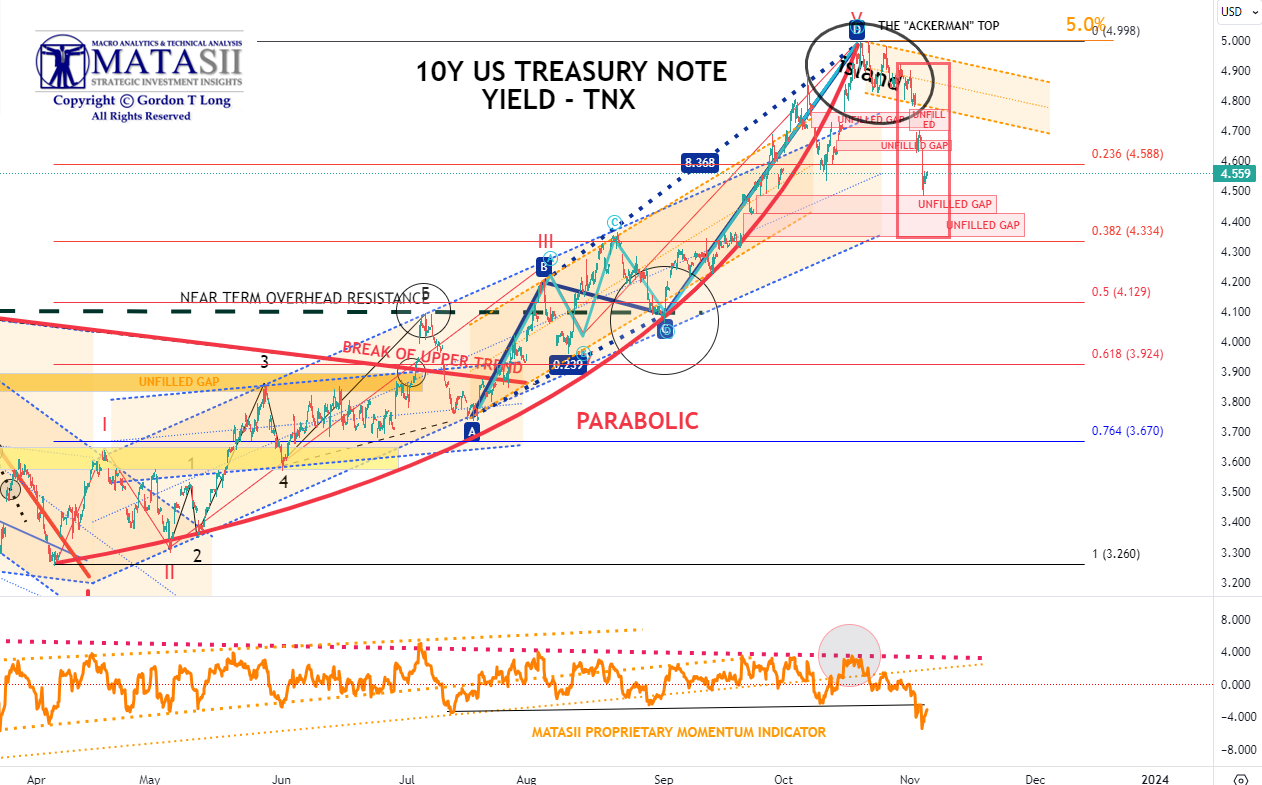
This week bond yields collapsed as Bond prices shot up on shifting expectations that the economy is worse than previously thought! This sort of dramatic reaction doesn't normally happen in the bond market that has been compared to watching paint dry!
The 5-day decline in US 10YR yields was large enough that it would have been the 2nd largest decline of the decade (only preceeded by Covid).
10Y US TREASURY - HOURLY "TNX"
The 10Y US Treasury "Gapped" lower leaving an "Island Formation" behind. If the Island Formation is not closed by filling Friday's gap lower, then Yields have began a new trend - lower! Lower rates are normally the "tailwind" a rising equity market requires.
| |
|
YOUR DESK TOP / TABLET / PHONE ANNOTATED CHART
Macro Analytics Chart Above: SUBSCRIBER LINK
| |
|
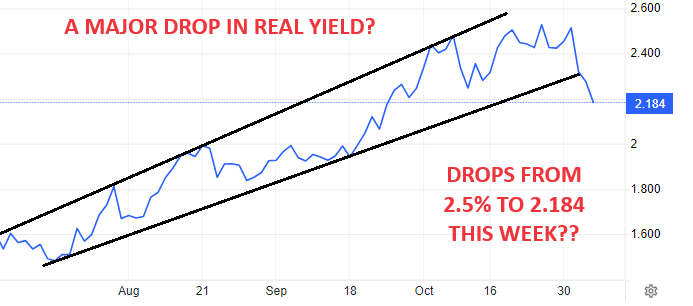
REAL YIELDS HAVE PLUNGED FROM ~2.5% to 2.184% (Chart Right)
ADDITIONALLY:
- We witnessed the best week of the year for both stocks and bonds,
- TheS&P 500 surged 5.9% for the week which was the best since November 2022,
- Global stocks saw their biggest 5-day gain since early January,
- We saw the 2nd worst week of the year for the dollar.
WHY??? THE CONSENSUS THINKING SHIFTED:
- The disappointing October Non-Farm Payrolls at 150 new jobs was seen Friday as a trigger to the market after:
- Tuesday's Treasury Auction details showing higher levels of short duration T-Bills than expected,
- Wednesday's dovish FOMC Meeting and then
- Thursday's rising Jobless Claims.
- The probability of a rate hike at the upcoming December FOMC meeting was consequentially taken down to 5% from 47% a month ago.
- Expectations for 2024 Fed rate-cuts were propelled dramatically higher, from 67bps of cuts to 110bps next year,
- The market shifted to expecting the rate cutting cycle to start a month earlier, May 2024 instead of June 2024.
- Additionally, we saw the largest one day bout of easing in GS Financial Conditions since Nov 10th last year, the big CPI rally day.
WHAT WE THINK:
WE SMELL SOMETHING IS ABOUT TO HAPPEN TO IGNITE THE JAPANESE CARRY TRADE.
WHAT BROKE BEHIND THE SCENES IS JAPAN'S CONTROL OF ITS MONETARY POLICY.
THIS WOULD BE GOOD FOR US BONDS AND EQUITIES.
| |
|
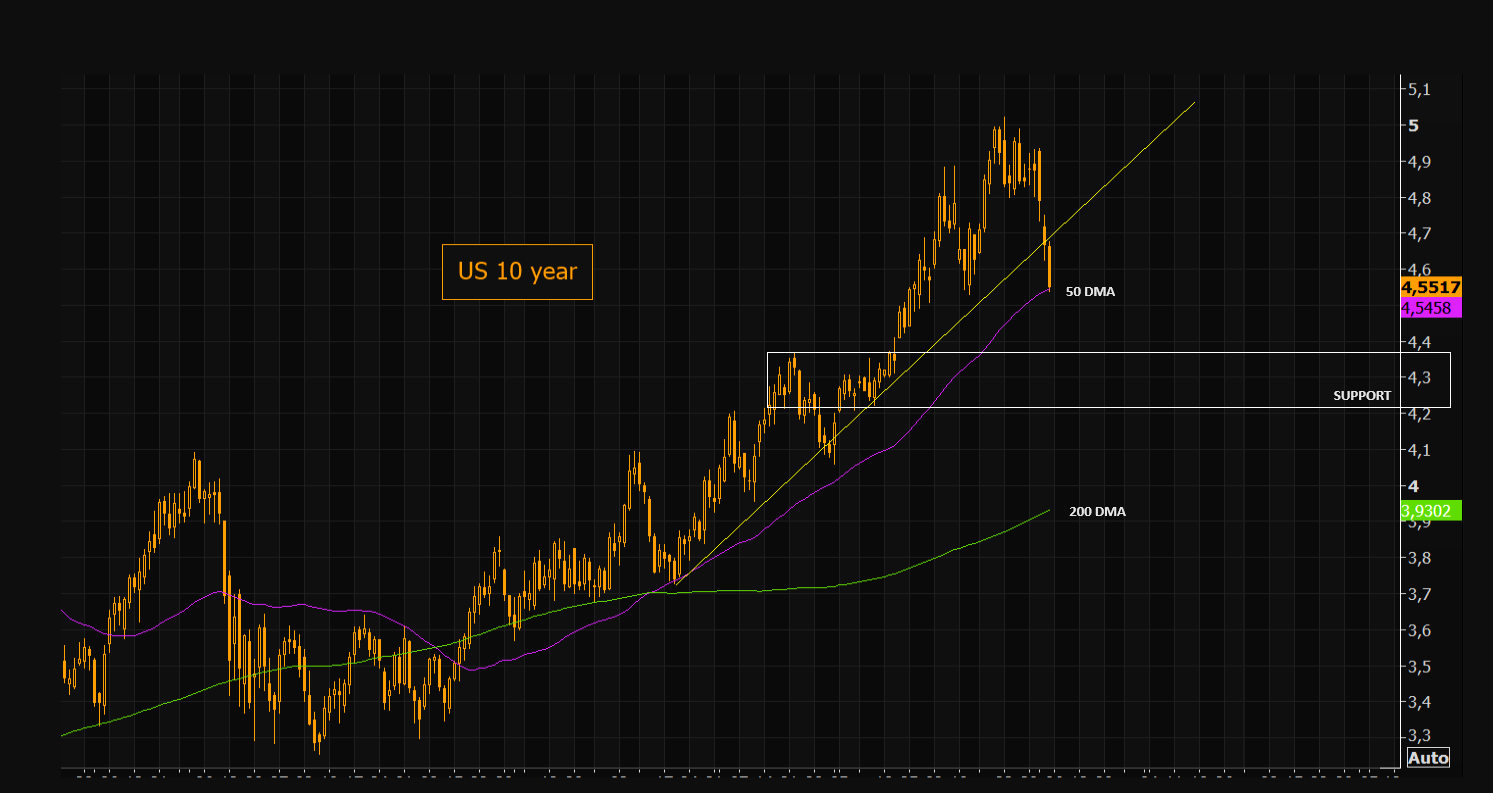
10Y US TREASURY - DAILY "TNX"
The 10Y US Treasury found support in the buying surge at its 50 Day Moving Average. (Chart Right)
The US 10 year broke through and well below its short term trend line, hitting the 50 day.
There is small support here, but the bigger support is down around 4.3%.
Note that the 200 day remains way lower, down around 3.95%.
10Y US TREASURY - WEEKLY "TNX"
| Harder support can be found at the 20 WMA, which currently approximates 4.30. | |
|
YOUR DESK TOP / TABLET / PHONE ANNOTATED CHART
Macro Analytics Chart Above: SUBSCRIBER LINK
| |
|
Though all this can be seen as Bullish we see it as transitory and at best is an early start to the seasonal Santa Claus Rally.
However other factors must be seriously considered.
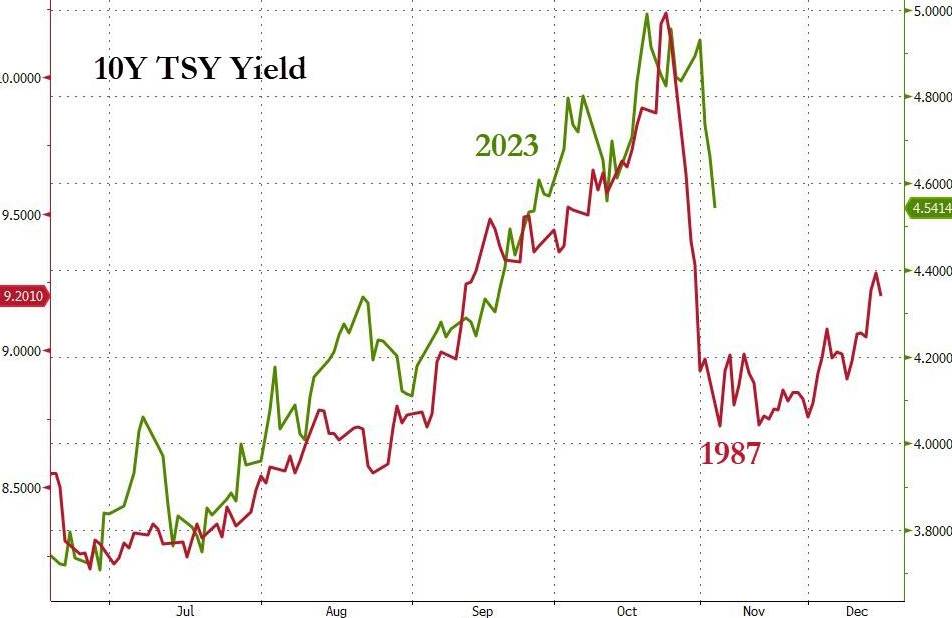
WE HAVE SEEN THIS BEFORE
-
1987 - it's not just stocks that crashed in 1987. Bond yields collapsed too. (Chart Right)
-
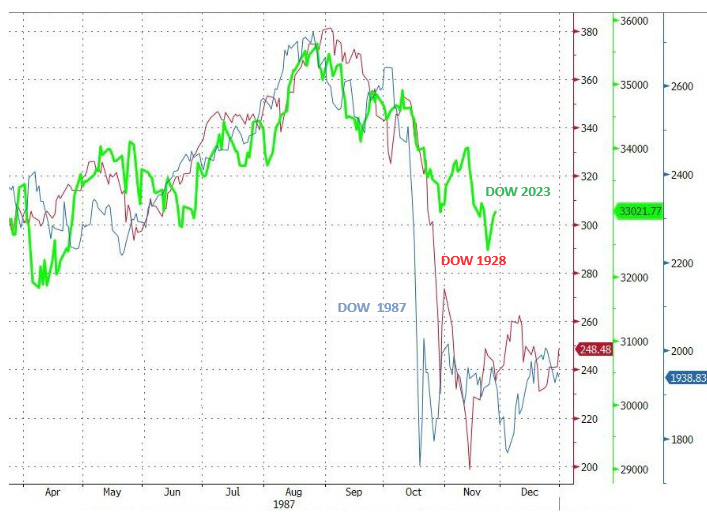
1928 &1987 - BLACK MONDAYS (Chart Below)
| |
|
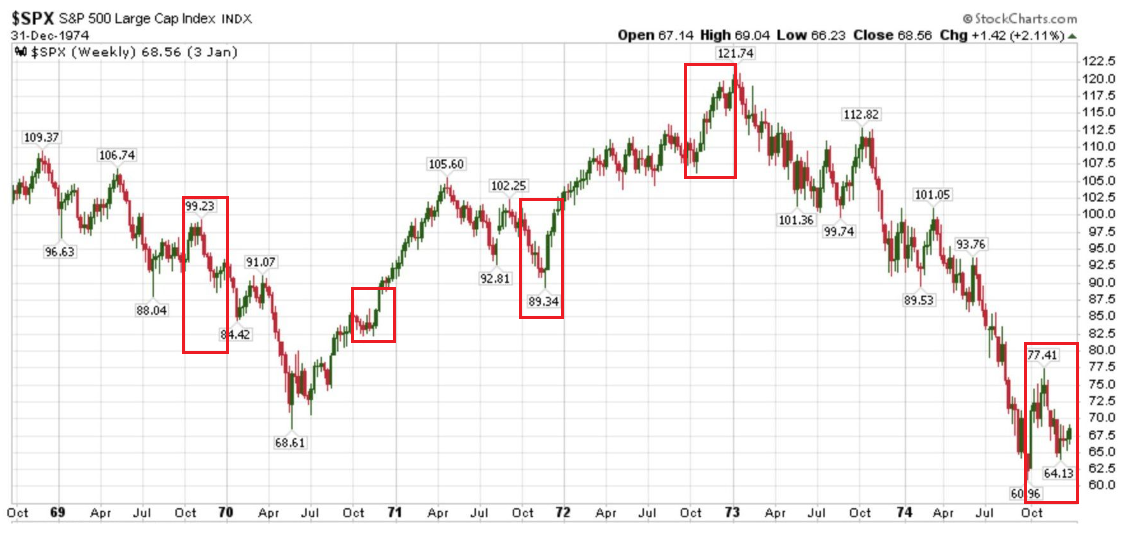
EQUITIES OFTEN FELL IN Q4 IN THE 1970'S
Don't rely on the Q4 seasonal trend that Wall Street keeps hyping. The statistics they use only starts in from the 1980's. During a similar Inflation era in the 1970's, the equity markets performed differently as did their relationship with Bonds. The 60:40 Parity Investing Game did not exist. NOTE: We always got a Santa Claus Rally, but its start day varied and followed a falling market.
| |
|
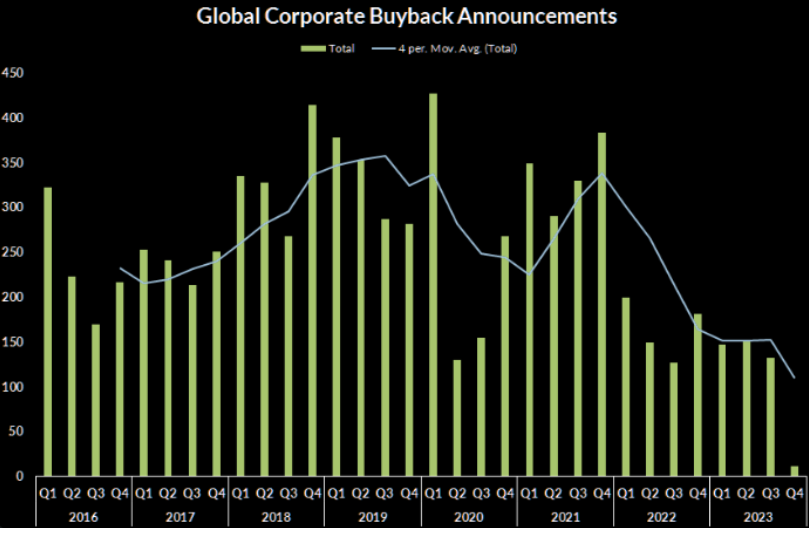
S&P 500 - Daily
BUYBACKS (Chart Right) - The global buyback count has been weak lately. Corporate CFO's are expectantly perserving cash! This week's surge in equities in part can be accounted for by corporate buyback announcements being executed as corporations come out of the blackout window associated with their earnings releases and earnings calls.
$5bn per day should now be considerd a distant memory!
CHART BELOW
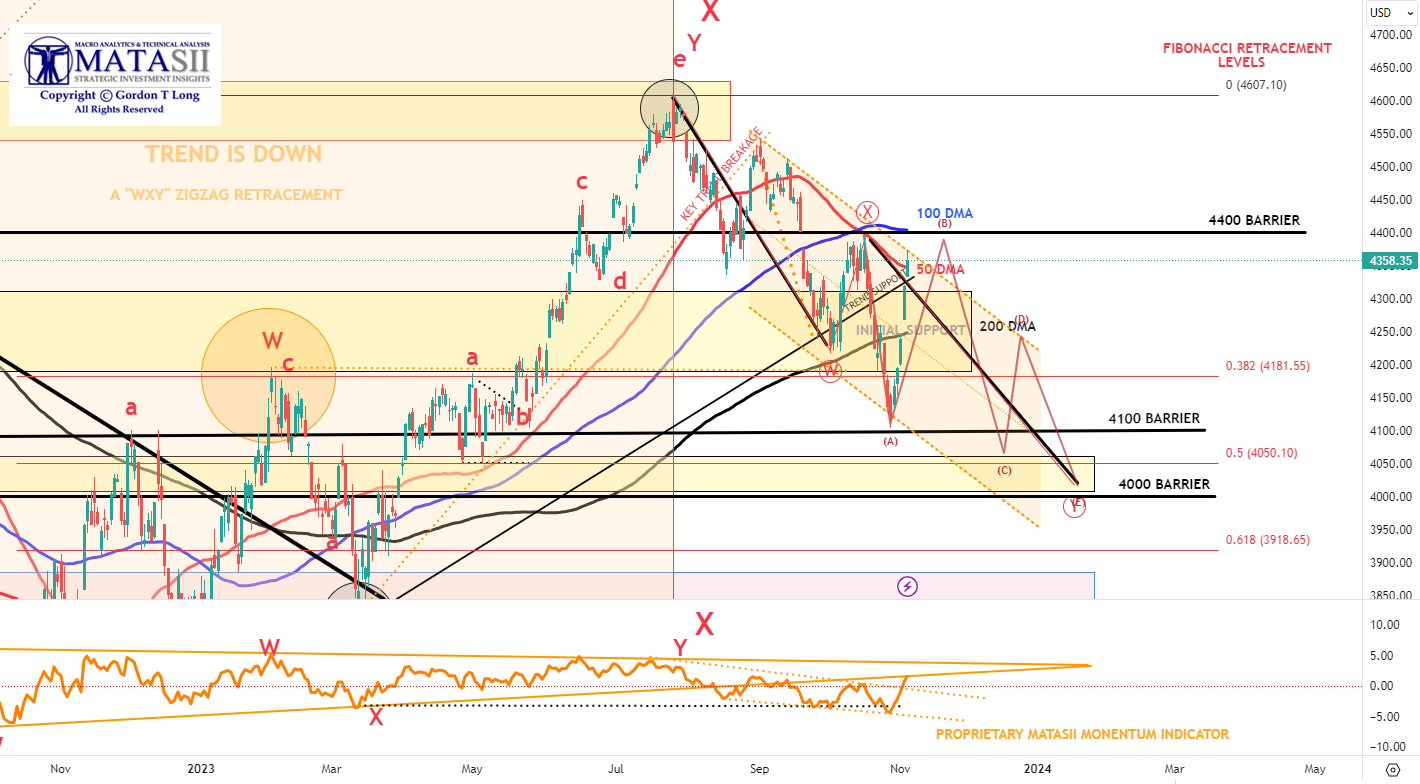
THE CRITICAL BOND - EQUITY MARKET REALATIONSHIP - THE S&P 500'S 4400 RESISTANCE LEVEL
| |
|
S&P 500 - DAILY
UNTIL THE EQUITY MARKETS DECISIVELY BREAK THE 4400 S&P 500 LEVEL THIS RISE MUST BE CONSIDERED AN EXPECTED COUNTER RALLY FROM AN OVERSOLD MARKET.
A BREAK OF 4400 & YEAR END LIFT MUST BE SEEN TO BE PART OF A FALLING EQUITY MARKET WHICH WILL RESUME IN EARLY 2024.
| |
|
YOUR DESK TOP / TABLET / PHONE ANNOTATED CHART
Macro Analytics Chart Above: SUBSCRIBER LINK
| |
|
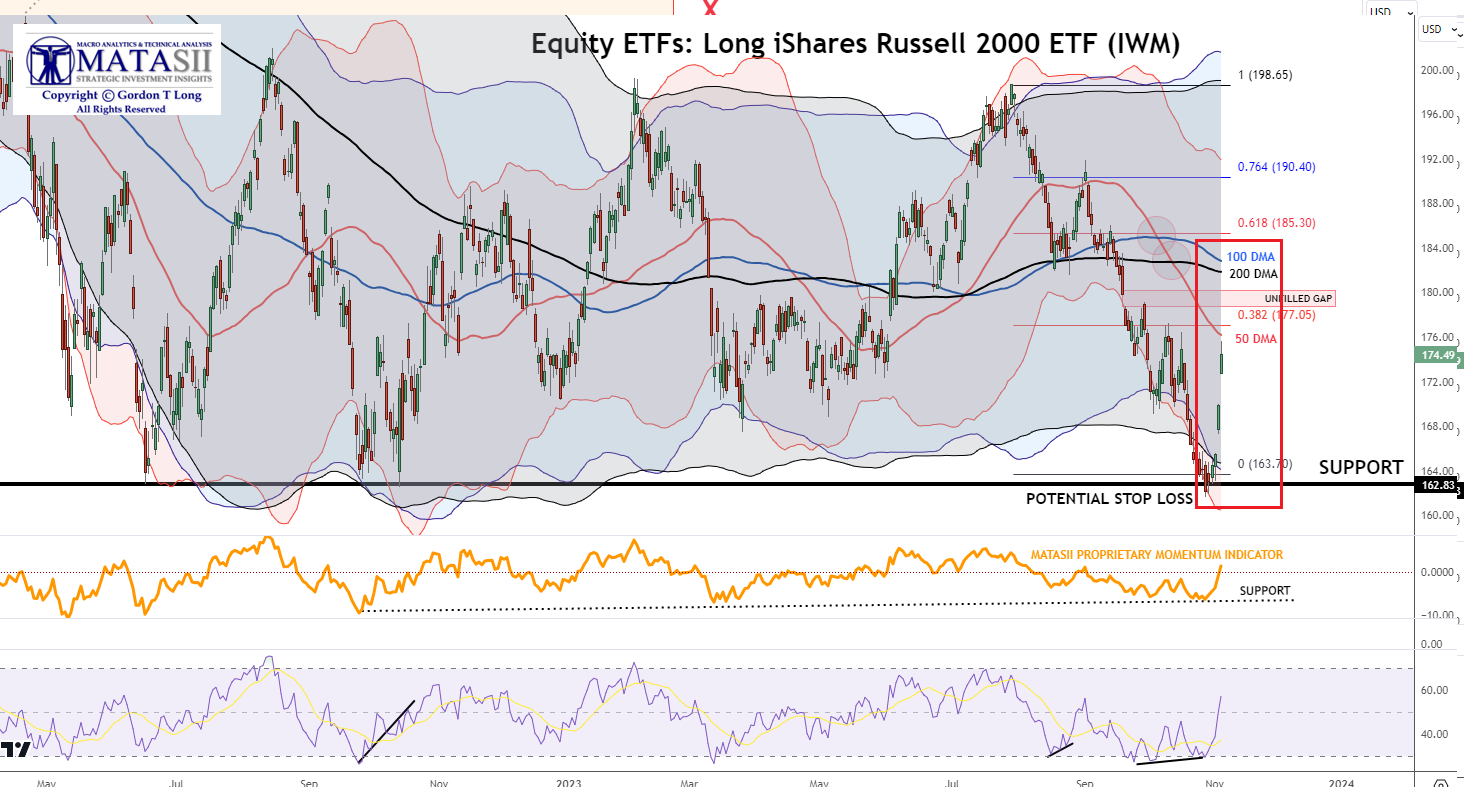
EQUITY ETF (IWM) - Long iShares Russell 2000
We advised you to watch the IWN last week to see if it held support. It did! The upper overhead Moving Averages should now be expected to act as Overhead Resistance.
NOTE: The Russell 2000 is the "King of Mean Reversion". Trading mean reversion is often very painful, especially at turning points, as you end up buying the most brutal selling and end up shorting the most intense buying. The Russell continues to be the king of range trading....bouncing violently once again.
More upside likely to go here!
| |
|
YOUR DESK TOP / TABLET / PHONE ANNOTATED CHART
Macro Analytics Chart Above: SUBSCRIBER LINK
| |
NOTICE Information on these pages contains forward-looking statements that involve risks and uncertainties. Markets and instruments profiled on this page are for informational purposes only and should not in any way come across as a recommendation to buy or sell in these assets. You should do your own thorough research before making any investment decisions. MATASII.com does not in any way guarantee that this information is free from mistakes, errors, or material misstatements. It also does not guarantee that this information is of a timely nature. Investing in Open Markets involves a great deal of risk, including the loss of all or a portion of your investment, as well as emotional distress. All risks, losses and costs associated with investing, including total loss of principal, are your responsibility.
FAIR USE NOTICE This site contains copyrighted material the use of which has not always been specifically authorized by the copyright owner. We are making such material available in our efforts to advance understanding of environmental, political, human rights, economic, democracy, scientific, and social justice issues, etc. We believe this constitutes a ‘fair use’ of any such copyrighted material as provided for in section 107 of the US Copyright Law. In accordance with Title 17 U.S.C. Section 107, the material on this site is distributed without profit to those who have expressed a prior interest in receiving the included information for research and educational purposes. If you wish to use copyrighted material from this site for purposes of your own that go beyond ‘fair use’, you must obtain permission from the copyright owner.
========
| |
MATASII'S STRATEGIC INVESTMENT INSIGHTS | |
2020 VIDEOS OUTLINING THE COMING RISE IN INFLATION & COMMODITY PRICES | |
UnderTheLens - NOVEMBER 2023 | |
|
RELEASED - 10-25-23
VIDEO: 29 Minutes with 41 supporting slides.
| |
|
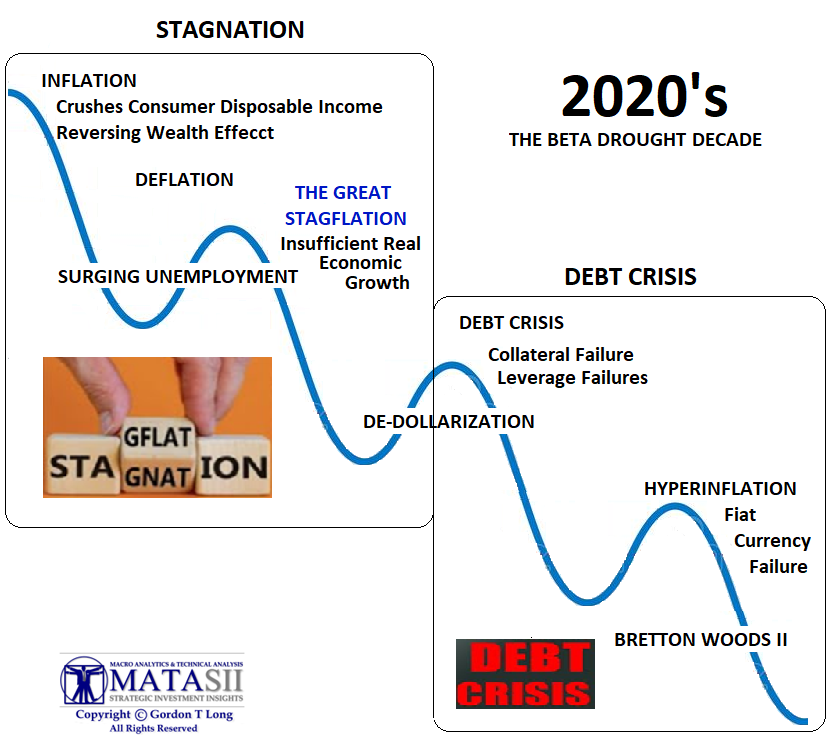
A GREAT STAGFLATION
RELEASED - 01-15-23 --- 88 Page Paper
FULL 88 PAGE PDF DOWNLOAD
| |
IDENTIFICATION OF HIGH PROBABILITY TARGET ZONES | |
Learn the HPTZ Methodology!
Identify areas of High Probability for market movements
Set up your charts with accurate Market Road Maps
Available at Amazon.com
| |
The Most Insightful Macro Analytics On The Web | | | | |