Greetings!


The total home supply in Metro Vancouver in November is up 14.4% year over year and that is 36.3% above the 10 year seasonal average while sales were down 15.4% from November 2024 and that is down 20.6% below the 10 year seasonal average.


These Metro Vancouver stats get a lot of press and are distinct from the west side market stats but we are facing similar trends here on the west side.


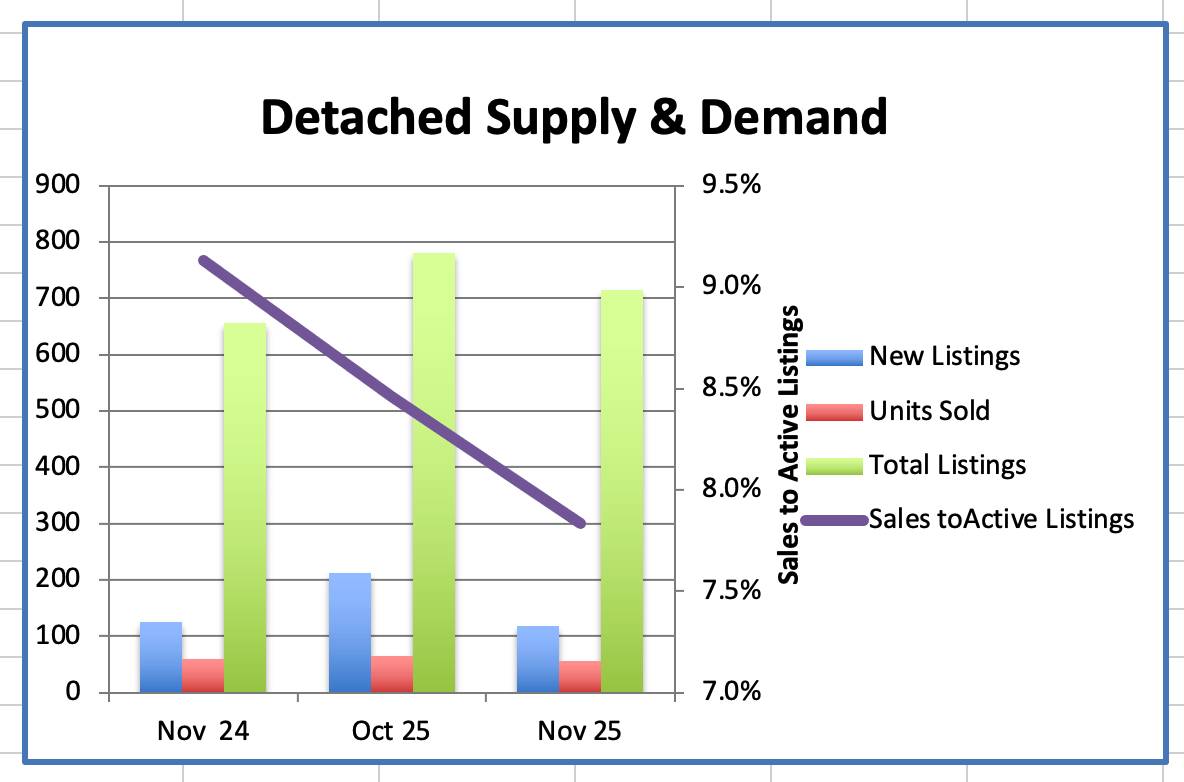
Westside home sales, when compared to the 10-year averages, are down by 18% for detached homes, down 11% for apartments and up by 10% for townhomes.


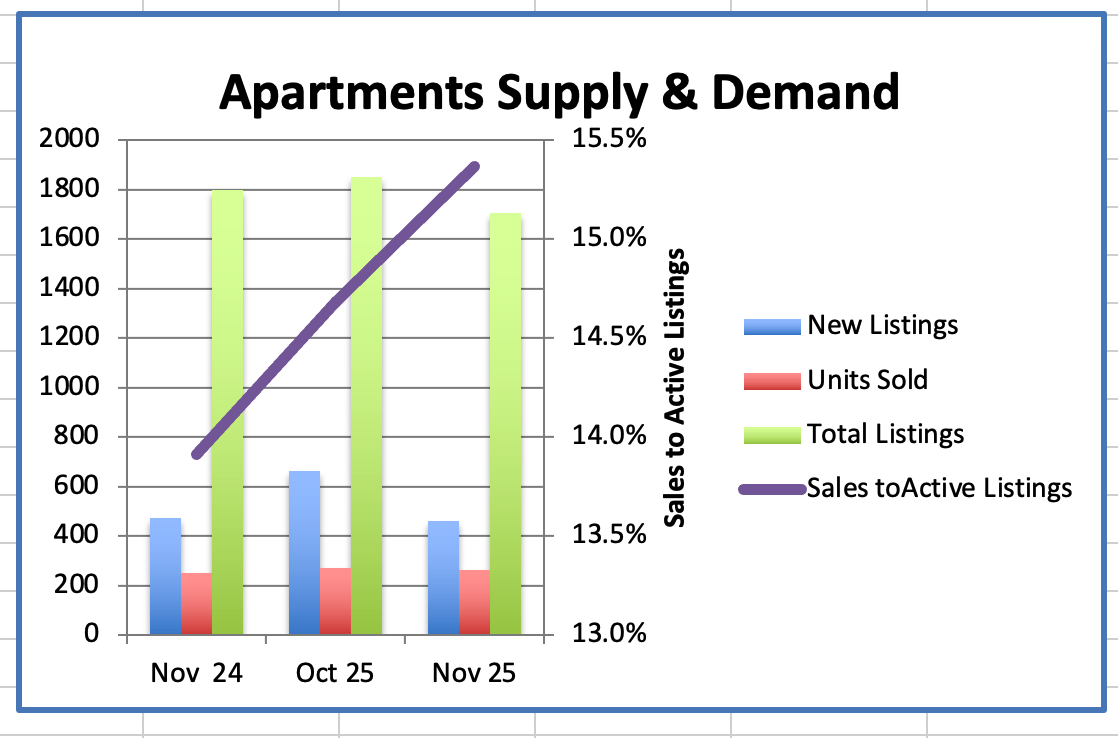
Compared to the 10-year average, supply is down 8% for Westside detached homes, while apartment supply is up 25%, and townhomes are up 70%.


We had 56 Westside Detached home sales in November, down 15%, compared to 66 sales last month.

We had 262 Westside Apartment sales in November, down 4% compared to 272 sales last month.

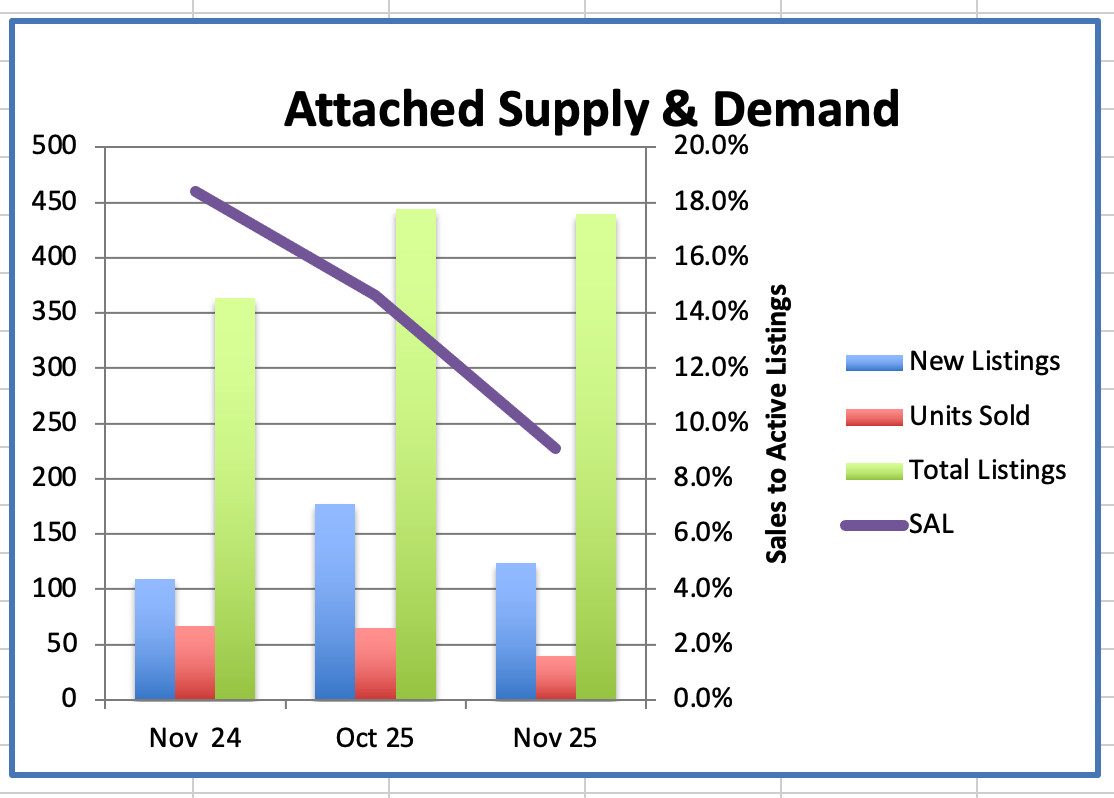
We had 40 Westside Attached home sales in November, down 39% compared to 65 sales last month.


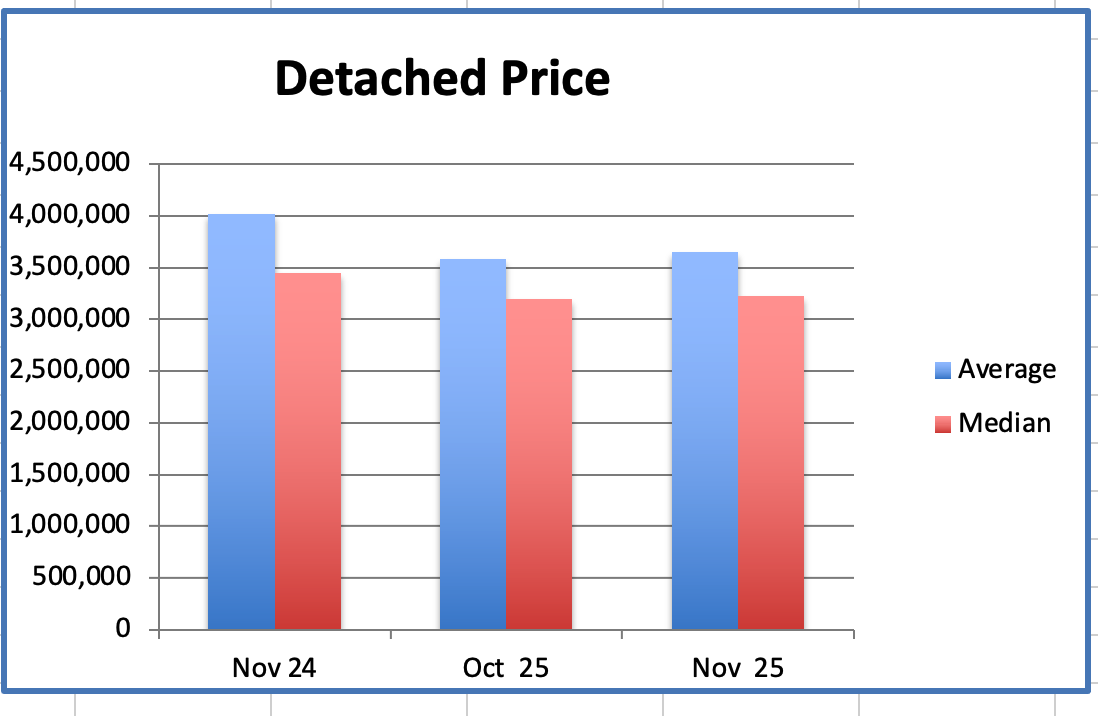
In November the Westside Detached Home average price was $3.654M, down 23% from $4.744M, the peak, in August 2023.

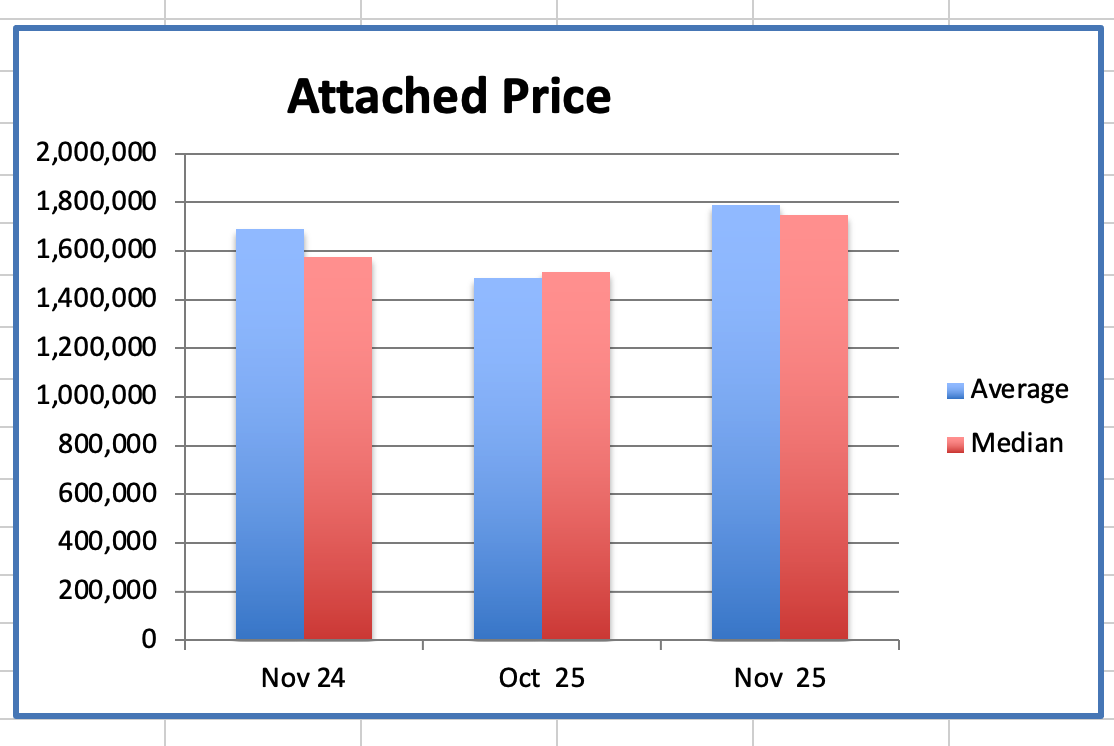
The Attached home average price was $1.79M, down 5% from $1.885M, the peak, in Dec 2024.

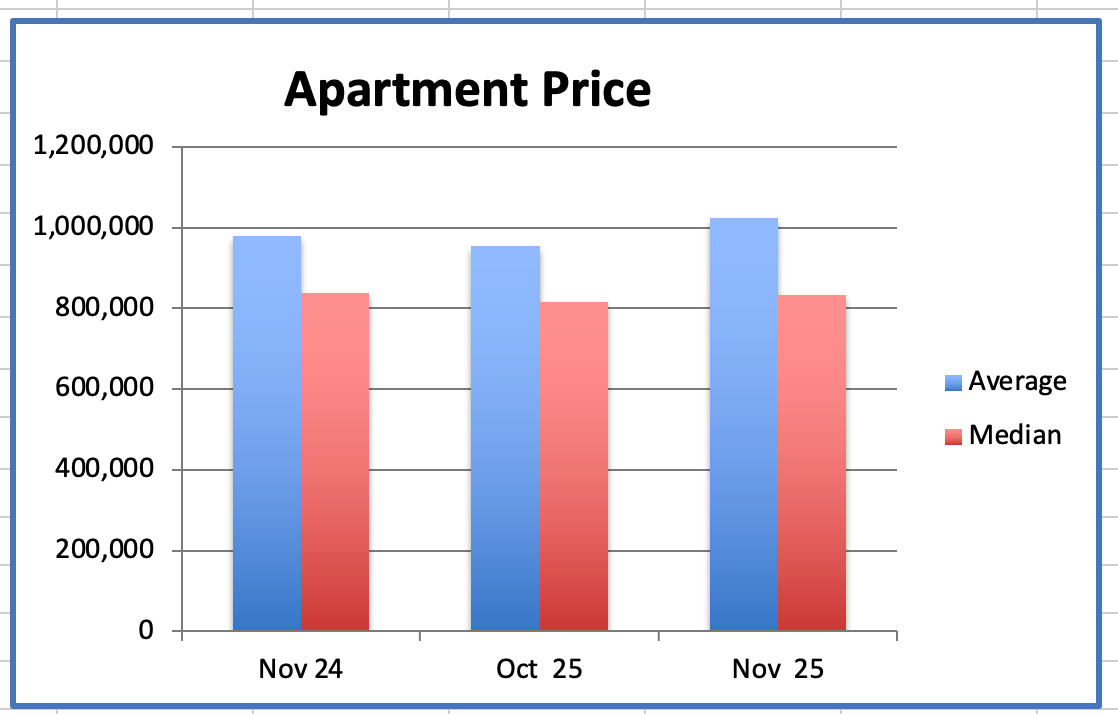
The Apartment average price was $1024K, down 15% from $1.199M, the peak, in January 2018.


The Sales to Active Listings ratio (SALR) is a key indicator of market balance and it helps determine whether the market favours Buyers or Sellers. The range between 12% and 20% is considered a balanced market and prices are sustained.


Generally, downward pressure on home prices occurs when the ratio dips below 12% for a period of time. Upward pressure on home prices occurs when the ratio surpasses 20% over several months.


Market conditions are dynamic and can change rapidly due to various economic factors & the ratio can vary significantly depending on the property type.


Currently the SALR for Westside detached homes is 7.8%, attached is 9.1% and apartments is 6.5%.


On a month to month basis, demand is down slightly from last month for detached homes, it is down for apartments and is down for townhomes. Westside average prices in November are up slightly for detached homes and apartments and up dramatically for townhomes. Lower prices are typically the result of a decreasing SALR creating downward pressure. In November the SALR was trending down because the demand fell faster than the supply. This is typical for this time of the year.


The strength of the November prices is based on a lower volume of sales but it bodes well for the spring market. The recent interest rate drop and the fact that sellers are accepting market value offers after a long year of sub par sales activity should also be beneficial. Currently buyers remain hesitant to enter the market as evidenced by the below 10 year average sales and above 10 year average supply on the Westside.


We expect the market to remain slow through January but there are buying opportunities particularly for detached & town homes and if the market really turns up, buyers will rush in, so now is a good time to buy while supply remains stable.


Sellers need to be the best value in their cohort to attract a buyer so strategic pricing is the key to achieving a sale.


Thinking of Selling? Let’s Talk!


πŸ“ž Call me today to discuss your options and make the most of the upcoming selling season.


Merry Christmas and all the best for 2026! πŸŽ„πŸŽ…πŸ»πŸ¦Œβ˜ƒοΈβ„οΈ *ΰ©ˆβœ©β€§β‚ŠΛšπŸ₯‚*ΰ©ˆβœ©β€§β‚ŠΛš


Best regards


Stuart β›³ 🎾

Detailed information on the Westside detached homes market in November. Here's a summary of the key points:


  • Supply:
  • In November, the supply of Westside detached homes decreased 8% compared to October, with a total of 715 homes available, down from 780.
  • This is an increase of 9% compared to November 2024 when there were 657 homes on the market.
  • Demand:
  • Sales of Westside detached homes in November were down 15% from October, with 56 homes sold.
  • Sales were down 7% compared to November 2024, which had 60 sales.
  • The number of sales remains 18% lower than the ten-year average of 69 sales.
  • Sales to Active Listings Ratio (SAL):
  • The SAL in November decreased by 7% from the previous month, with a current SAL of 7.8% compared to 8.5% in October.
  • This represents a 14% decrease from November 2024.
  • An SAL between 12% to 20% is typically considered a balanced market, where prices tend to remain relatively stable.
  • Pricing:
  • The average detached home price in November decreased 23% and median decreased 24% from August 2023's peak.
  • The average price is $3.654 million, and the median price is $3.2 million.
  • Current prices are up 2% on average and up 1% on median from last month.
  • High and Low Sale Prices:
  • Westside detached home sales in November ranged from a low of $1.85 million to a high of $9.2 million. The most expensive property took 195 days to sell, while the least expensive took 284 days!
  • Of the 56 homes sold, only 3 sold at or above their asking price, indicating a buyer's market.


These statistics provide a comprehensive overview of the Westside detached homes market in November shedding light on changes in supply, demand, pricing, and notable sale prices.

Detailed information on the Westside apartment market in November. Here's a summary of the key points:

  • Supply:
  • In November, the supply of Westside apartments was down 8% compared to October, with a total of 1,705 apartments available for sale.
  • This number is down by 5% from November 2024.
  • Demand:
  • Demand for Westside apartments decreased by 4% in November with 262 sales compared to 272 sales in October.
  • The number of sales in November was up 5% from the same month last year, which had 250 sales.
  • Apartment sales are down 11% from the ten-year average of 262 sales.
  • Sales to Active Listings (SAL):
  • The SAL in November increased by 5% compared to October, to 15.4%.
  • This is an increase of 11% from the SAL of 13.9% in November 2024.
  • An SAL between 12% to 20% is typically considered a balanced market, where prices tend to remain relatively stable.
  • Prices:
  • The average price of Westside apartments in November increased 7.2% from October, with the average price at $1024K
  • It was down 4.6% from November 2024.
  • The median price was up 2% at $832K and is down slightly from November 2024.
  • Average prices are down 15% below the peak of $1,199,000 in January 2018, and median prices are 6% below the peak of June 2024.

These statistics provide a comprehensive picture of the Westside apartment market in November, highlighting changes in supply, demand, pricing, and their respective trends over time.

Detailed information on the Westside townhouse market in November. Here's a summary of the key points:

  • Supply:
  • In November, the supply of Westside townhouses was relatively unchanged compared to October, with a total of 440 townhouses available for sale.
  • The supply was up 21% from November 2024, which had 364 townhouses on the market.
  • Demand:
  • The demand for townhouses in November decreased by 39%, with 40 sales.
  • The number of sales in November increased by 40% from the same month last year, which had 67 sales.
  • Attached home sales are 10% below the ten-year average of 45 sales.
  • Sales to Active Listings (SAL):
  • With no change in supply and decrease in demand, the current SAL for townhouses decreased by 38%, to 9.1%
  • This is 51% lower than the SAL of 18.4% in November 2024.
  • An SAL between 12% to 20% is typically considered a balanced market, where prices tend to remain relatively stable.
  • Prices:
  • The average price of townhouses in November was $1.79 million, up 20% from October.
  • It was up 6% from November 2024 when the average price was $1.69 million.
  • The median price in November was $1.75million, a 16% increase from October ($1.52 million), and up 11% from November 2024.
  • Average prices for townhouses are down 5% from its peak. Median prices down 6% from its peak. The average peak of $1.885 million in Dec 2024, and the median peak of $1.855 million in Dec 2024.


These statistics provide a comprehensive overview of the Westside townhouse market in November, indicating changes in supply, demand, pricing, and their respective trends over time.

Facebook  Twitter  Linkedin