|  |
|
Mission OPC UA Gateway Success
In April 2018, Mission notified OPC customers that support for the legacy OPC Data Access connection method would be retired at the end of August in favor of the newer and more secure OPC Unified Architecture (UA) standard.
Mission engineers are proud to announce that the conversion process was a complete success. Nearly one-third of OPC UA customers opted to connect directly to the Mission server to take advantage of the new control features available in their SCADA human machine interface (HMI). Mission offered a no-cost middleware solution, OPC UA Gateway, for customers using an HMI that would not directly support the new standard.
Thanks to the willing cooperation of customers, more than 1,500 devices were converted to the new connection method, and many customers were even able to complete the transition themselves.
|
|
Trade Shows
September 25-27
Las Vegas, NV
October 1-3
New Orleans, LA
October 9-11
Bozeman, MT
October 16-18
Odessa, TX
October 21-24
Boise, ID
November 4-7
Raleigh, NC
November 7-9
Kearney, NE
November 7-9
Saskatoon, SK, CA
Week 4: Web Portal II Advanced Features, Supergraph, Reporting, and Volumetric Flow
Week 2:
Hardware and Instrumentation
Week 3: Web Portal I Notification and Unit Setup Options
Week 4: Web Portal II Advanced Features, Supergraph, Reporting, and Volumetric Flow
Week 5: Special Topics
Week 1: Survey of Features
Week 2: Hardware and Instrumentation
Week 4: Web Portal II
Advanced Features, Supergraph, Reporting, and Volumetric Flow
Week 1: Survey of Features
Week 2: Hardware and Instrumentation
Week 3: Web Portal I Notification and Unit Setup Options
|
|
|
Springfield Makes Critical Decisions
Using Mission Rainfall Data
|
The City of Springfield, Missouri has a service area of 82 square miles with a population of about 160,000. City officials have used Mission remote terminal units (RTUs) to monitor rainfall since 2007. Carrie Lamb, Water Quality Compliance Officer, explained that the Department of Public Works needed a network of permanent rainfall gauges interspersed across the city to collect consistent, long-term data. Lamb said, "I did a lot of research online and spoke with other communities. Some had systems they were supporting internally. We wanted a system that we didn't have to support ourselves. That was a really important consideration for us, and that's how we came to Mission." They began with 20 solar-powered M110 units attached to tipping bucket rain gauges. Solar power was chosen both for cost efficiency and to keep in line with the department goal of maintaining a cleaner environment. The majority of the units were positioned on roofs of school buildings and near lift stations as a strategic way of spacing the network.
|
|
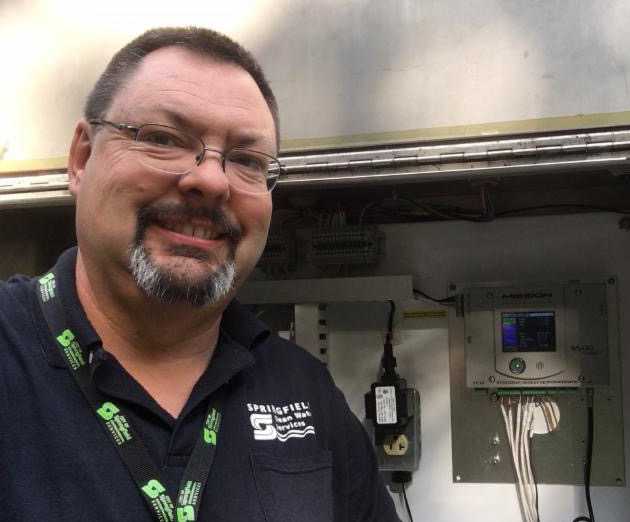
| John Copelin, Maintenance Supervisor of Electrical Instrumentation and Control, poses with a Mission MyDro 850 RTU. Photo credit: John Copelin |
Since that time, Springfield has added almost 30 additional units to its application and integrated the system to other divisions. They use 46 Mission RTUs to monitor rainfall and flow to understand how water is moving through the city. Mission data helps utility staff members make important decisions about city operations. Rainfall data is used in the Storm Water Program of the Department of Environmental Services to formulate an approach for reducing pollutants in storm water runoff and how to best manage city floodplains. Additionally, the data is used to determine to what extent the city wastewater treatment plants need to be extended and where infrastructure upgrades are needed most.
The Department of Environmental Services and the Department of Public Works use rainfall data for several purposes. Lamb explained that her division primarily uses it for storm water sampling. If at least 0.2 inches of rain accumulates in an area after three or more days of no prior rainfall, Lamb and her team sample the storm water where it feeds into creeks and ditches. They test the storm water and then determine what action may be necessary to mitigate the amount of pollutants that are exposed to the environment. Lamb said they also use the rainfall data to target industrial areas to make sure that facilities are following codes intended to protect water quality by reducing storm water pollution.
Principal Storm Water Engineer of the Department of Public Works, Chris Dunnaway, explained that his division is responsible for managing the city storm water system. As part of this, hydrologic models have been developed for many of the watersheds in the city. These models are used to estimate the amount of rainfall that runs off during a storm event to provide an approximate flow rate value. These flow rates are then entered into a hydraulic model to help predict how high water will rise during storms of various magnitudes. Both of these models rely upon engineering judgment of multiple variables. Actual rainfall data collected during a storm event, in combination with recorded high-water marks, assist city staff with calibrating and refining the models to better match what actually occurs. The rainfall gauges not only show where the rainfall occurred but also how hard it rained and for how long with rainfall measurements provided at 15-minute intervals. This temporal distribution is important in storm water modeling. These models are primarily used during the design of storm water infrastructure such as culverts, bridges, and detention basins to reduce flooding to streets and private property. The models were also used during the remapping of the city floodplain maps to identify areas that are at a higher risk of flooding. He explained, "During the remapping process, we believed one of the hydrologic models was overly conservative, so we looked at a couple of the rain gauges from a specific storm event and used that data to help calibrate the model." This data, coupled with complaints received from residents, helps them to determine which parts of the city need the most critical attention in the way of storm water infrastructure upgrades. Dunnaway explained that these upgrades generally include enlarging a detention basin, improving a channel, or installing larger pipes.
Springfield city officials publicized their Mission website, so members of the community can access the rainfall data for various projects. For instance, Lamb explained that in compliance with the Clean Water Act, administered by the EPA, contractors in the area are required to maintain certain practices to limit the amount of mud that gets into fresh water sources from construction sites. Contractors use the rainfall data to identify the sites that need to be inspected. Local engineers also consult the data when they are in the process of designing storm water projects and solutions.
The Department of Environmental Services also oversees the sanitary sewer system as well
 |
|
|
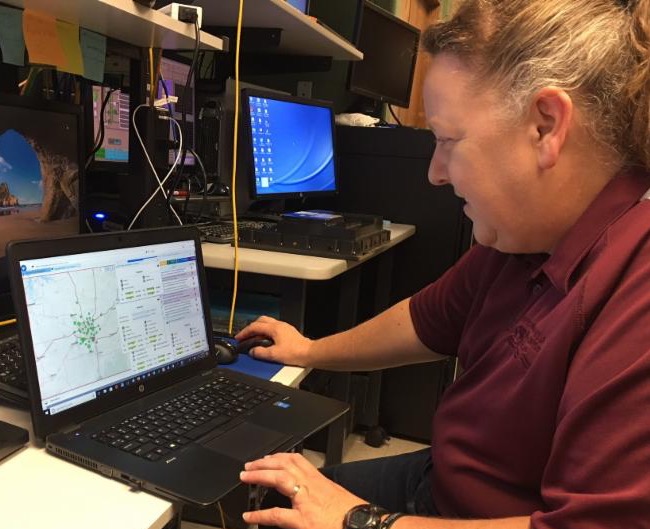
Karyn Highfill, Control System Specialist, consults the 123SCADA web portal for critical system data. Photo credit: John Copelin |
as the city treatment plants. Springfield has two treatment plants, one that treats an average of 35 million gallons of water per day and a smaller plant that treats an average of 8 million gallons of water per day. Karyn Highfill, Control Systems Specialist, worked closely with Mission and the staff from Environmental Services to implement a plan to combine all the information from rain data and pump data into the Mission website. John Copelin, Maintenance Supervisor of Electrical Instrumentation and Control, said that in 2017 his department began using the previously unused input capabilities of the Mission RTUs that were already installed at pump stations for rainfall collection.
Copelin explained that his department uses the rainfall data to determine the effectiveness of its pumps and anticipate preventative maintenance. He said, "During rain events, we can see how many inches of rain fell in this area, and then we can look at the pump station that is in that area and see how many minutes it runs longer than normal, and that gives us the data we need." They also use flow meters at select stations, which generate charts and graphs to show them how much water is coming in and being pumped out of the station. All of this data combined helps the City of Springfield make informed decisions, including localizing areas of the city where sewer pipelines need to be repaired or reinforced, as well as whether treatment plants may need to be expanded to accommodate extra flow.
In addition to rainfall data, Springfield also uses M800 and MyDro 850 (800-series) units to monitor pump starts and runtimes. Regarding the MyDro series, Copelin said "I love the display that the MyDro has, and that you can actually read the status of the discrete and analog 4-20 current inputs. The MyDros are wonderful." Pump information is used to indicate the need for preventative maintenance to keep operations running smoothly. Copelin explained that the city has one of the strictest effluent permits in the state of Missouri because most of its treated wastewater is returned to creeks and rivers that flow into Table Rock Lake, which is a recreational water source. Copelin said, "Our effluent is extremely clean and it's virtually drinking water quality when we release it back into the environment because of the topography of the Ozarks." He said that Mission has helped Springfield stay attuned to its application better than the previous system, which has resulted in fewer negative incidents.
Prior to Mission, the Environmental Services Department used a system of auto-dialers that relied on land telephone lines, which were susceptible to poor connections and lightning strikes. At that time, there was one phone number specifically designated for alarm call-outs at the treatment plant. An operator would receive the phone call, manually log it, and pass the information along to another staff member. "Mission uses the cellular system. There are no phone lines to worry about, and the cell signal is very robust and dependable," Copelin said. "When something happens the Mission unit sends emails, texts, and calls to multiple people. Additionally, I get an email for everything that is happening from the station, so I can create a log based on the emails I receive."
Copelin told an anecdote about a sewer spill the utility experienced prior to implementing Mission. There was a severe thunderstorm one Saturday night near the second largest pump station in the city. A lightning strike traveled through the phone line, burned up the auto-dialer, and tripped the breaker in the station. The lightning strike split the phone line feeding into the auto-dialer, leaving char marks on the wall. The power outage made the unit unable to call-out, so the station was not pumping any sewage until an operator discovered what had happened the following Monday morning. The well had been overflowing into a nearby creek, and they had to report the spill to the DNR and EPA. Copelin said, "If we had a Mission unit there that wouldn't have happened. The power would have gone out, and we would have known that the well was high because the Mission RTU has its own battery and uses the cellular network. As soon as the power went out, it would have started sending us alarms and we would have been able to send someone out there."
Mission RTUs provide the City of Springfield with a reliable solution for many of its operations. "The Mission units have made my job easier," Copelin said, "Making the transition from the old technology was easy. We were able to use the same wiring. It's an easy install and easy switch. So far the Mission units have worked flawlessly and we're very impressed with them."
To learn how to more fully integrate the Mission system into your utility operations, contact [email protected] or visit 123mc.com.
|
|
___________________________________________________________
|
The 123SCADA Mobile App
Simplifies Operations
|
|
Mission Communications is excited to announce the release of the 123SCADA application
for mobile smart devices. It is now available on the App Store and Google Play. Mission representatives will be introducing the application at WEFTEC '18. It has the full functionality of the mobile web portal, but with added features for on-the-go water and wastewater professionals, including geolocation for staff management, QR code scanner for easier remote terminal unit (RTU) view and configuration, and the ability to submit images directly to a support ticket.
|
|
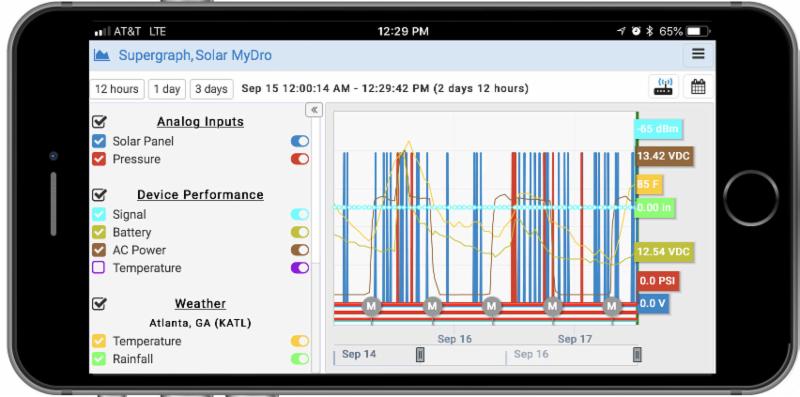
| The 123SCADA app allows users to gain a comprehensive overview of their system from virtually anywhere. |
Much like the 123SCADA web portal available through a mobile browser, the application is intuitive to use and highly customizable, so users can adjust system parameters to optimize their workflow. Live data streams directly to the app, and all menus update to reflect real-time data points. Users can view alarm details and analyze historical data for comparative analysis. The Dashboard menu allows users to view critical information, such as alarm details and the status of RTUs. Users can customize notification call-out parameters and schedules to ensure the correct personnel receive alarms and alerts. Data views, charts, graphs, and reports are all optimized for equipment monitored by Mission RTUs.
The 123SCADA mobile app makes on-site RTU setup and configuration easier than ever before. Through the app, users can scan the QR code on their RTU and receive a prompt to access RTU view, RTU info, and RTU config for the selected device. These options allow users to configure RTU call-out settings, view the status of device inputs, and change basic device information.
The integration of geolocation allows users to indicate the location of a device without manually inputting coordinates. Additionally, if they choose to share their location, staff members can be found on the map with location markers. This feature streamlines workflows by providing the ability to route and coordinate service calls.
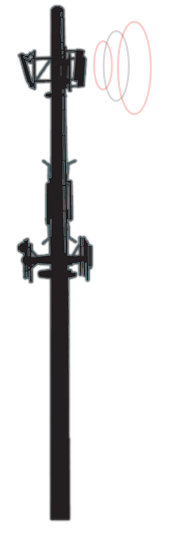
Using the mobile device camera, users can take pictures of site equipment such as RTUs, antennas, enclosures, and expansion modules, and submit it directly to a support ticket, making it even more efficient for Mission Technical Support to troubleshoot and resolve system issues.
Many of the useful features of the new 123SCADA app were the direct result of customer suggestions and requests. Mission continually strives to exceed the expectations of customers. If you have further suggestions for the app, feel free to send your comments to [email protected]. Visit Mission representatives at WEFTEC '18 booth 3101 to learn more about the app and how to integrate it into your utility operations. Download the app by selecting one of the badges below.
|
|
__________________________________________________________
|
Water Towers Across the U.S.
Display Local Flair
|
|
Modern, elevated water towers became commonplace in public water distribution systems in the mid-19
th
century as industrialization spread and pipelines that could handle increased pressurization were developed. The main function of a water tower is not to store water but to pressurize it for distribution. When storage is the primary purpose, municipalities have found it more cost effective to construct a reservoir because water towers usually only store enough water to meet the average service demand of an area for one day.
Water towers rely on height and gravity to provide the necessary pressure, which is why they are often tall and located at the highest possible point of elevation. Each foot of height adds 0.43 pounds per square inch (PSI) of pressure. For reference, large home appliances require at least 20 to 30 PSI, and a water tower must have enough pressure to supply that amount to all homes within the water system.
If the water level in a tank falls too low, the water will not reach the required pressure level, which may increase the risk of contamination. The Mission Tank and Well Control Package maintains the water level in tanks by automatically sending commands that signal remote well or booster pumps to turn on and off. The system relies on either a MyDro 850 or M800 remote terminal unit (RTU) and a transducer to measure the tank level. The RTU at the water tank transmits level information to Mission servers. When the tank level is outside the user configurable level boundaries, a command is automatically sent to output relays on the same RTU or remote RTUs to energize well pumps or valves and refill the tank.
Beside pressurizing water for distribution, water towers often represent local culture and history and serve as community landmarks. The towers below are a few examples of interesting water towers around the United States.
Louisville Water Tower in Louisville, KY
Constructed in 1860, the Louisville Water Tower is the oldest ornamental water tower in the United States. It stands 183 feet tall with 10 zinc statues at its base. In the 1830s and 1840s, tainted water from private wells spread cholera and typhoid epidemics throughout the city. Residents were finally convinced of the need for a public water supply following a series of fires in the 1850s. The water tower could supply 12 million gallons of water in 24 hours at the time of its completion. The Louisville WaterWorks Museum opened on the premises of the retired water tower in 2014.
|
|
|
Photo credit: Accessed via Wikimedia Commons
|
Chicago Water Tower in Chicago, IL
The Chicago Water Tower was built in 1869 and stands 154 feet tall. It originally housed a 130-foot-tall pump that drew water from Lake Michigan. It was the only public building in the area to survive the Great Chicago Fire of 1871. When the fire destroyed the library, the water tower temporarily housed the displaced books. Retired in 1906, the tower now serves as a symbol of historic Chicago and houses the City Gallery in the Historic Water Tower, which is an art gallery featuring the work of local photographers, artists, and filmmakers.
|
|
|
Photo credit: City of Chicago, Patrick L. Pyszka
|
Fresno Water Tower in Fresno, CA
Standing at 109 feet tall, the Fresno Water Tower was completed in 1894. It was designed by Chicago architect George Washington Maher, whose design was inspired by the Chicago Water Tower. Maher's original design included a library, though this plan was never executed. The tower was retired in 1963 when the pumping equipment became insufficient to meet the needs of the service area. In 2001, the tower was renovated and now serves as a visitor center for Fresno County.
|
|
|
Photo credit: Bobak Ha'Eri, accessed via Wikimedia Commons
|
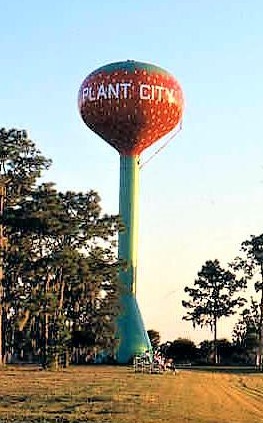
Giant Strawberry in Plant City, FL
The water tower in Plant City, Florida is painted to resemble a large strawberry. The tank stands 160 feet tall and holds 500,000 gallons of water. Over three-quarters of the winter strawberries produced in the nation are sourced here. The city annually hosts the Florida Strawberry Festival in late winter.
|
|
|
Photo credit: Bud Lee, courtesy of Plant City Photo Archives & History Center
|
Peachoid in Gaffney, SC
Gaffney is known as the peach capital of South Carolina. The water tower, dubbed The Peachoid, stands 135 feet tall, and holds one million gallons of water. The tower was erected in 1981 because even though Georgia is commonly referred to as "The Peach State," Cherokee County, South Carolina actually produced more peaches than the entire state of Georgia in that year.
|
|
|
Photo credit: John Samuel Margolies, accessed via Wikimedia Commons
|
World's Largest Watermelon in Luling, TX
This water tower in Luling, Texas is decorated to resemble a giant watermelon. The tower stands 154 feet tall. The design of the tower honors the annual Watermelon Thump, which is a harvest festival that celebrates the large crop of watermelons produced in the area.
|
|
|
Photo credit: Accessed via Wikimedia Commons
|
|
Water Tower Fun Facts
-
In the mid-19
th
century, any building in New York City that was six stories or higher was required to
have its own water tank. Tanks were made of wood by barrel makers, who didn't use any sealant but refilled them until the wood was saturated and swollen with water, eventually becoming impermeable.
- Fire insurance rates are often lower in areas where water towers are integrated in the public water system because fire hydrants will have ready access to a pressurized water source.
- Before GPS, pilots of small, private aircrafts used water towers in small towns to navigate because the name of the town was usually painted on the tower.
|
|
|