Volume 6: Modern Approaches to Bioassay Validation

FasTrain Website

FasTrain Course Registration

Free Bioassay Month Newsletter

Introduction

Validation of an assay is like crossing the finish line of an assay development project. Sure there are lots of things that must be done once you finish the race, but that moment of crossing the line is pure victory and excitement. It is also the cumulation of years of hard work. Therefore, deciding how to validate our beloved bioassay is not a decision to be taken lightly.  

Past Volumes

Volume 1: Bioassay Month Kickoff


Volume 2: It's All Relative Potency


Volume 3: Comparing Dose-Response Curves


Volume 4: Find your Critical Reagents


Volume 5: Utilizing Statistical Tools to Accelerate Development

Upcoming Volumes

Volume 7: Monitoring the Bioassay


Volume 8: The Audit of Bioassays


Volume 9: Lessons Learned Throughout the Month

Key Regulatory Guidance

A quick look into the regulatory guidances reveal several reputable and well known documents, the two most influential are:


1) The 2nd Quality guideline from International Conference of Harmonization (ICHQ(2)) entitled: Q2(R2) Validation of Analytical Procedures. This guideline was approved March 2024


2) The United States Pharmacopeia (USP) Chapter 1033 entitled: Biological Assay Validation. The current approved chapter was first published in the USP in 2013 and there is a revision in progress. The revision was proposed in 2022/early 2023 but is yet to be approved and published in the USP. (You can read a copy of the 2024 revised document in the pharmacopeial forum (PF) here: https://www.uspnf.com/pharmacopeial-forum. (It is available free)


Background on ICH Q2


The ICH Q2 was originally published as two documents 2A and 2B. Guideline 2A was a definition document and 2B was the how-to guideline. The two documents covered most analytical methods, with the exception of the bioassay. Why this exception? Because our dose-response curves are often not linear (they are typically a logistic curve) and the writing committee did not have the experience or space to write about these types of assays.

Bioassay Perspective


However, we, the bioassay subject matter experts, looked at the ICH Q2 guidance and knew that this iconic document did apply to bioassays – with some caveats. Especially critical were the described characteristics which needed to be validated. The four characteristics included:


• Precision (Repeatability and Intermediate)

• Accuracy

• Working Range (Suitability of calibration model, lower and upper range limit)

• Specificity


Along with a table suggesting which types of assays required validation of which characteristics, were some specific suggestions about the number of samples/runs needed to sufficiently validate each characteristic. These suggestions were not particularly burdensome for most analytical methods, especially those which take hours to complete. However, cell-based and animal-based potency assays, which can take weeks to complete struggled with these recommendations.

USP Chapter 1033 Approach

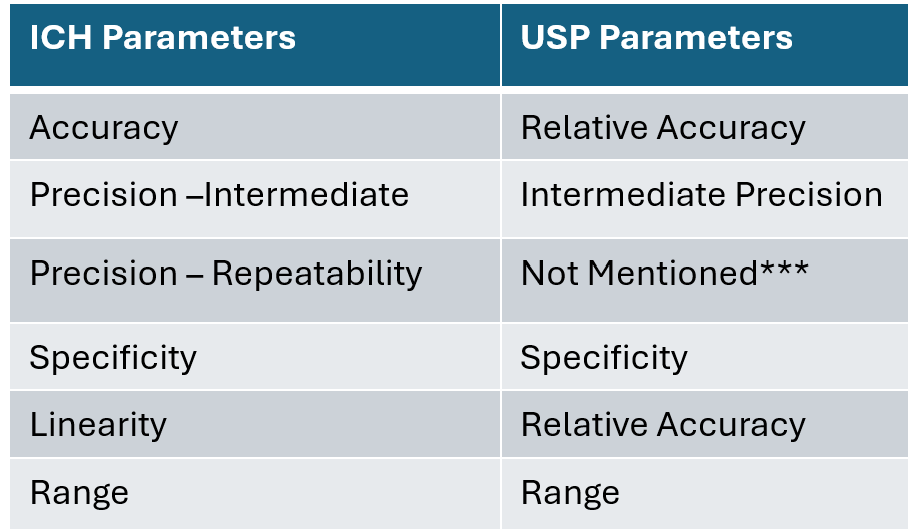
In 2013, the United States Pharmacopeia (USP) published Chapter 1033 on the Validation of Biological Assays. This guidance chapter proposed some statistical solutions to help alleviate the burdensome sample/run numbers suggested in ICHQ2(R1). At its heart, the USP chapter did not alter the broader approach of which performance characteristics needed to be validated. Nor did it alter the requirement for meeting pre-established acceptance validation criteria. This adherence to ICH Q2 principles may not be immediately obvious to new readers as, unfortunately, the USP chapter utilizes slightly different terminology from ICHQ2. Below is a guide to the different terms.

Terminology Comparison


Advances in Precision Estimation


One of the novel concepts in the USP chapter was the introduction of more sophisticated tools to estimate assay precision.


• ICH Q2(R1) estimates assay precision at 3 to 5 different analyte levels within the assay.


• USP 1033 determines whether the precisions among these different concentrations are in fact similar, then combines these estimates to provide a single precision value for the method.


Another important difference is that ICHQ2(R1) requires that the assay be run in its entirety to calculate method precision. However, USP states that precision of the method can be determined using the simplest replication of the method.

Understanding “Simplest Replication”


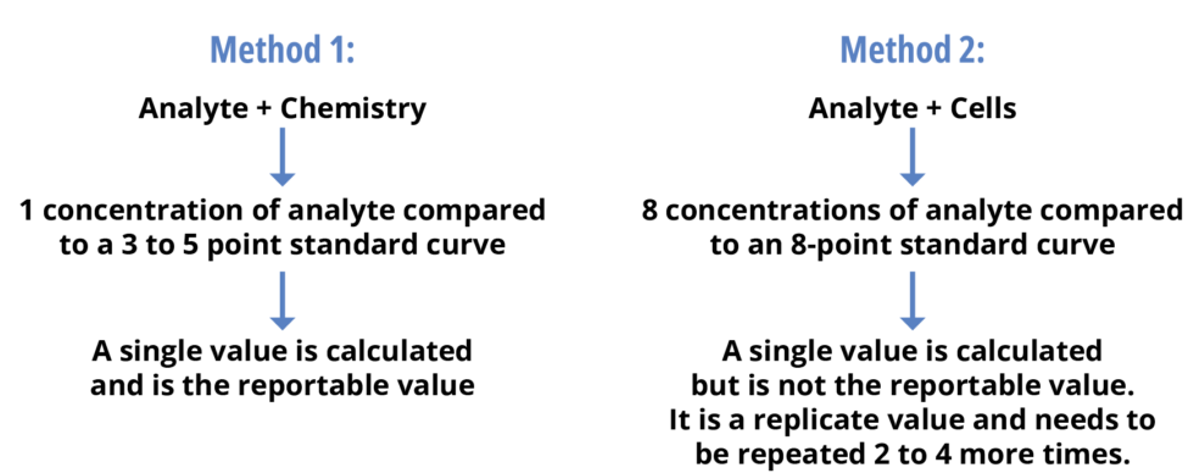
This latter concept is quite complicated and a strict understanding of the meaning of the “simplest replication” is needed. The reportable value from a potency bioassay often requires a combination of assay runs. This is in direct contrast to many other analytical methods which require a single method run to give a reportable value. Below is an example of what is meant by simplest replication:

If one follows the ICH Q2(R1) concept then the entire method must be run to determine the precision. Therefore, to determine the method precision of Method 1 above one would have to run the method 3 times. However, for Method 2, the method would have to be run anywhere from 6 to 12 times. If each assay run takes 2 weeks, an ICH Q2(R1) precision validation would take anywhere from 12 to 24 weeks. The USP approach which uses the single replicate would take 6 weeks.

Statistical Foundation


The USP use of the “simplest assay replicate” relies on the well-known relationship of standard error (SE) of the mean to the number of replicates. Specifically, the standard deviation of a mean (Sm) is inversely proportional to the square root of the number of data (replicates), N.


Specifically, the Sm is calculated by dividing the sample standard deviation by the square root of the sample size. This is mathematically written: Sm = S/√N.


Using this relationship, the precision validation criterion for a single replicate can be calculated and used rather than the method precision criterion. This single change to the ICH Q2(R1) standard approach can save companies months of validation time, without impacting the intent of the validation protocol.

Time Savings Impact


These two alternative approaches, pooling the precision at various dose levels and using the single run replicates instead of method reportable values, do not substantially differ from the intent of ICH Q2. However, the time saving for a company can be huge.

Accuracy in Validation

Accuracy is another characteristic which is assessed in a similar fashion in the two validation guidelines. Accuracy is essentially calculated as a spike and recovery experiment in both the ICH and USP validation guidelines. Accuracy is usually reported in one of two ways either as the mean percent recovery of a known added amount of analyte in the sample or as the difference between the mean and the accepted true value. These are mathematically written as follows.

ICH specifically mentions both of these approaches while USP only highlights the relative bias calculation. If you look at the data – they are essentially interchangeable values.

Total Analytical Error and Its Role in Validation


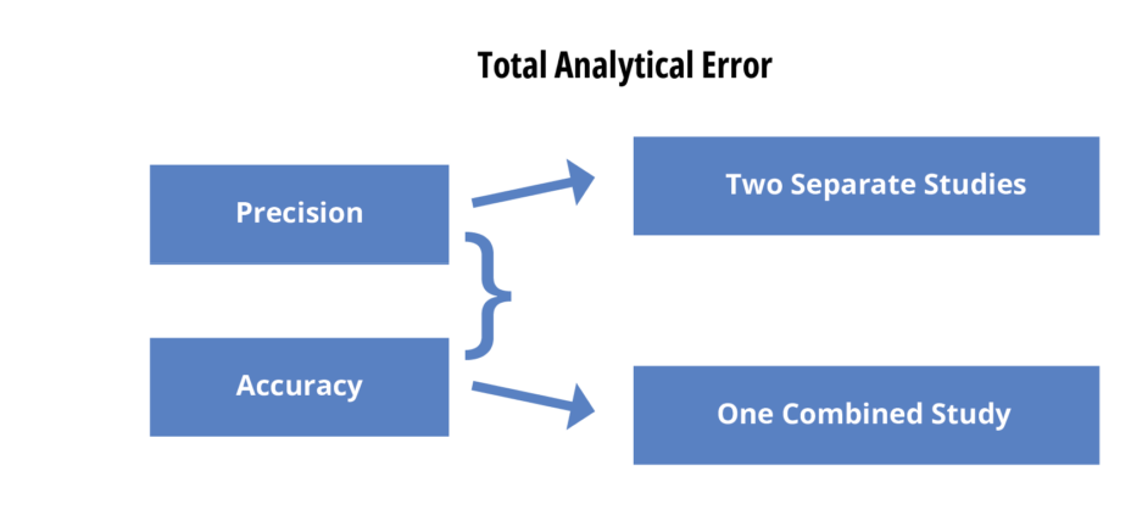
For several years now, CMC statisticians have been pointing out that precision and accuracy both describe potential errors in the reportable value for any analytical test. Many maintain that evaluating precision and accuracy separately does not necessarily assess the combined impact of the two. They suggest that validation should instead include an assessment of the total analytical error (TAE). This opens two options for precision/accuracy assessments – two separate studies or a single combined study.

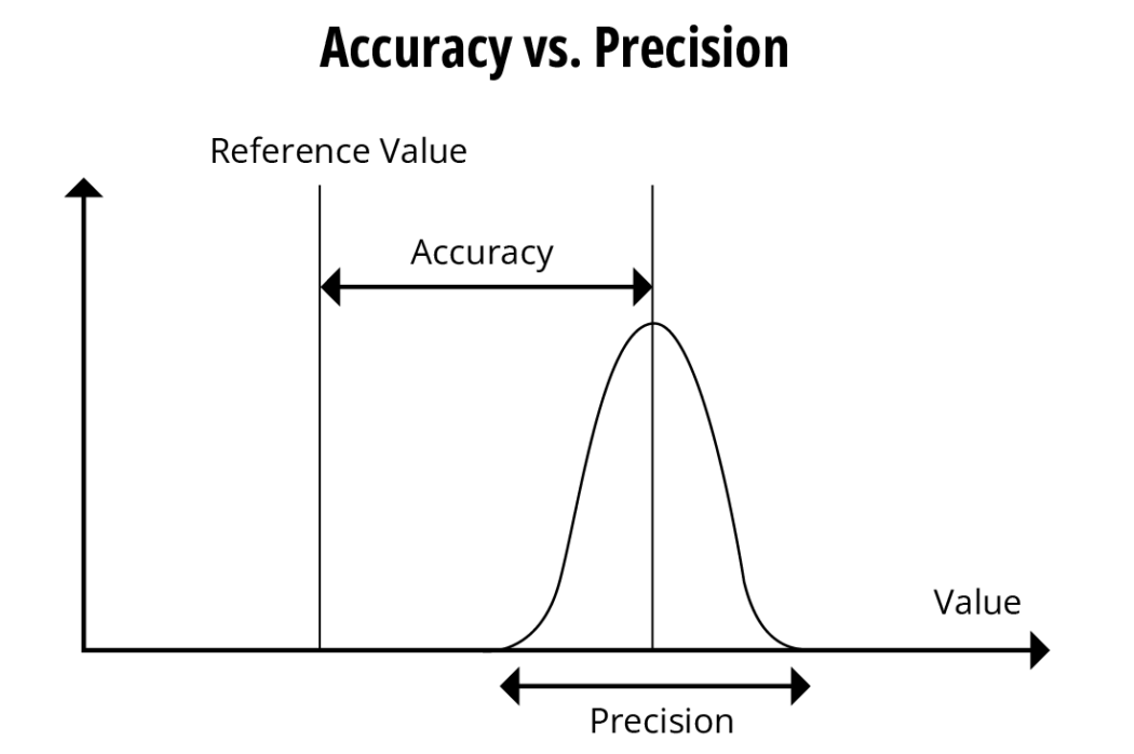
If one looks at a graphical representation of TAE below one can see why this could become an important issue.

The total potential error of a reportable value must consider the accuracy of a measured value and its precision of the reading. Currently, firms establish conservative criteria for the two characteristics if they want to ensure appropriate measurements at the two ends of the analytical range.


Often times this can be viewed as TAE = bias + 2 SD. But how specifically is it recommended that on measure and establish such a criterion?

Current Regulatory Perspective

The most recently approved ICH Q2(R2) (reference 1) states: “An alternative to separate evaluation of accuracy and precision is to consider their total impact by assessing against a combined performance criterion. The approach should be reflective of the individual criteria that would have been established for accuracy and precision.” While this is enabling it does not give any hints about how to implement such an approach.


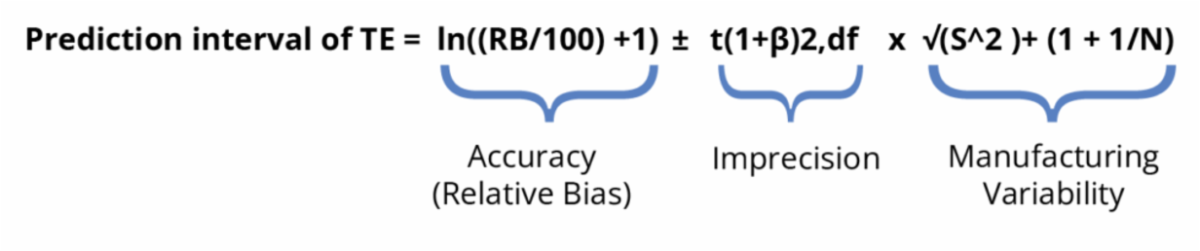
The current rewrite of the USP Chapter 1033 (reference 2) also suggests that a TAE approach may be applicable for validation. This rewrite states “A TAE approach can be applied to the data at each level (and across levels) based on prediction intervals for the relative accuracy (%RB/100 + 1). This approach establishes whether combined RB and variability exceed the requirement for acceptable bioassay performance.“ An example of this calculation is included in the most recent available revision. It includes the bias ± 2 std. deviations but then adds in the manufacturing variability to the calculation.

Currently, there are not enough numbers and hands-on calculations to aid a reader in learning how to implement a TAE approach for validation. However, there are predictions based upon numbers from methods which are precise but have very narrow specifications or methods which are less precise (reference 3) that a substantial portion of specification tolerance is taken up by the calculated tolerance interval for the TAE. This may result in methods failing validation. Fortunately, neither guideline is currently recommending implementing only a TAE approach. It will be up to the industry to investigate how to implement TAE into routine validation protocols and/or determining if the current separation of precision and accuracy criteria suffice to demonstrate a method’s suitability for use.

References


  1. ICH Q2(R2) implemented November 2023 available at https://database.ich.org/sites/default/files/ICH_Q2%28R2%29_Guideline_2023_1130.pdf
  2. USP Chapter 1033; Biological Assay Validation revision (comment period closed on 30 September 2024) https://online.uspnf.com/uspnf/document/2_GUID-952E8C3B-738B-40F8-A552-E14026AC78A9_102010201_en-US
  3. Bar, R. Total Analytical Error in Validation of Analytical Procedures of Pharmaceuticals. Pharmaceutical Technology2023 47 (5).


Newsletter Information

Have Questions?

We want to hear your burning bioassay questions.


Send your questions to Dr. Laureen Little (laureen.little@fastraincourses.com) and she and our team of instructors will answer them in the coming newsletters.

Interested in FasTrain Bioassay Courses?

Explore the full list of bioassay courses we offer.


Potency Bioassays Development & Validation


CMC Relative Potency Analytical Methods: A Technical Deep Dive


Introduction to Statistics for Potency Bioassays


Statistical Method in Bioassay


Cell Culture and Cell-Based Assays