|
Gordon T Long Research exclusively distributed at MATASII.com
Subscribe to Gordon T Long Research - $35 / Month - LINK
Complete MATASII.com Offerings - $55/Month - LINK
SEND YOUR INSIGHTFUL COMMENTS - WE READ THEM ALL - [email protected]
| |
|
LONGWave - FEBRUARY 2023
Market Analytics & Technical Analysis
| |
FED TIGHTENING YET FINANCIAL CONDITIONS ARE TIGHTENING??
One of the objectives we have in writing this weekly newsletter is to share with you our macro and market insights. We thought it important to address a confusion we are hearing on how the Fed could be tightening yet the Financial Conditions Index which they publish is loosening? It is important to your investment strategy to fully understand this apparent dichotomy.
Though we will address the mechanics below, the central issue is that the Federal Reserve no longer exerts the financial control it once did, as well as the fact that the world economy currently does not trust the Federal Reserve! The breakdown in trust is centered on the belief that the independent Fed will not be able to withstand the pressure, which the US political system will bring to bear when unemployment begins to inevitably occur in the US. Additionally, the global financial community is increasingly distrustful of US Economic reporting. We will share our views on all of this in this week's newsletter.
| |
|
VIDEO PREVIEW (click image)
Pay-Per-View Page Link
| |
THIS WEEK WE SAW
CPI 6.4% Y-o-Y & 0.5% M-o-M,
PPI 6.0% Y-o-Y & 0.7% M-o-M
| |
|
=========
WHAT YOU NEED TO KNOW
US Financial Conditions have steadily loosened since early October 2022. This has occurred despite Fed Chairman Jerome Powell stating multiple times (most recently on December 14th 2022) that the Fed is focused on Financial Conditions.
- AGGRESSIVE TIGHTENING ACTIONS NOW TAKEN BY THE US FEDERAL RESERVE & BANKS
-
FED FUNDS RATE: Has been raised at an unprecedented rate of 425 bps in 12 months to ~4.58%.
-
QUANTITATIVE TIGHTENING OPERATIONS (QT): Has reduced the Federal Reserve Balance Sheet by $618 Billion as of the end of February 7th, 2023 down to $8.44 Trillion.
- US BANKS ARE ALSO QUICKLY TIGHTENING LENDING STANDARDS
- The Senior Loan Officer Opinion Survey (SLOOS) reflects a rapid and aggressive rate of increase in overall bank lending practices.
- Major US Domestic Banks have been increasing Loan Loss Reserves at an accelerated rate over each of the last three quarters.
- HOWEVER THE FINANCIAL CONDITIONS INDEX IS LOOSENING!
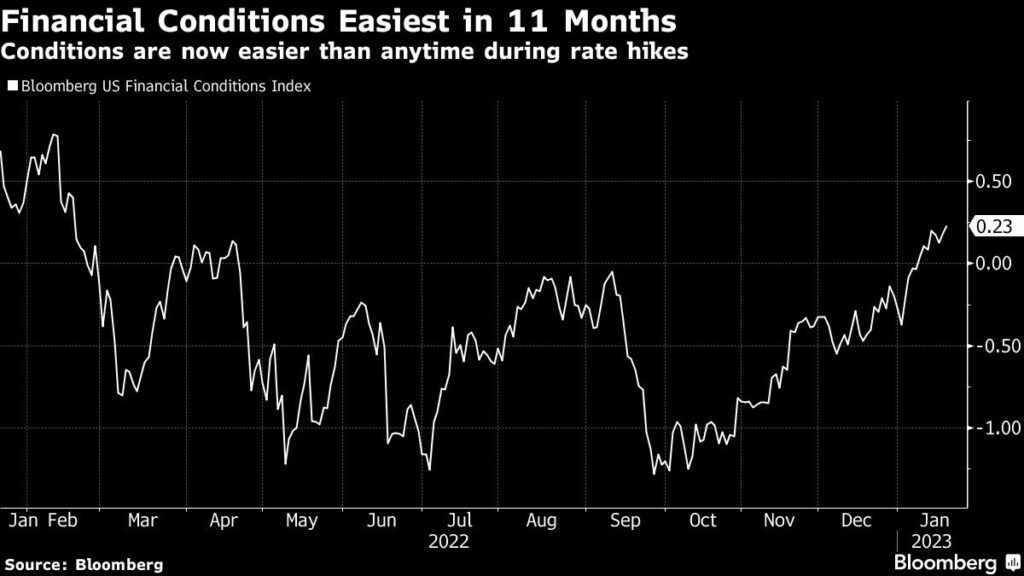
- US FINANCIAL CONDITIONS INDEX
- Financial Conditions are now the easiest they’ve been in nearly a year. To put that into perspective, it means financial conditions are back to where they were BEFORE the Fed ended QE and began raising interest rates.
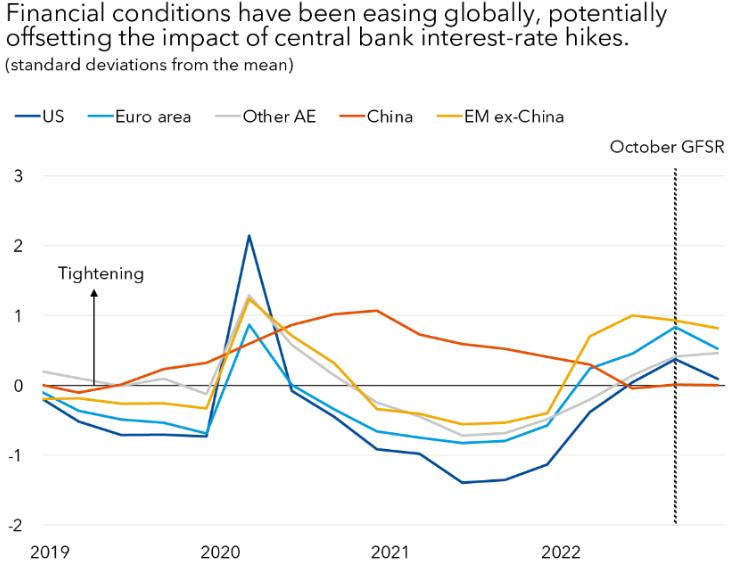
- GLOBAL FINANCIAL CONDITIONS
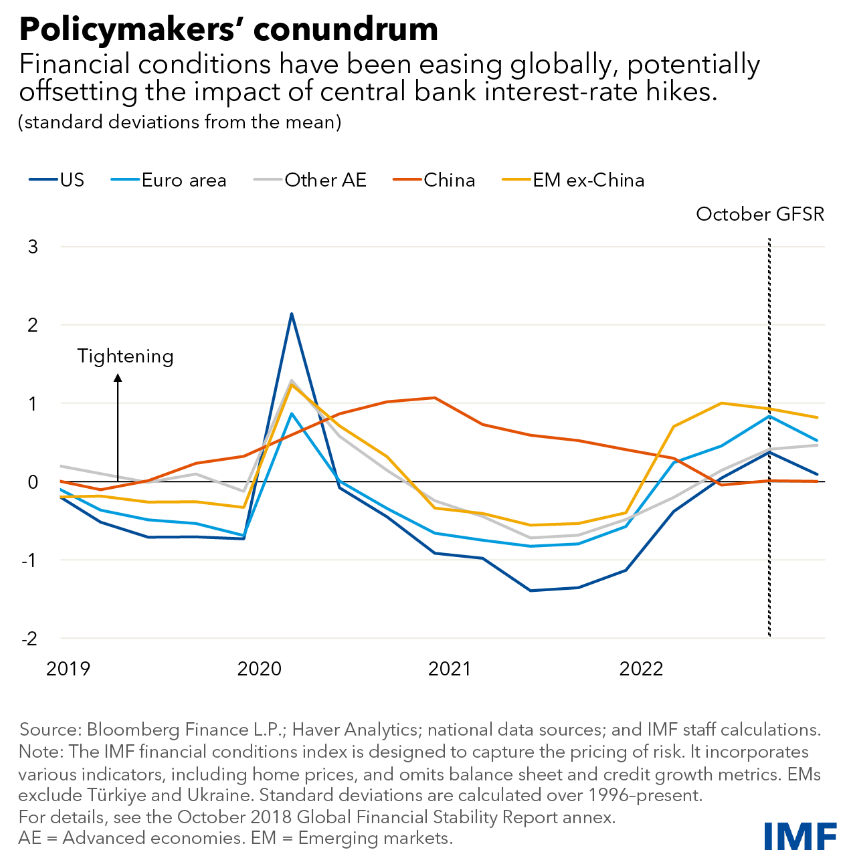
- Growing expectations for lower interest rates and only a shallow economic slowdown have fueled a significant easing in financial conditions in recent months—despite central banks continuing to raise rates. Markets have reflected this relatively benign picture: stock markets have rallied, and credit spreads narrowed considerably.
| |
|
- GLOBAL EXPECTATIONS DON'T MATCH FED'S CURRENT ACTIONS
- GLOBAL LACK OF CONFIDENCE:
- IN THE FED 'S ABILITY TO STAND FIRM,
-
IN THE FED'S GRASP OF THE SITUATION (12 month's of mistaken "Inflation Is Transitory" ),
-
IN US ECONOMIC REPORTING STATISTICS (Flawed BLS & Dept of Commerce reported #'s - Global Markets don't believe the happy talk of "soft landing").
- There is difference in Leading, Concurrent and Lagging Indicators
- Expect Volatility and with it re-pricing of Risk, Options and Rates
- Markets highly likely to be caught offside
The fully expected and overdue recessionary deflationary scare is soon to arrive in H2 2023.
=========
| |
|
TIGHTENING ACTIONS TAKEN BY THE US FEDERAL RESERVE
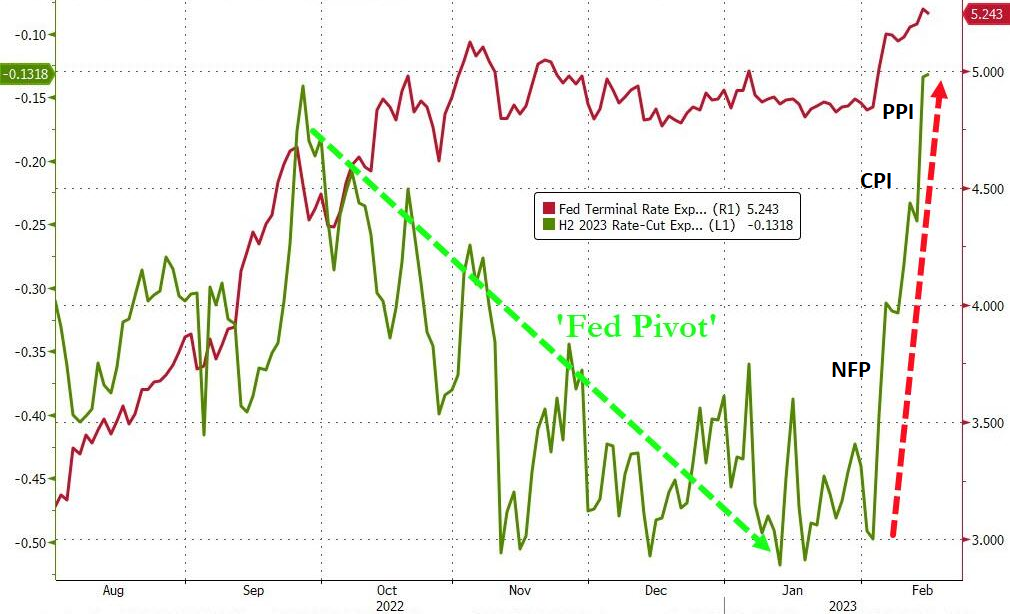
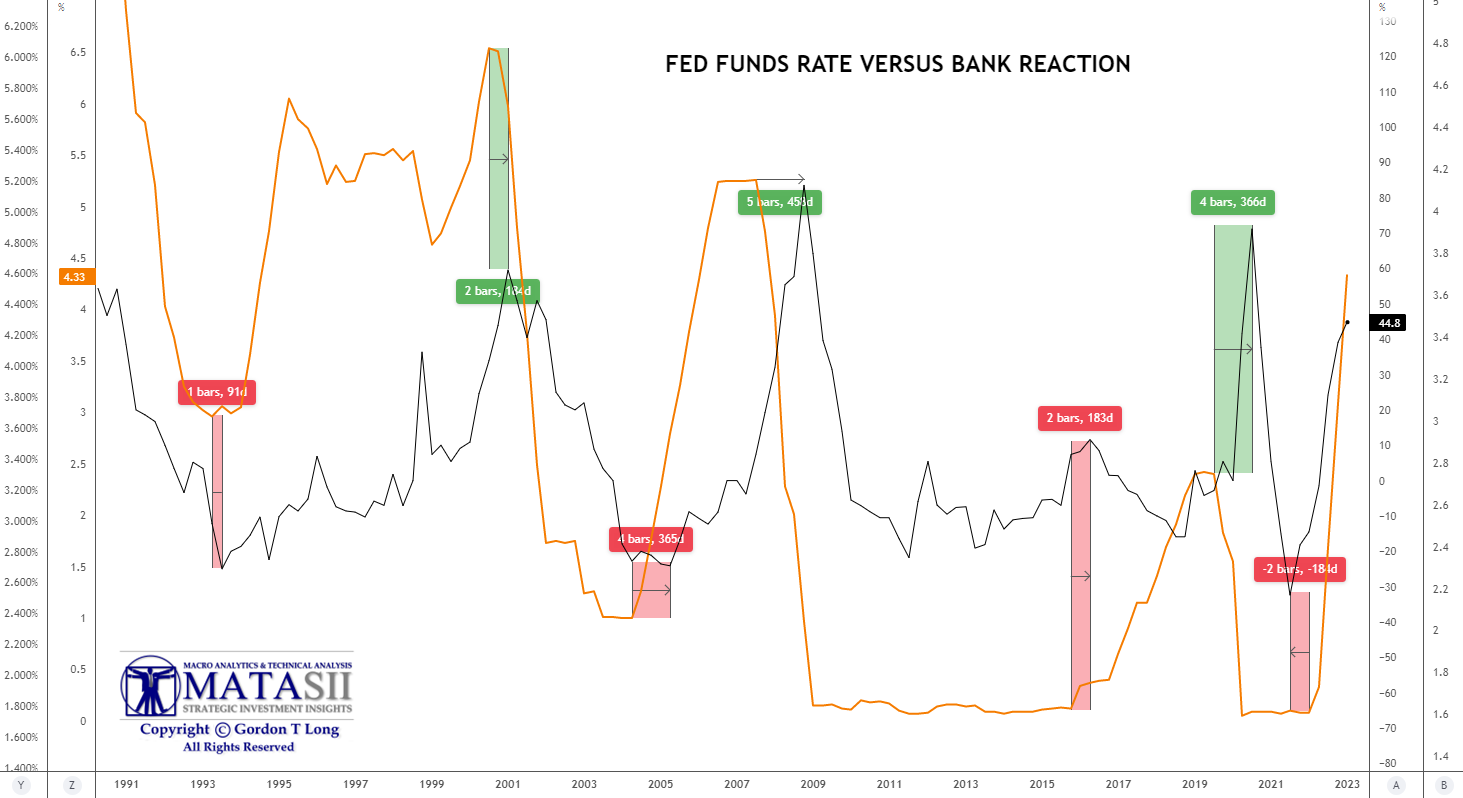
This week's CPI and PPI releases forced significant reassessment of the timing of the much anticipated Fed Pivot. The chart to the right shows the degree of shift in the expectations for the Fed Pivot since the prior week's Non-Farm Payroll (NFP) surge.
The Fed's expected Terminal Rate (shown in red) has also risen to ~5.24%. with a lot of chatter now looking for a possibility of 6% before any Pivot occurs.
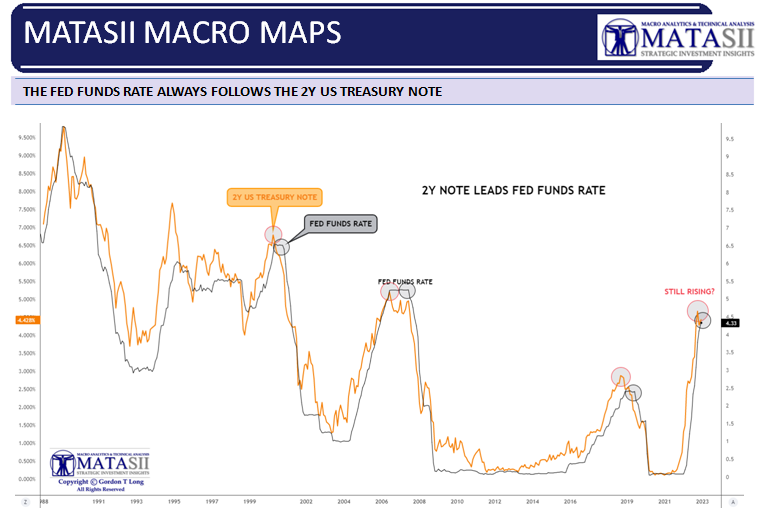
Continue to watch the yield on the 2Y Treasury Note as it has historically always led the Fed Funds Rate. It is the view of many (myself included) that the Fed actually follows the 2 Year Treasury Bill, as it represents what the Primary Dealers (the actual shareholders of the Federal Reserve System) expect. We are likely to see both the 2Y and Fed Funds Rate rise further and then pause as it did in the prior periods labeled below.
| |
|
YOUR DESK TOP / TABLET / PHONE ANNOTATED CHART
Macro Analytics Chart: SUBSCRIBER LINK
| |
|
The following has been achieved by the Federal Reserve so far:
-
FED FUNDS RATE: Has been raised at an unprecedented rate of 425 bps in 12 months to 4.75 (Closed Friday at~4.58%)
-
QUANTITATIVE TIGHTENING OPERATIONS (QT): Has reduced the Federal Reserve Balance Sheet by $618 Billion as of the end of February 7th, 2023 down to $8.44 Trillion
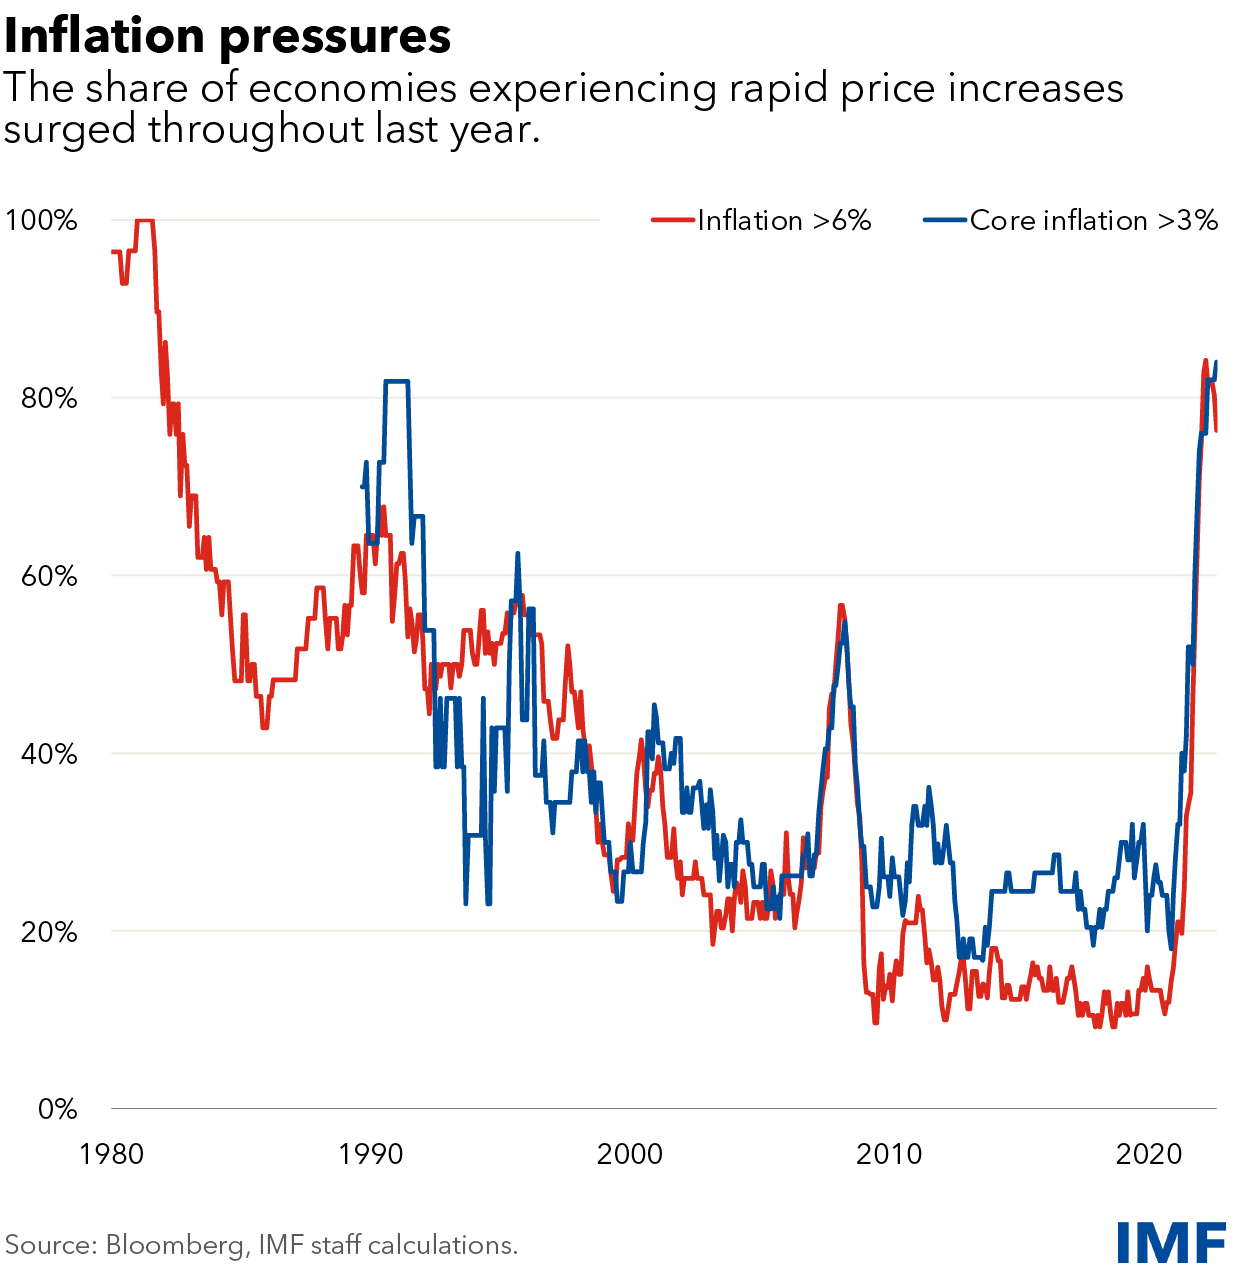
Despite this historically aggressive action by the Fed, the situation is different globally. Inflation is not deemed to be receding. In fact with the US dollar falling, the United States is currently exposed to importing further inflation pressures.
CHART RIGHT: Inflation has topped 6 percent in more than four-fifths of the world’s economies, while increasingly broad-based price gains were recently lifting expectations for further increases to multi-decade highs. Those expectation have cooled.
| |
|
US BANKS ARE ALSO AGGRESSIVELY TIGHTENING LENDING STANDARDS
The major US Banks (the Primary Dealers and Money Centered Banks) are even more aggressively tightening consumer and corporate credit. The traditional scenario of developments is represented by the following sequence:
2Y >>> FED FUNDS RATE >>> BANK TIGHTENING >>> LOAN DELINQUENCIES >>> LAYOFFS >>> DEFAULTS
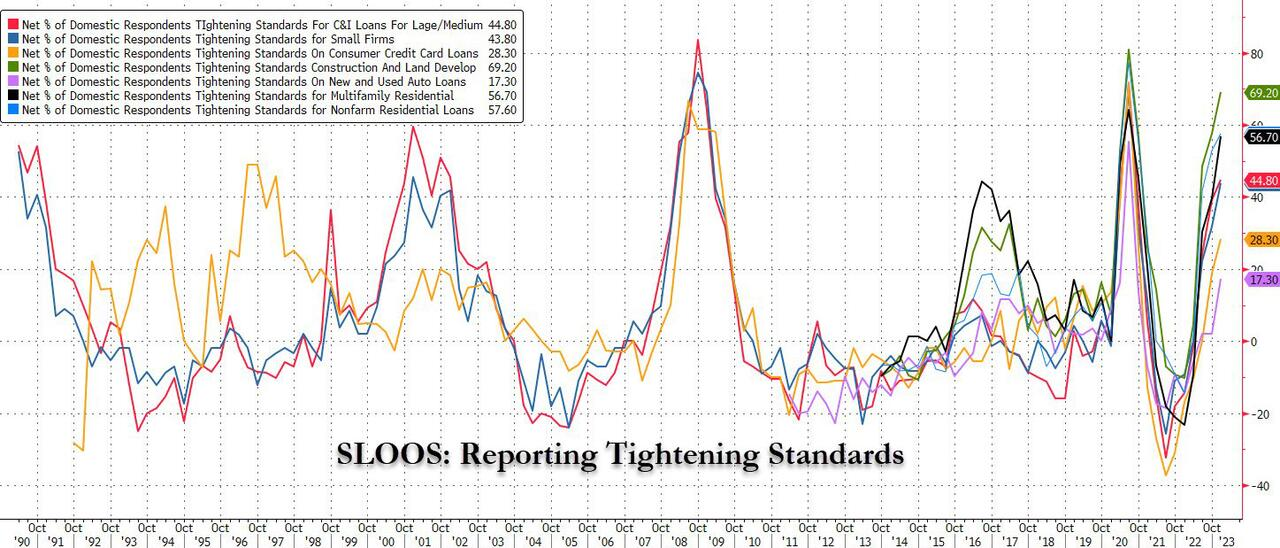
AN IMPORTANT TELL: BANK CREDIT TIGHTENING
The Fed follows the 2Y Treasury Note, which historically is followed by banks tightening consumer credit. What we see below (Fed Funds Rate in pink, credit tightening in black) is that this time the banks began tightening consumer and major lender credit PRIOR to the Fed Increasing rates. Clearly the banks are highly concerned about the safety of their loans. This is also evident in the degree of loan loss reserves being taken by these banks over the last three quarters.
This divergence suggests that even US banks are not confident in the policies the Federal Reserve has taken since the Covid-19 shock.
| |
SLOOS = Senior Loan Officer Opinion Survey (specifically to Bank Lending Practices) | |
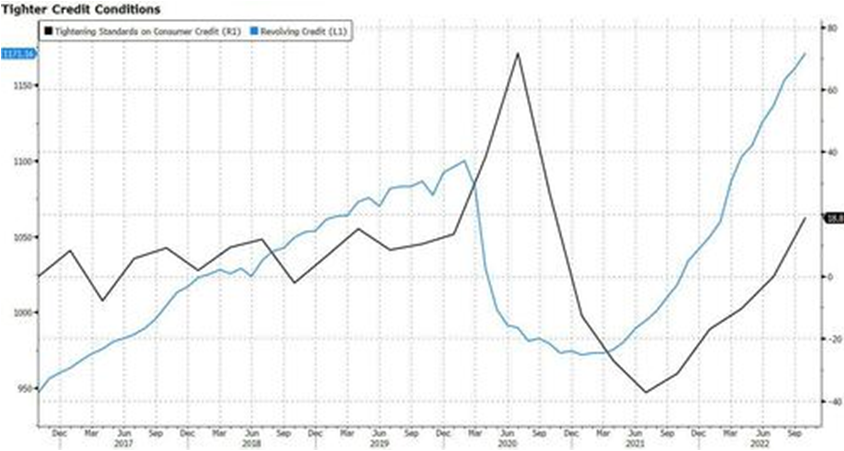
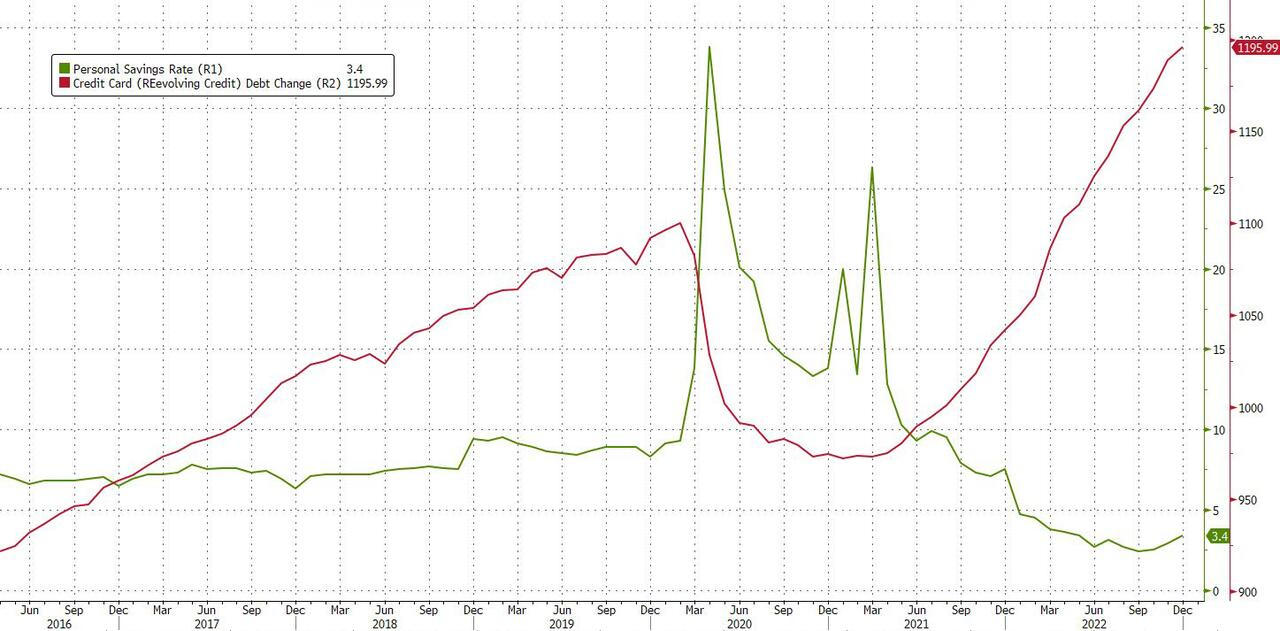
As revolving credit (credit card debt) exploded higher (turquoise line), Consumer Credit has been steadily tightened (black line). | |
US savings (especially excess Covid savings) were spent long ago and flatlined near record lows in recent months. It has all been up to credit cards and other sources of (repurposed) credit - like pretending one's student loans are actually going to studying when instead they were used to buy iPhones, TVs, booze and only fans subs. | |
|
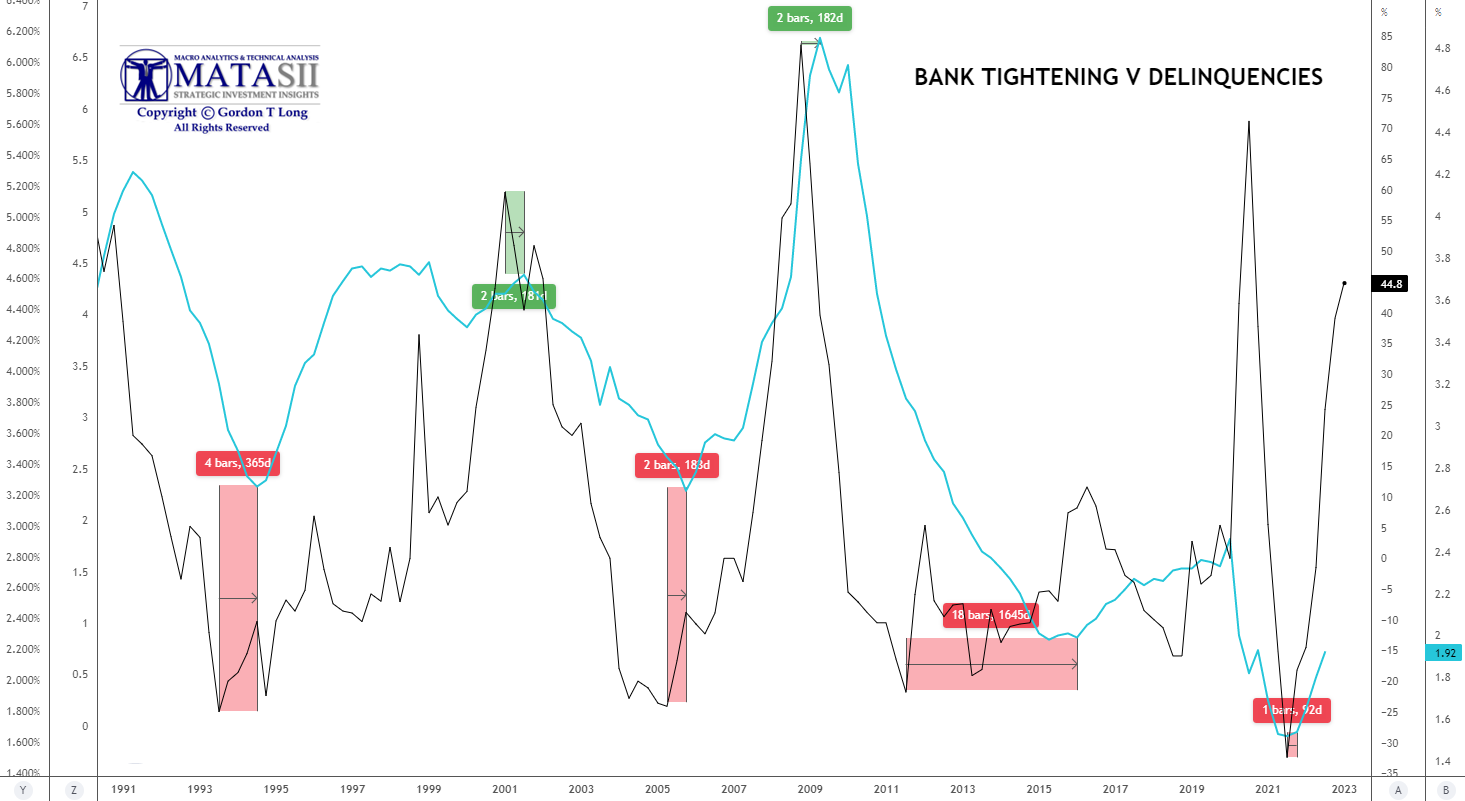
BANK LOAN DELINQUENCIES
Bank Loan Delinquencies historically follow the banks tightening credit. The charts below show this, (Bank Tightening in Black and Delinquencies in Green).
NOTE: This should remind you of my Grandfather story in the last newsletter. The banks tighten when people need the credit the most.
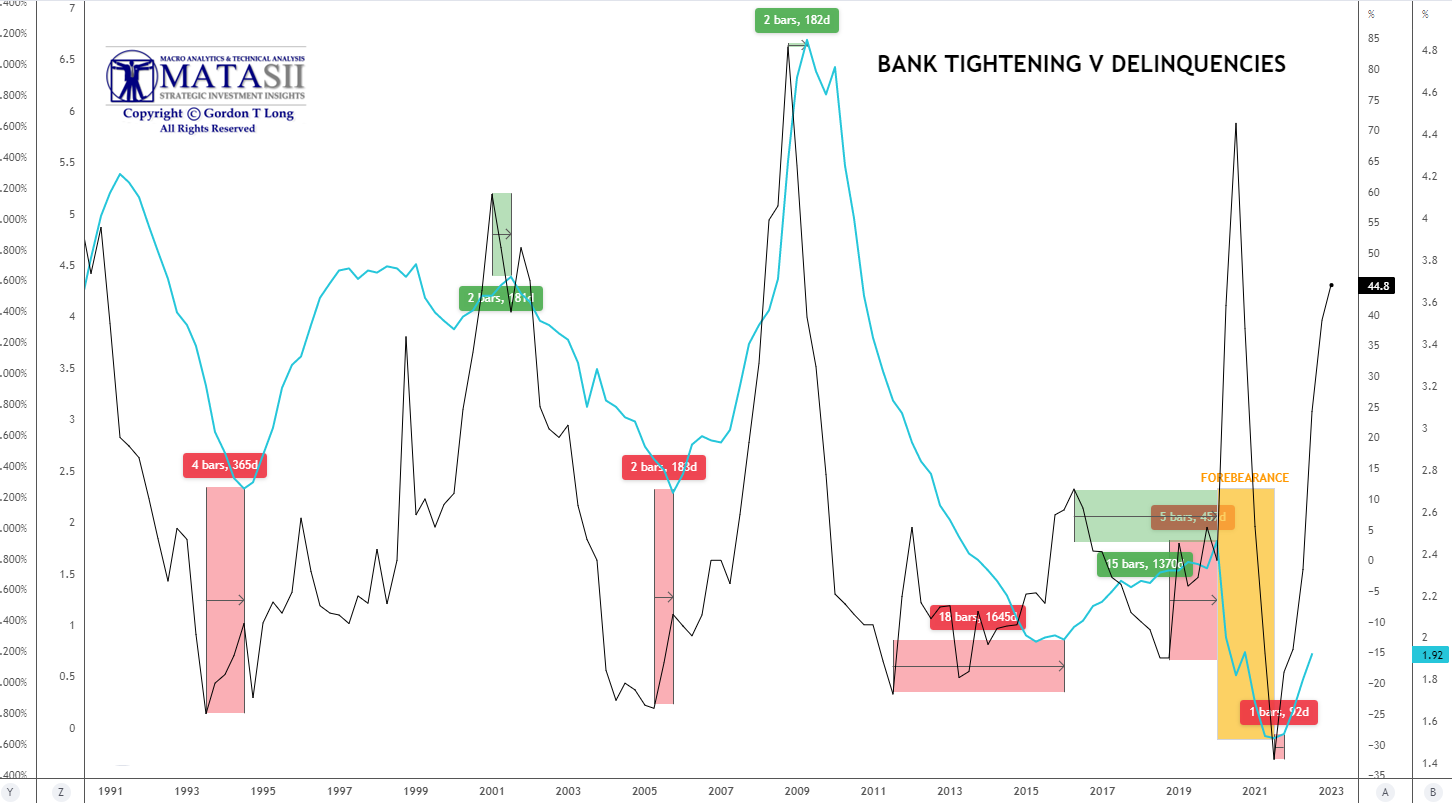
What the chart on the right highlights is how significantly issues associated with Government Covid-19 Forbearance policies and bank forgiveness have disrupted and "messed" with the US banking system. The banks are aggressively trying to protect themselves to the best degree they can, as they see consumer savings plummet now that the government stimulus checks have generally stopped and the SNAP program is being tightened.
The degree of bank credit tightening is at levels seen prior to the 2008 Financial Crisis and popping of the 2000 Dotcom Bubble.
| |
|
ABOVE: Delinquencies (in Green) are only now beginning to rise while Fed Tightening is approaching levels last seen prior to the major Financial Crisis in 2000 and 2008. (click chart to expand)
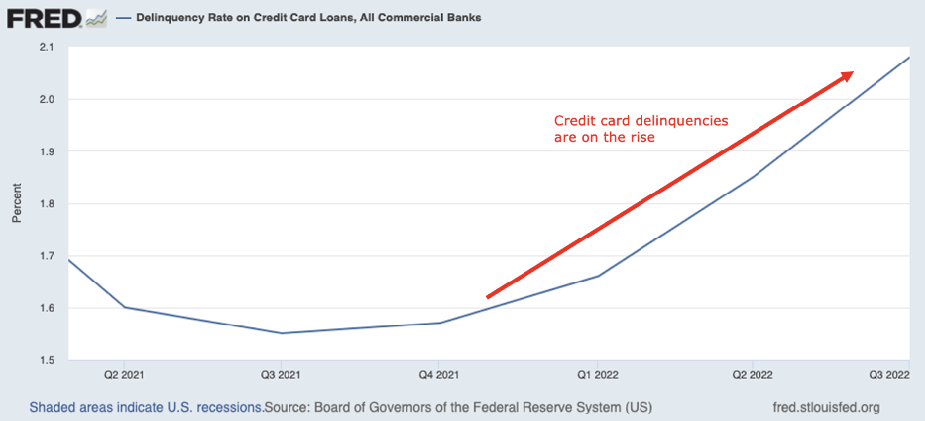
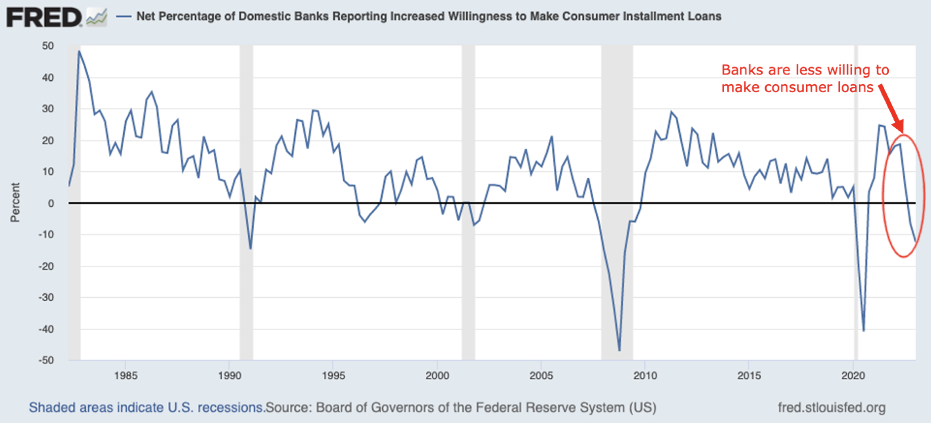
BELOW: Banks are wary of making new loans right now because consumer defaults are on the rise. The chart below shows the recent acceleration in delinquency rates on credit card debt
| |
|
ABOVE: The US Banking sector is grappling with major fallout from Covid-19 Government Forbearance and Bank Forgiveness policies. To protect themselves they have been forced to be particularly aggressive in increasing new and existing loan standard. (click chart to expand)
BELOW: Over the last twelve months, the percent of U.S. banks reporting an increased willingness to make new consumer loans has plunged deep into negative territory.
| |
|
FINANCIAL CONDITIONS INDEX
So with all this tightening, why is the Fed's own Financial Conditions Index rising??
| | |
|
Financial conditions are now the easiest they’ve been in nearly a year. To put that into perspective, it means financial conditions are back to where they were BEFORE the Fed ended QE and began raising interest rates (ABOVE).
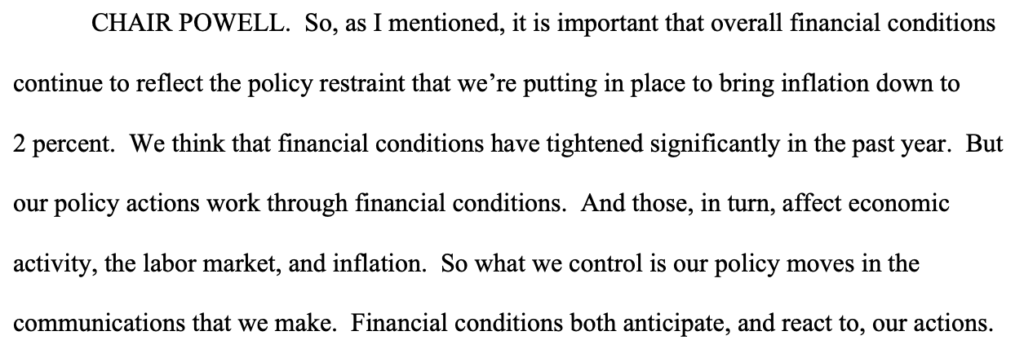
Fed Chair Jerome Powell has stated multiple times (most recently on December 14th 2022) that the Fed focuses on financial conditions. See for yourself (RIGHT).
Since late last year financial markets have rebounded strongly on retreating energy prices and signs that inflation may have peaked. In some economies, prices for goods included in core inflation measures, such as autos and furniture, have fallen. Global economic growth is now expected to slow this year, with divergent views on the extent to which unemployment would likely need to rise to cool what has been a hot labor market.
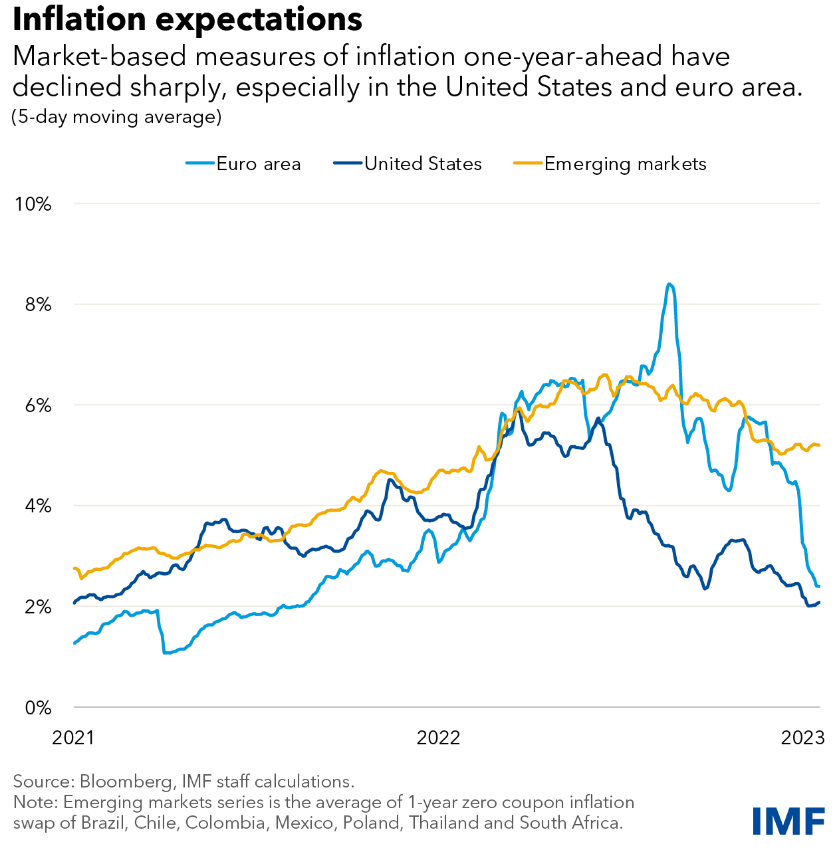
These signs of progress in reducing inflationary pressures amidst continued strength in labor markets have offered reason to believe that policymakers may have succeeded in taming inflation with little cost to economic growth, a so-called soft landing. In the United States and the euro area, market-based measures of inflation one year ahead have returned to near the central banks’ 2 percent target from 6 percent last spring. Gauges for several other advanced economies have seen similar drops. In emerging markets, such market-based measures of inflation one year ahead have also been falling, albeit at a slower pace.
| |
|
EXPECTED EASING
These disinflation hopes have been accompanied by growing expectations that central banks will soon not only stop tightening policy but also reduce rates fairly quickly. In many economies, this has led to yields on long-dated government debt falling below short-dated maturities. Historically, such an inversion of the yield curve often precedes recessions.
Analyst assessments in fact point to significant recession risk in many economies, but the expectation is that recessions, should they occur, will be mild.
Growing expectations for lower interest rates and only a shallow economic slowdown have fueled a significant easing in financial conditions in recent months—despite Central banks continuing to raise rates. Markets have reflected this relatively benign picture: stock markets have rallied and credit spreads narrowed considerably.
| |
|
This easing of financial conditions during a Central bank tightening cycle creates a conundrum for policymakers.
- On the one hand, financial markets are signaling that disinflation may occur without meaningful increases in unemployment. Policymakers could embrace that view, and in effect ratify the loosening of financial conditions. Many observers concerned that Central banks will be overzealous about tightening monetary policy—and will cause an unnecessarily painful economic downturn—are endorsing such a view.
- Alternatively, Central banks could push back against investor optimism, emphasizing the risks that inflationary pressures may be more persistent than expected. This risk-management approach would require restrictive interest rates for longer, until there’s tangible evidence of a sustained decline in inflation.
While doing so could induce a repricing of the policy path and of risk assets in financial markets—possibly causing equity prices to fall and credit spreads to widen—there are three reasons why such an approach is needed to ensure price stability.
- History shows high inflation is often persistent—and may possibly ratchet up further—without forceful and decisive monetary policy actions to reduce it.
- While goods inflation has come down, it seems unlikely that the same will happen for services without significant labor-market cooling. Crucially, Central banks must avoid misreading sharp declines in goods prices and easing policy before services inflation and wages, which adjust more slowly, have also moderated markedly.
- Experience suggests that prolonged periods of rapid price gains make inflation expectations more susceptible to de-anchoring, as such an inflationary mindset becomes more entrenched in the behavior of households and firms.
US ECONOMIC REPORTING STATISTICS
In our sequential process we showed earlier, it highlighted the expected coming wave of layoffs.
2Y >>> FED FUNDS RATE >>> BANK TIGHTENING >>> LOAN DELINQUENCIES >>> LAYOFFS >>> DEFAULTS
This is critical to watch closely and to not be fooled by false analysis and poor media coverage. We have written about this previously. I wasn't surprised this week when listening to a featured guest expert on CNBC when asked about layoffs and a potential recession / hard landing, he laughed it off. His rational, which the CNBC hosts quickly nodded in agreement, was that we just reported generating 500,000 new jobs in the January Non-Farm Payrolls (NFP) report which "far outstripped the minor layoffs being reported". This is one example of how the media and government BLS reporting are misleading.
US ECONOMIC REPORTING STATISTICS
- JOBS:
- The reason the U.S. economy supposedly “added” 500,000+ jobs in January was due to an accounting gimmick, NOT because those jobs were actually created.
- The Bureau of Labor Statistics (BLS) openly admits this, citing that without its “population control effect” the economy added… 84,000 jobs.
- Between seasonal adjustments and the fact that the vast number of new jobs are part time with limited hours to avoid mandated health benefits coverage is a major employment distortion.
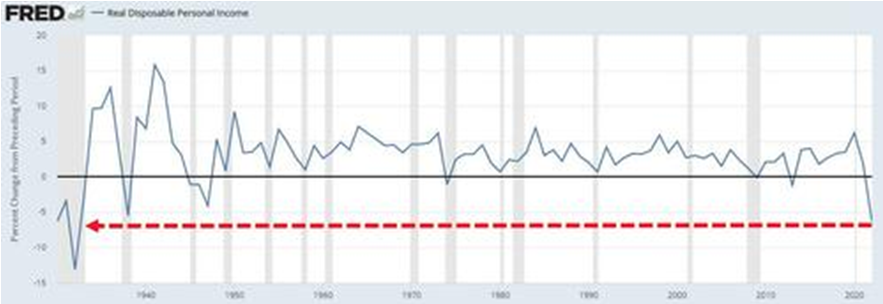
- Wages and hours worked are not keeping up with a collapse in real disposable personal income (chart below - worst since height of the Great Depression in 1932).
| |
- CPI:
- The inflationary data is being revised upwards - The US revised its entire 2022 CPI data higher. December is now 0.1% m-o-m not -0.1% as first reported, November 0.2% instead of 0.1%, and October 0.5% not 0.4%.
- PPI:
- The Producer Price Index results for January 2023 were reported yesterday. They showed inflation rising 0.7% month over month. On an annualized basis this puts inflation over 9%.
- Retail sales are booming because of INFLATION (things cost more), not because of consumer spending. All of the retail sales data is nominal - i.e. not adjusted for inflation
- Aggressive seasonal adjustments, same as payrolls: one-time
- COLA adjustment (+8.7): one-time
- Post-holiday spending spree to take advantage of liquidation sales: one-time.
| |
|
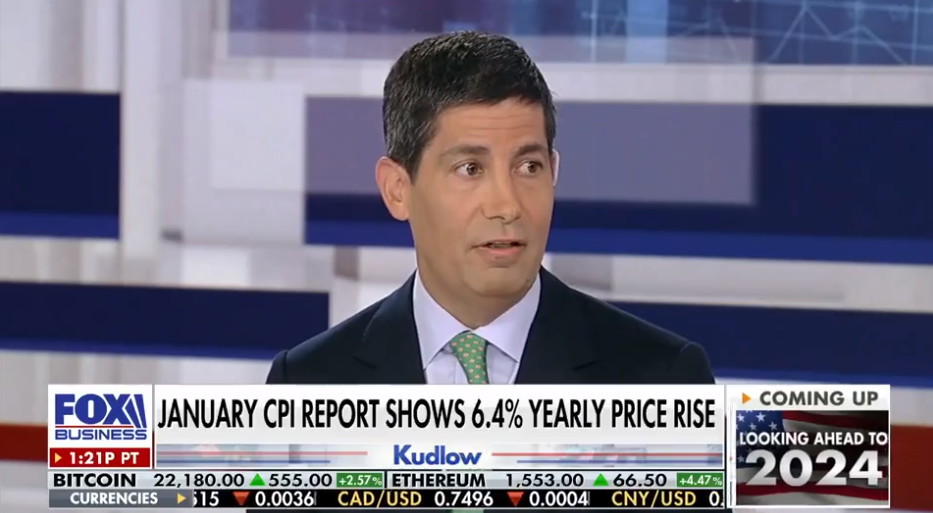
Start at 6:16
Former 6 Year Fed Governor Kevin Warsh
Fox's Kudlow 02-15-23
On a Data Dependent Fed -- "No major corporation would use data from the BLS or Commerce Department!"
| |
|
YOUR DESK TOP / TABLET / PHONE - REAL TIME CHART
MATASII.com: SUBSCRIBER LINK
| |
|
CONCLUSION
The market and business media are underestimating what is currently happening in the US labor market.
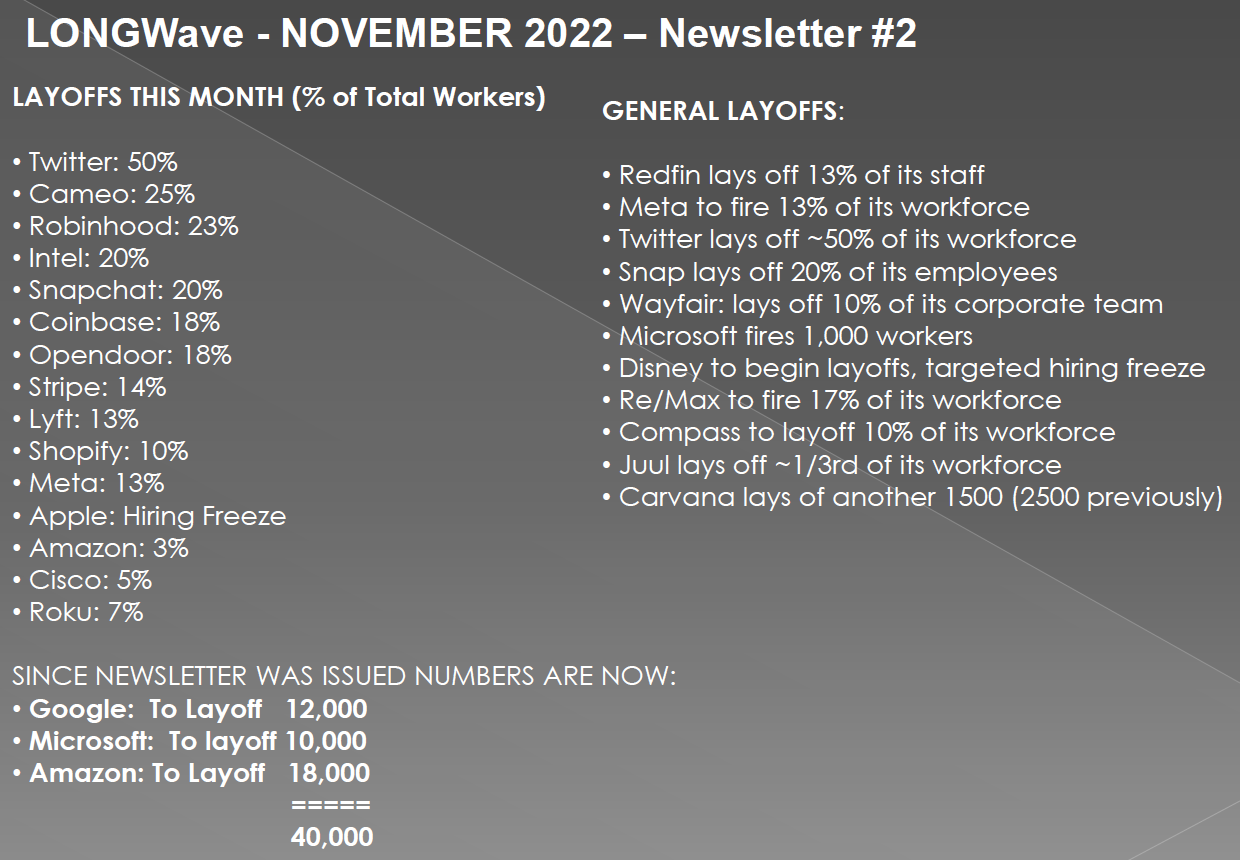
Layoffs are happening in a major way but are not being reported, because the layoff numbers are not headline grabbing. Corporations and companies don't have the large numbers of employees to cut. Therefore the important numbers are percentages of total employee population. These are ranging from staggering levels of 10-25% (see chart right from November LONGWave which have only gotten worse).
Additionally there is a lack of appreciation of the difference in Leading, Concurrent and Lagging Indicators. Layoffs are a lagging indicator. They are soon to get much worse when we consider historic bank tightening and loan delinquency relationships.
- Expect Volatility and with it re-pricing of Risk, Options and Rates
- Markets highly likely to be caught offside
| |
|
RECAP
- The reason the U.S. economy supposedly “added” 500,000+ jobs in January was due to an accounting gimmick, NOT because those jobs were actually created.
- The Bureau of Labor Statistics (BLS) openly admits this, citing that without its “population control effect”, the economy added… 84,000 jobs.
- The only part of the inflation data that has dropped has been in Energy prices.
- The reason Energy prices dropped was because the Biden administration dumped over 250 MILLION barrels of oil in the last two years.
- Retail sales are booming because of INFLATION (things cost more), not because of consumer spending. The jump on credit card debt and massive decline in consumer savings confirms that Americans are maxing out their credit just to get by.
Perhaps the single most disturbing element of the above items is that they reveal the complete failure of the Federal Reserve to tame inflation. Indeed, according to the Taylor Rule, which is widely considered one of the best indicators of where rates should be, the Fed should have ALREADY raised rates to over 9% to stop inflation.
Instead the Fed has raised rates to 4.75% and is now talking about possibly one or two more rate hikes of just 0.25%.
Everywhere you look, the Fed is failing miserably at curtailing inflation.
- Financial conditions are now as loose if not looser than they were before the Fed began tightening monetary policy.
- Meme stock mania is back with garbage companies rallying 30%, 50% even 100% or more in the last few weeks… again just like before the Fed began tightening monetary policy.
- The inflationary data is being revised upwards: December’s -0.1% CPI report has been revised upwards to 0.1%, October and November's CPI numbers were also revised higher.
- The Producer Price Index results for January 2023 were reported yesterday. They showed inflation rising 0.7% month over month. On an annualized basis this puts inflation over 9%.
And all of this is AFTER the Fed raises rates 4.5% and drains over $500 billion in liquidity from the system!
INFLATION IS NOT UNDER CONTROL
| |
CURRENT MARKET PERSPECTIVE | |
|
CPI / PPI WERE THE MARKET MOVERS THIS WEEK
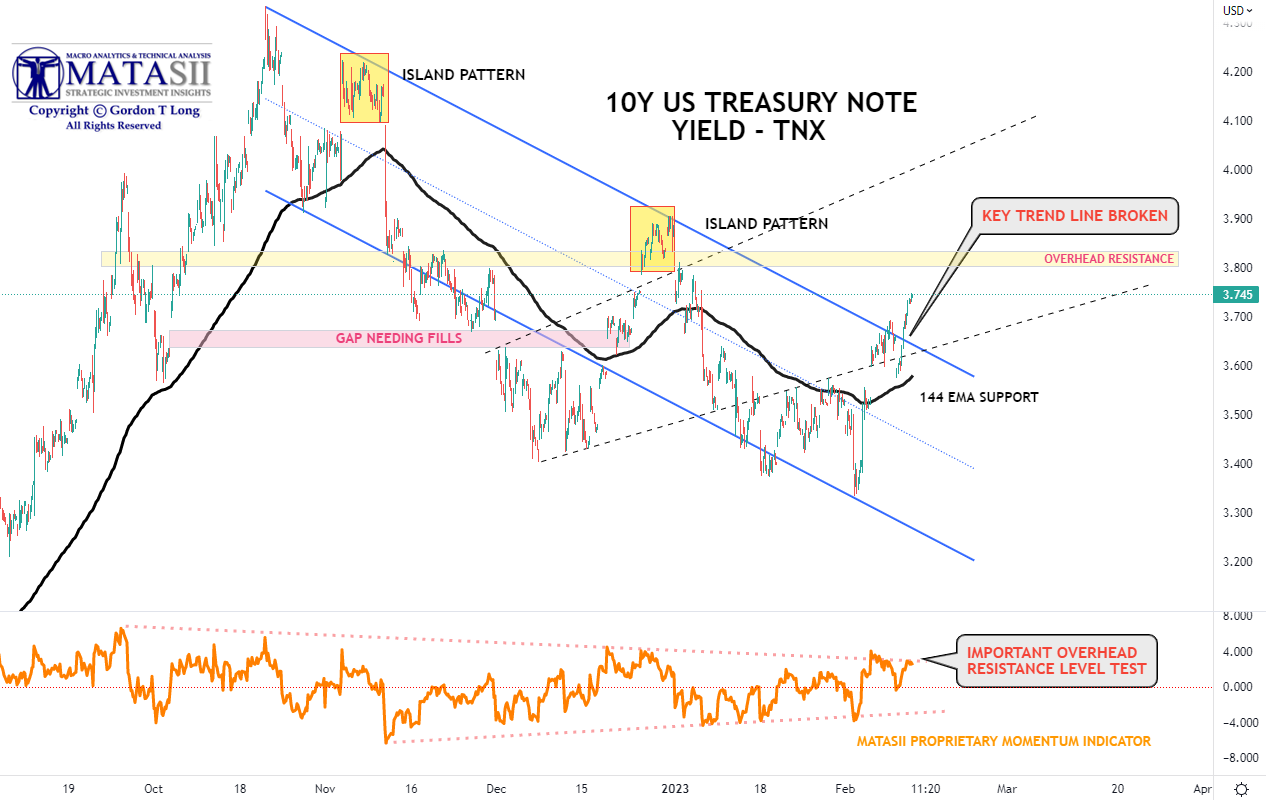
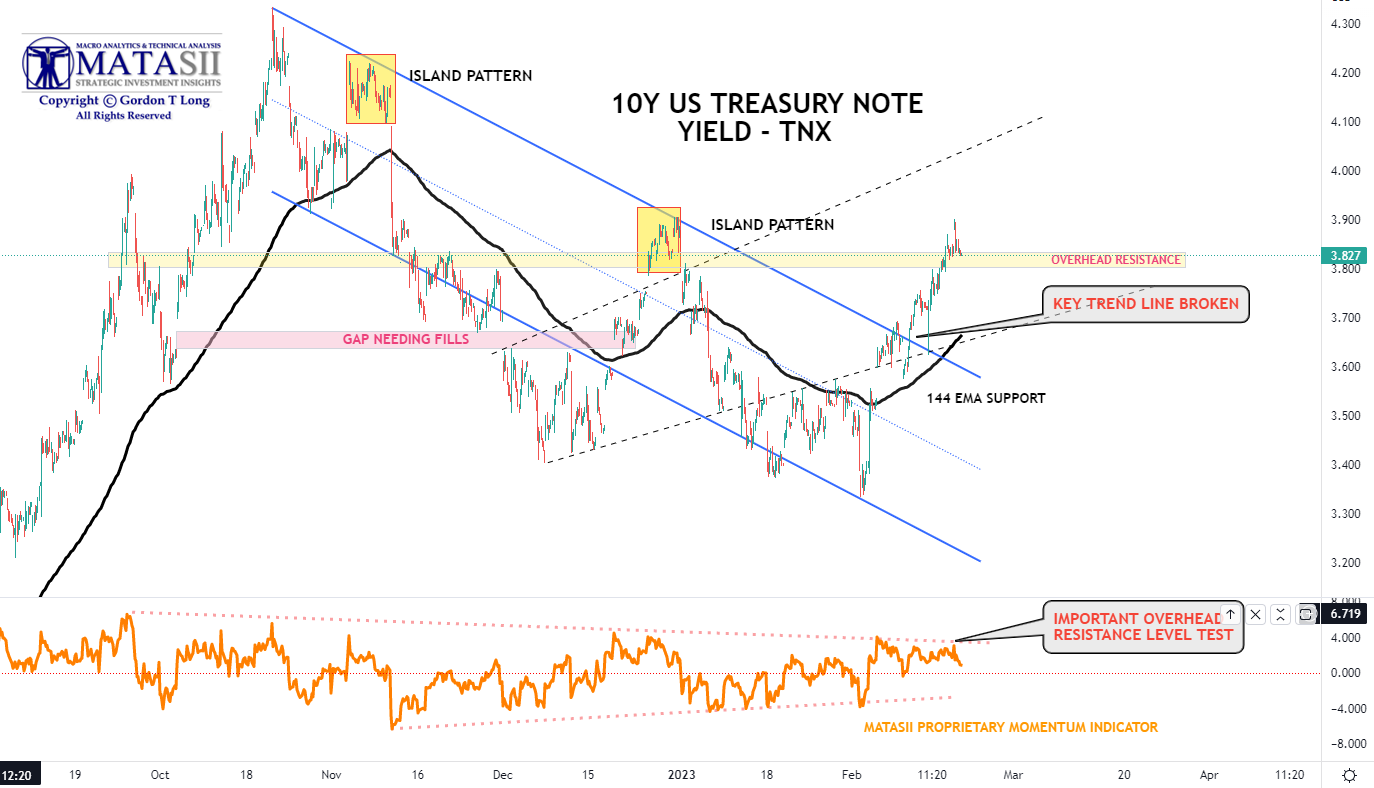
In our last newsletter, we cautioned that CPI and PPI would be market movers this week. Additionally, it was options expiration on $1.8 Trillion! We felt the bond market merited watching. We highlighted the chart to the right.
BOTTOM is the updated version as of Friday close 02-17-23.
We got the yield lift to the overhead resistance level we had identified. In the lower pane our MATASII Momentum Indicator again had shown what to expect and was proven right.
| |
We now see the 10Y US Treasury operating in the yield range from 3.5% to 4.0% in the short term.
Watch the 2Y US Treasury Note Yield for warnings of a major change coming to them equity or bond market (SUBSCRIBER LINK)
| |
|
YOUR DESK TOP / TABLET / PHONE ANNOTATED CHART
Macro Analytics Chart: SUBSCRIBER LINK
| |
NOTICE Information on these pages contains forward-looking statements that involve risks and uncertainties. Markets and instruments profiled on this page are for informational purposes only and should not in any way come across as a recommendation to buy or sell in these assets. You should do your own thorough research before making any investment decisions. MATASII.com does not in any way guarantee that this information is free from mistakes, errors, or material misstatements. It also does not guarantee that this information is of a timely nature. Investing in Open Markets involves a great deal of risk, including the loss of all or a portion of your investment, as well as emotional distress. All risks, losses and costs associated with investing, including total loss of principal, are your responsibility.
| |
MATASII'S STRATEGIC INVESTMENT INSIGHTS | |
2020 VIDEOS OUTLINING THE COMING RISE IN INFLATION & COMMODITY PRICES | |
|
LONGWave - FEBRUARY 2023
Pay-Per-View Options
| |
|
RELEASED - 02-08-23
VIDEO: 18 Minutes with 41 supporting slides.
NEW RELEASES IMMEDIATELY AVAILABLE TO NON-SUBSCRIBERSON A PAY-PER-VIEW BASIS
$4.99
Pay-Per-View Page Link
| |
|
LINK: SUBSCRIBER LINK
TRANSCRIPTION: SUBSCRIBER LINK
| |
IDENTIFICATION OF HIGH PROBABILITY TARGET ZONES | |
Learn the HPTZ Methodology!
Identify areas of High Probability for market movements
Set up your charts with accurate Market Road Maps
Available at Amazon.com
| |
The Most Insightful Macro Analytics On The Web | |
PO Box 1224,
Norton, MA 02766
(508) 285 2213
| | | | | |