Dear Florida Climate Center Friends, | |
In this Summer 2026 edition of our newsletter, we present our latest monthly climate summaries for the past three months, as well as recent rainfall patterns and drought conditions around the state. We also discuss what to expect with the transition to El Niño in the Pacific Ocean and how this is likely to impact the Atlantic hurricane season, as well as what it may mean for lingering drought and our fall and winter weather. Last, we share some of the recent events and engagements we've been involved in. We hope you have a great start to summer and, as always, if you have any questions feel free to reach out to us at climate@coaps.fsu.edu.
Thanks,
The Staff of the Florida Climate Center
| |
| Monthly climate summaries for Florida | |
The Florida Climate Center's monthly Climate Summaries for spring are available. These summaries provide an analysis of temperature and precipitation patterns across the state, along with data on hazardous weather, drought, and daily records tied or broken each month.
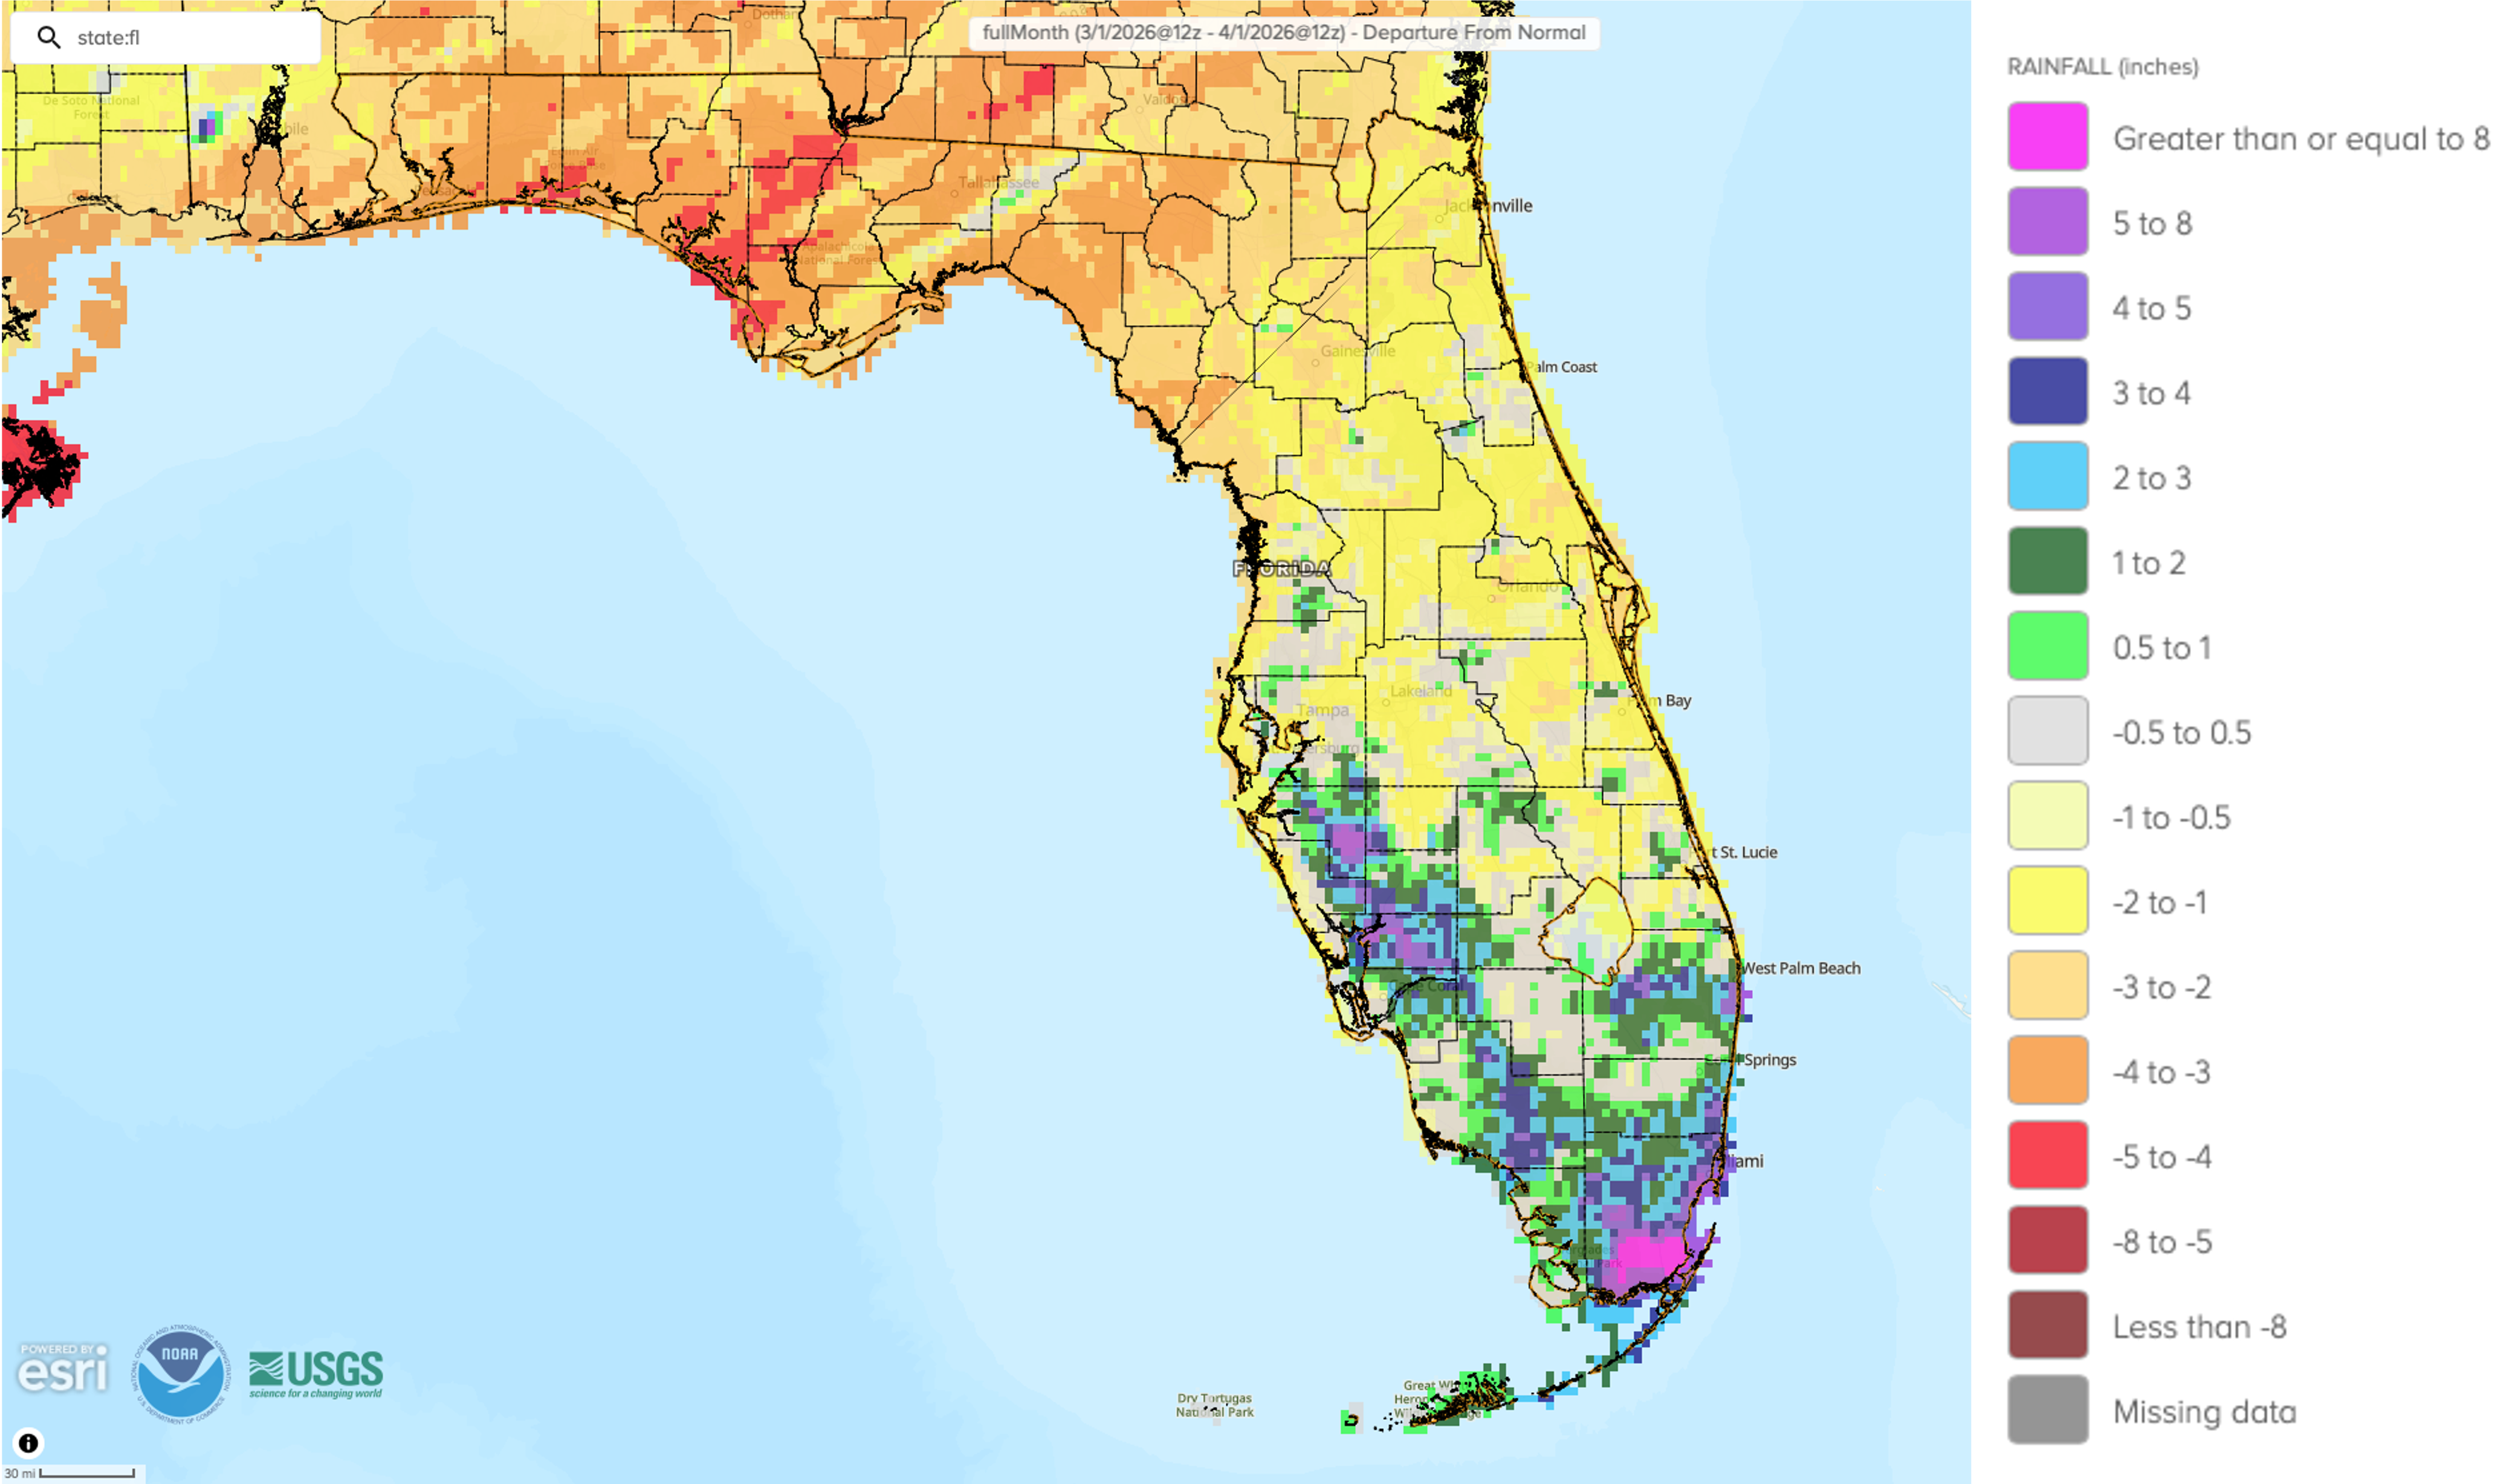
March monthly average temperatures were above normal. Average monthly temperature departures from normal ranged from +1.9 ̊F in Miami to +5.1 ̊F in Gainesville. Tampa observed its earliest 90 ̊F day on record on March 6 (prior record was March 16, 1945), and Jacksonville reached its earliest 92 ̊F day or higher on record on March 10 (prior record was March 28, 2020 at 94 ̊F). March featured large temperature swings and a late season freeze occurred on March 18 with the passage of a cold front that impacted northern Florida.
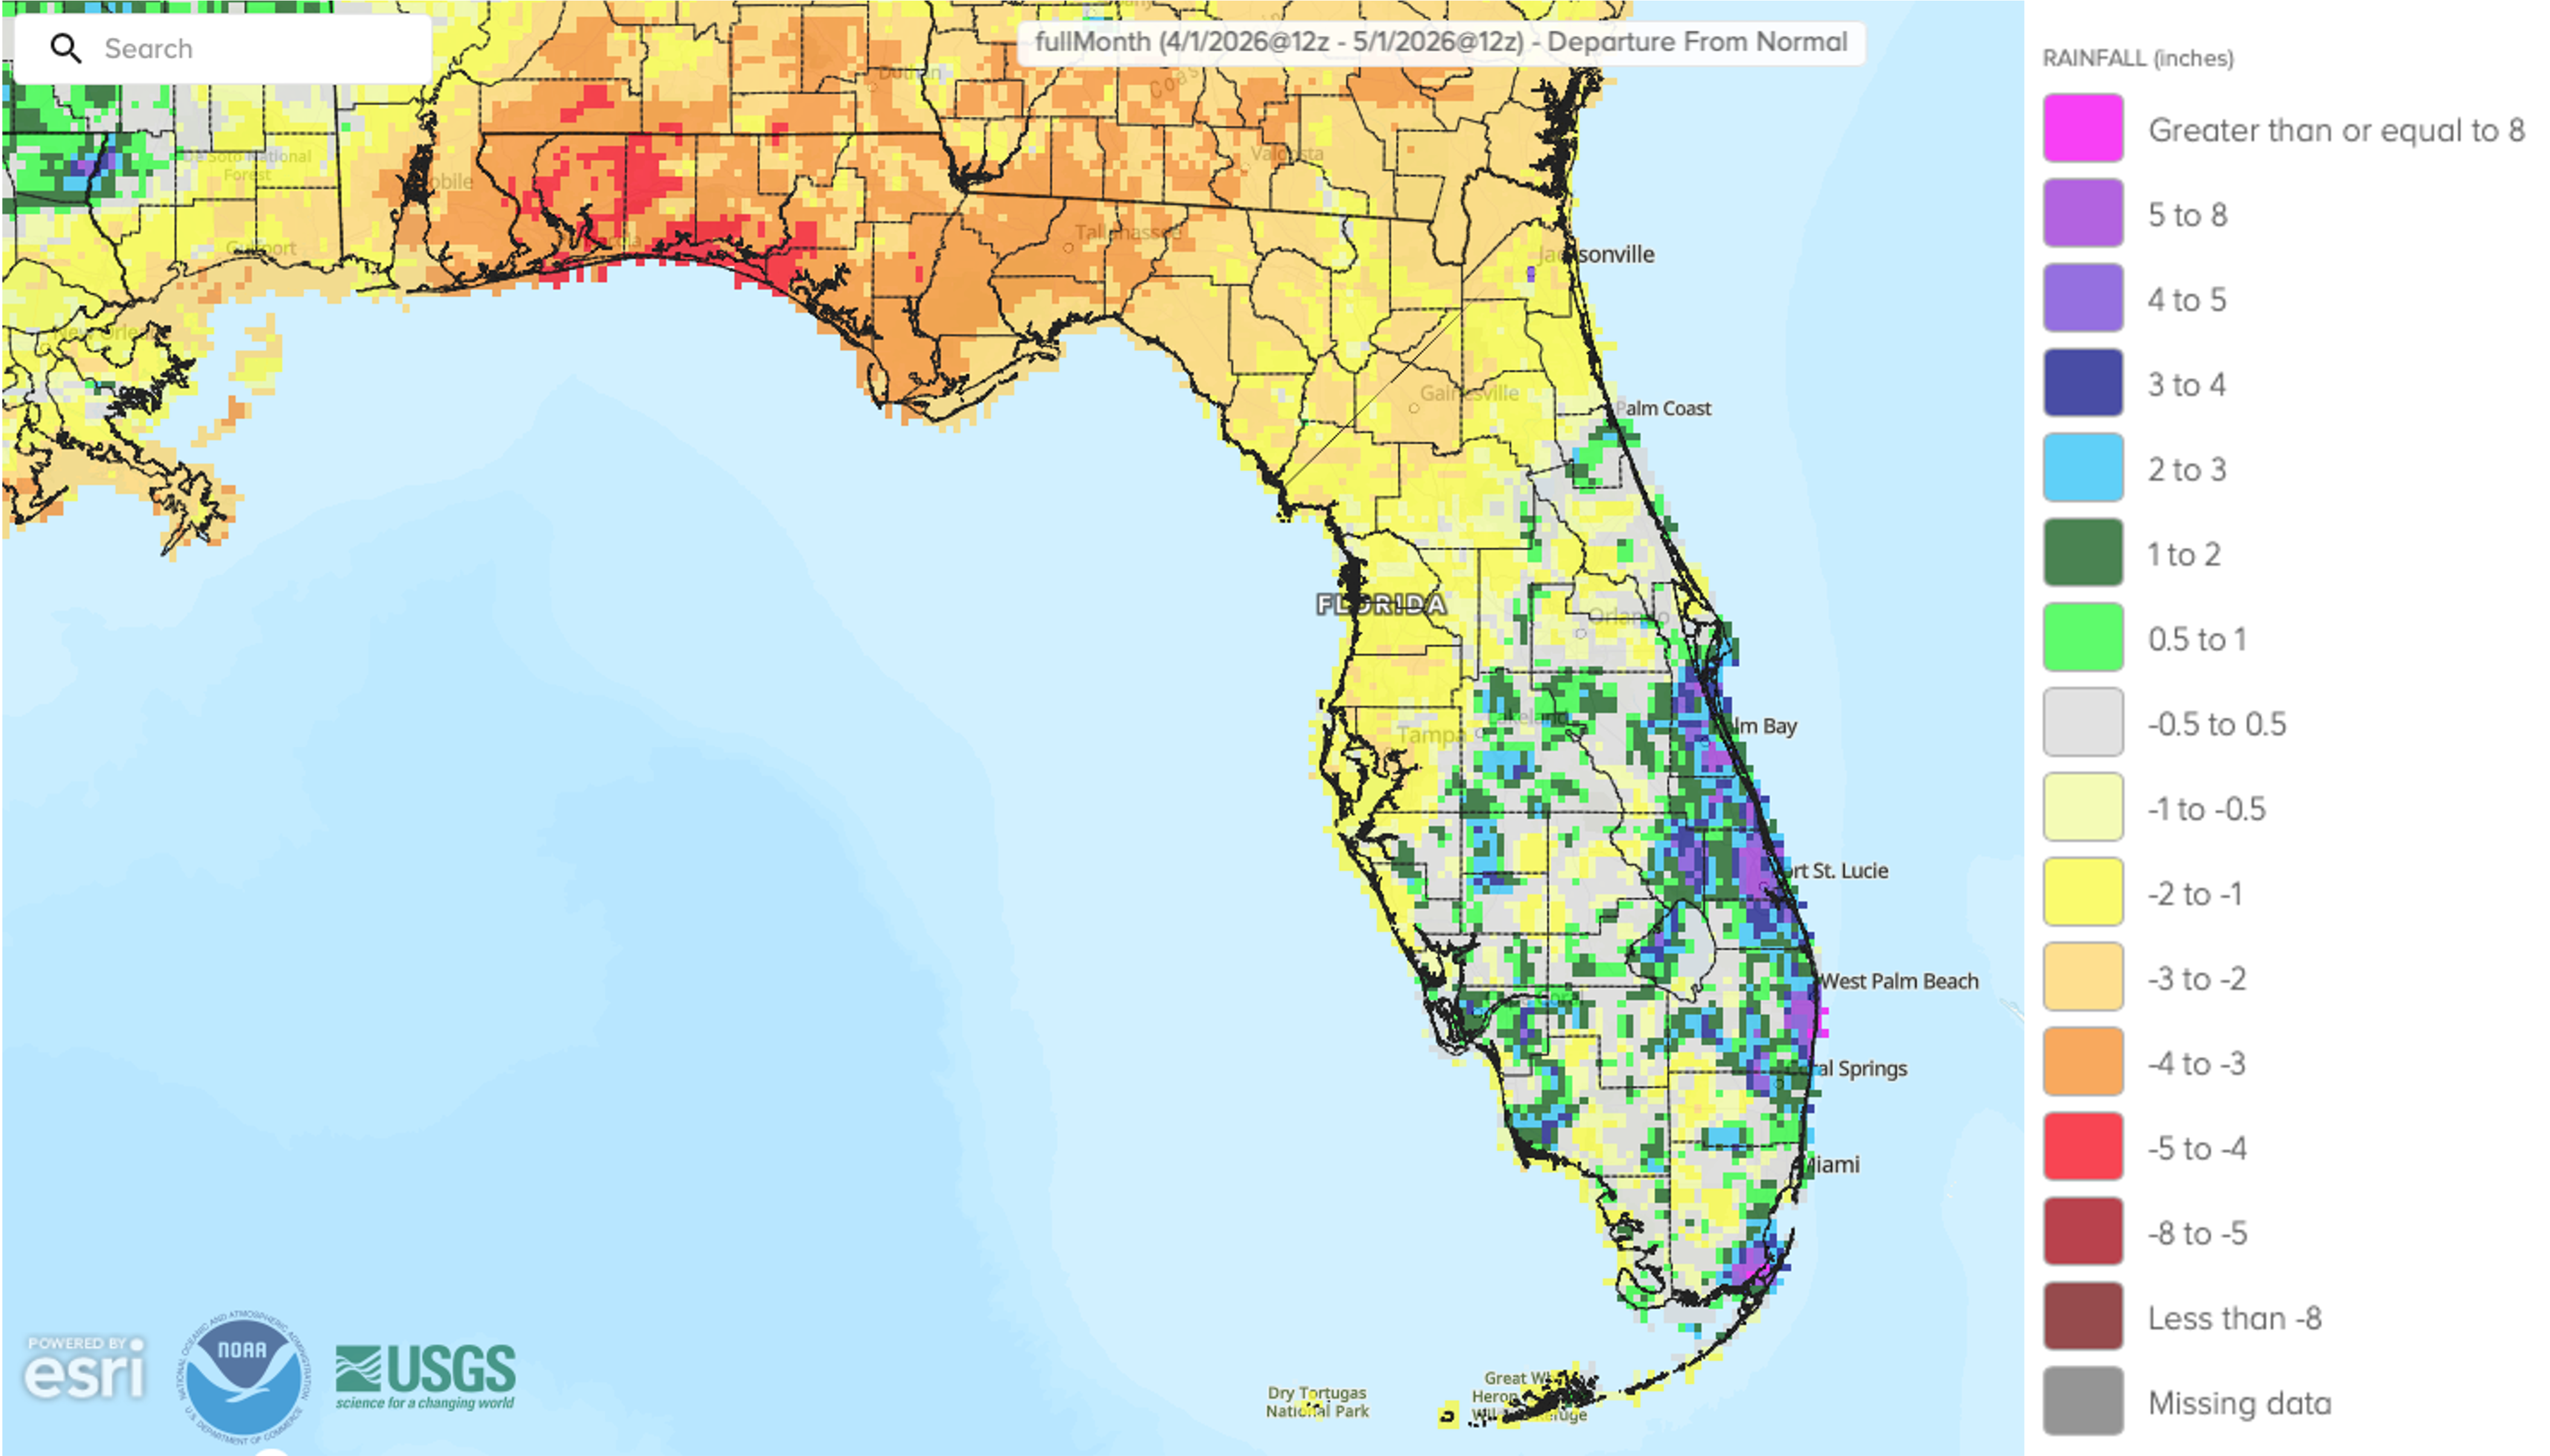
April monthly average temperatures continued above normal. Average monthly temperature departures from normal ranged from +0.8 ̊F in Miami to +3.2 ̊F in Sarasota. By the end of the month, most stations across the state were experiencing one of their top 10 warmest springs on record to date.
May monthly average temperatures were above normal in the Peninsula and near to below normal in the Panhandle. Average monthly temperature departures from normal ranged from -1.6 ̊F in Pensacola to +4.8 ̊F in Leesburg. A few places registered their warmest spring (March through May) on record, including Key West (153 years), Sarasota/Bradenton (113 years), and Plant City (122 years).
The figures below are graphical depictions of the monthly rainfall departure from normal (in inches) for March (top), April (middle), and May (bottom) (courtesy of the National Weather Service).
*Click each map below to view a larger image.
| | Recent rains slowly improve drought conditions | | Increased rainfall during May has slowly decreased drought severity in many areas of the state where the heaviest rain fell. Widespread 2 to 8 inches of rain fell over the past month. Much of the Panhandle received over 10 inches of rain, which considerably improved soil moisture and streamflows there and led to a one to three category improvement in drought. Parts of southern Florida missed out on the heaviest rain. The map below shows changes in U.S. Drought Monitor class designations over the 4 weeks from May 5 to June 2. Green areas indicate drought improvement, yellow areas denote areas of degradation, and grey areas indicate no change. | | Changes in drought class during the 4 weeks from May 5, 2026 to June 2, 2026, from the U.S. Drought Monitor. | | Recent rains have helped to improve, but not remove, drought in Florida. According to the latest U.S. Drought Monitor map for the week ending June 2, most of the state remains in drought (~98%), with approximately 10% of the state in exceptional drought (D4), 43% in extreme drought (D3), 28% in severe drought (D2), and about 18% in moderate drought (D1). Check out our weekly drought summaries for more information here. | | U.S. Drought Monitor map for Florida for the week ending June 2, 2026. | | A transition to El Niño is expected soon, but uncertainty in peak strength remains | | Over the past month, ENSO-neutral conditions continued in the equatorial Pacific Ocean. Sea surface temperatures (SSTs) and subsurface ocean temperatures have gradually increased. Recently, above-average SSTs have emerged in the far eastern and central equatorial regions of the Pacific and are nearing the threshold used to declare an El Niño. There is a 92% chance that El Niño will emerge during June-August and will persist through the Northern Hemisphere winter 2026-2027. There still remains considerable uncertainty in its peak strength, with a 22%, 30%, and 37% chance for a moderate, strong, and very strong event, respectively, during November through January. | | The 2026 Atlantic hurricane season begins | Last year we enjoyed a welcome reprieve from storms here in the sunshine state, but back-to-back seasons without any storms are rare. Forecasts for this Atlantic hurricane season, which began June 1, call for near to slightly below average activity overall (NOAA's official forecast below). Two main factors are driving this year's outlook: the anticipated development of El Niño in the Pacific and warm sea surface temperatures in the Atlantic, including the Gulf and Caribbean, though they may not be as warm as in previous years. El Niño generally causes increased vertical wind shear and sinking air in the tropical Atlantic, which limit storm formation. On the other hand, warm sea surface temperatures support storm development and intensification. How these and other factors will play out is unknown, but a robust El Niño by peak hurricane season is likely to result in fewer storms overall. But don't be caught off guard. Preparation should happen every year regardless of the outlook! | |
What will El Niño mean for drought and the upcoming winter?
| |
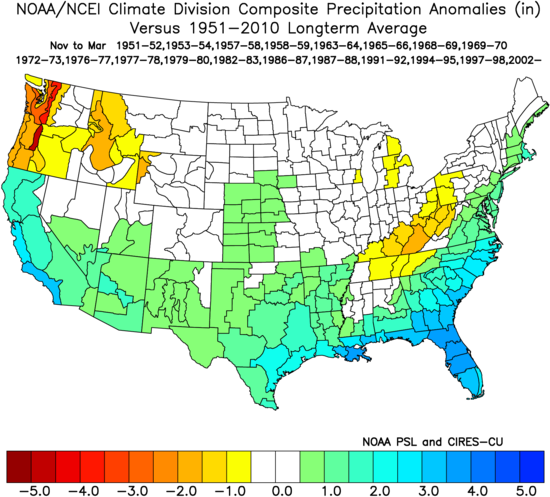
During an El Niño, the subtropical jet stream exerts a stronger influence on our weather in fall and winter, typically bringing more clouds, rain, and even severe weather to the U.S. South. This means wetter weather and more mild temperatures may be in store during fall and winter in Florida. The map below shows November through March precipitation anomalies (in inches) averaged across all El Niño events since 1950 compared to the long-term average for the U.S. Precipitation in Florida is generally 3-4 inches above average during El Niño years.
While El Niño typically suppresses Atlantic tropical cyclone activity, it increases the chance for other types of severe weather in our region. The threat of tornadoes significantly increases in winter and spring and that threat is greatest with strong El Niños. The risk of riverine flooding also increases in Florida.
A strong to very strong El Niño increases the likelihood of experiencing typical El Niño impacts (i.e., greater precipitation), but not necessarily the chance for stronger impacts. Assuming a robust El Niño materializes, increased fall and winter precipitation should further improve any lingering drought conditions. Until then, we will have to rely on typical summer wet season convection and/or a tropical storm or hurricane to deliver enough rainfall for further drought relief over the coming weeks and months.
| | November through March precipitation anomalies for the U.S. by climate division averaged across all El Niño events since 1950, compared to the long-term average (1950-2010). Warm colors (yellow to red) represent below normal precipitation while cool colors (greens to blues) represent above normal precipitation. Note, this map does not represent a forecast of expected conditions this year. (Source: NOAA Physical Sciences Laboratory) | | Summer outlook leaning warmer than normal in Florida with rainfall less certain | |
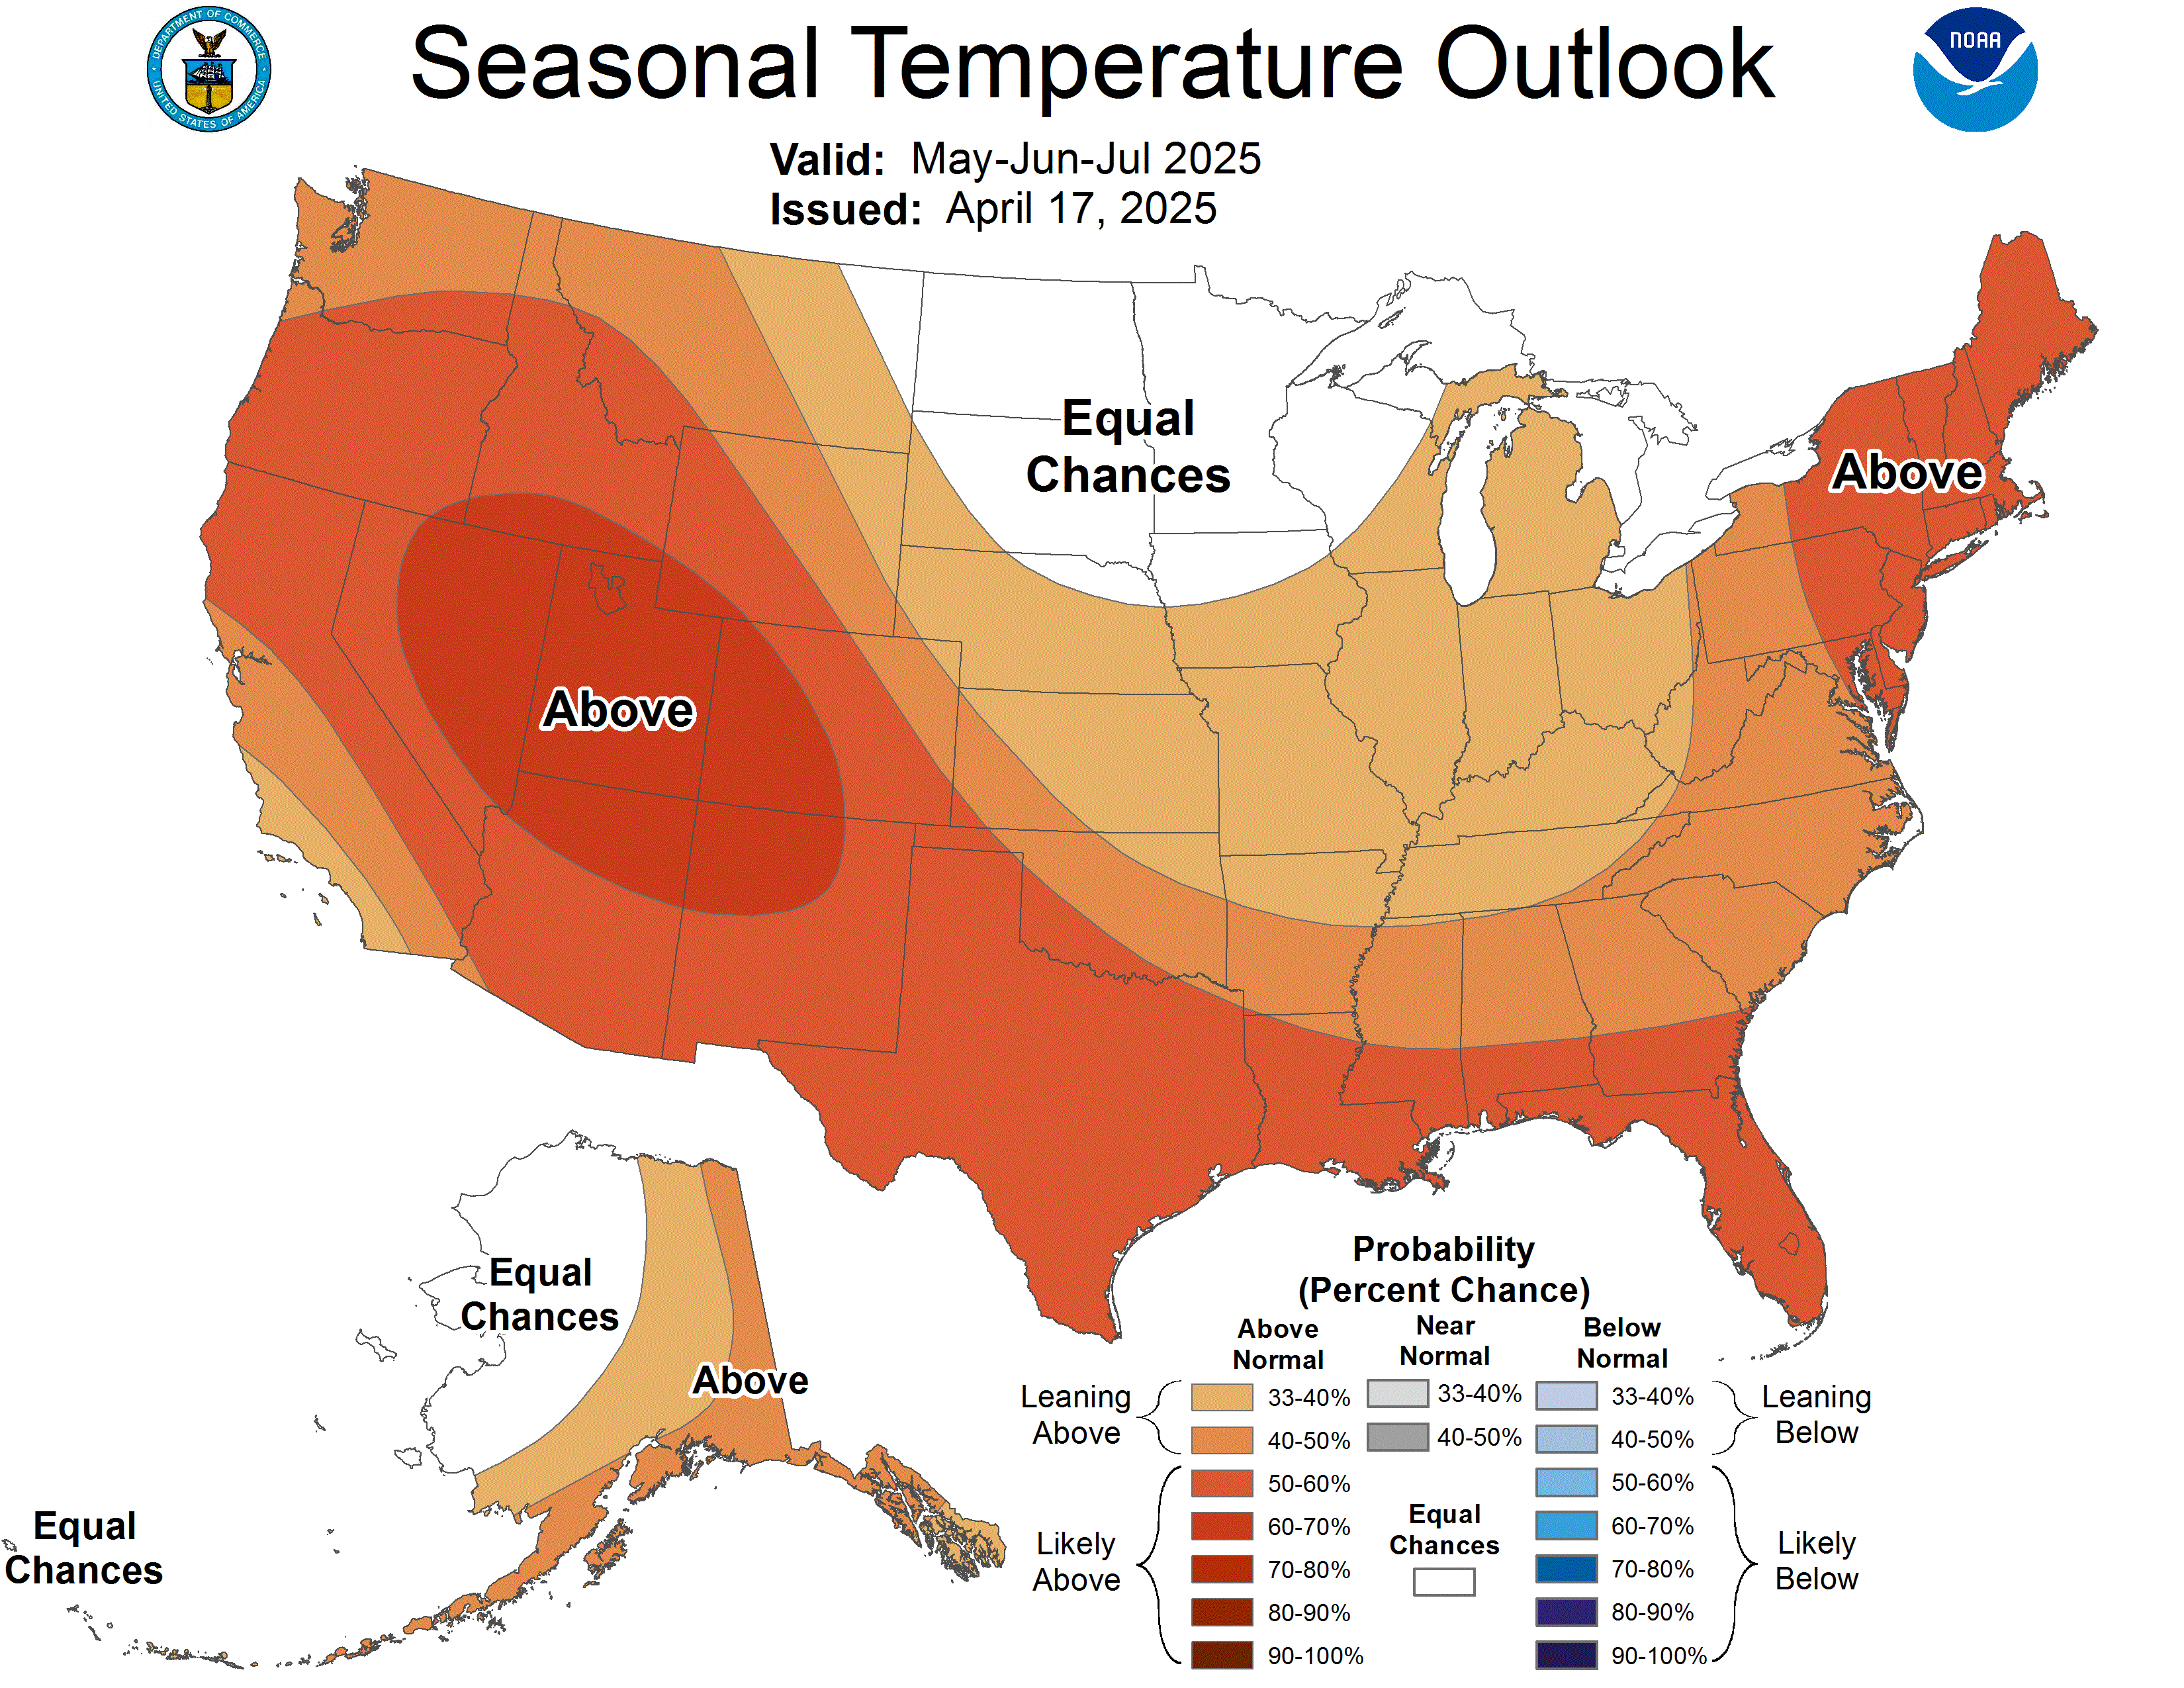
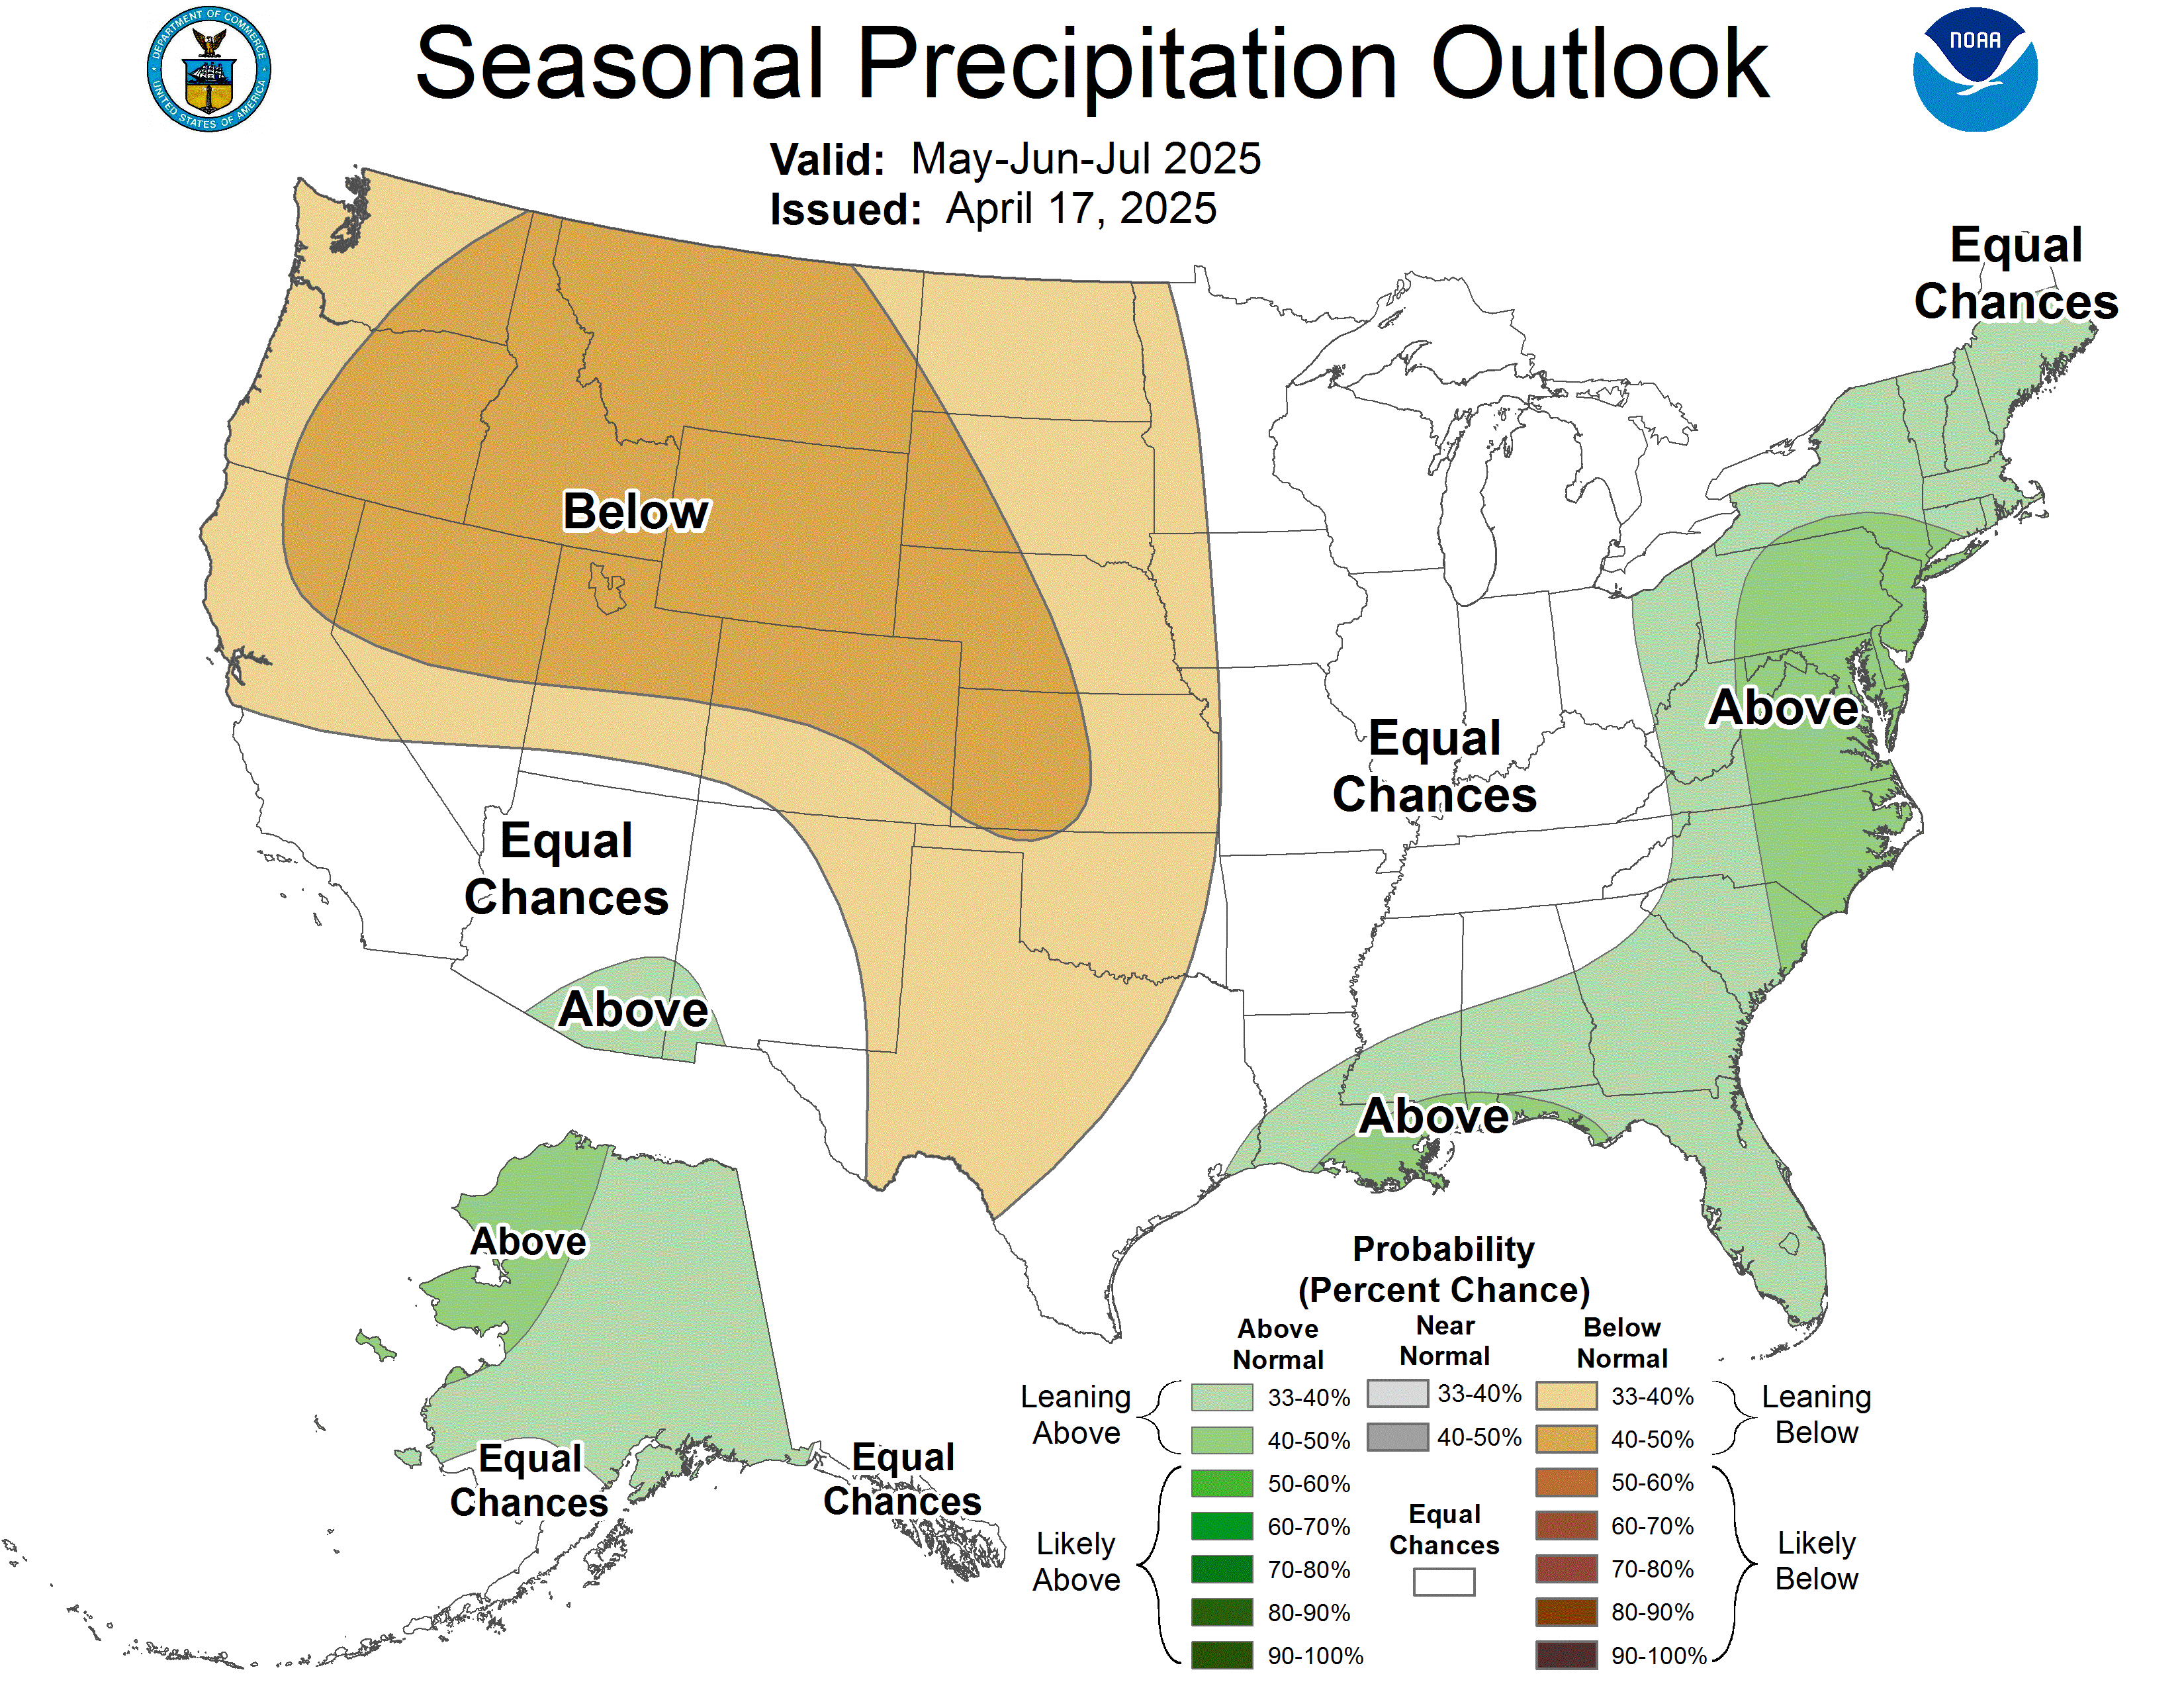
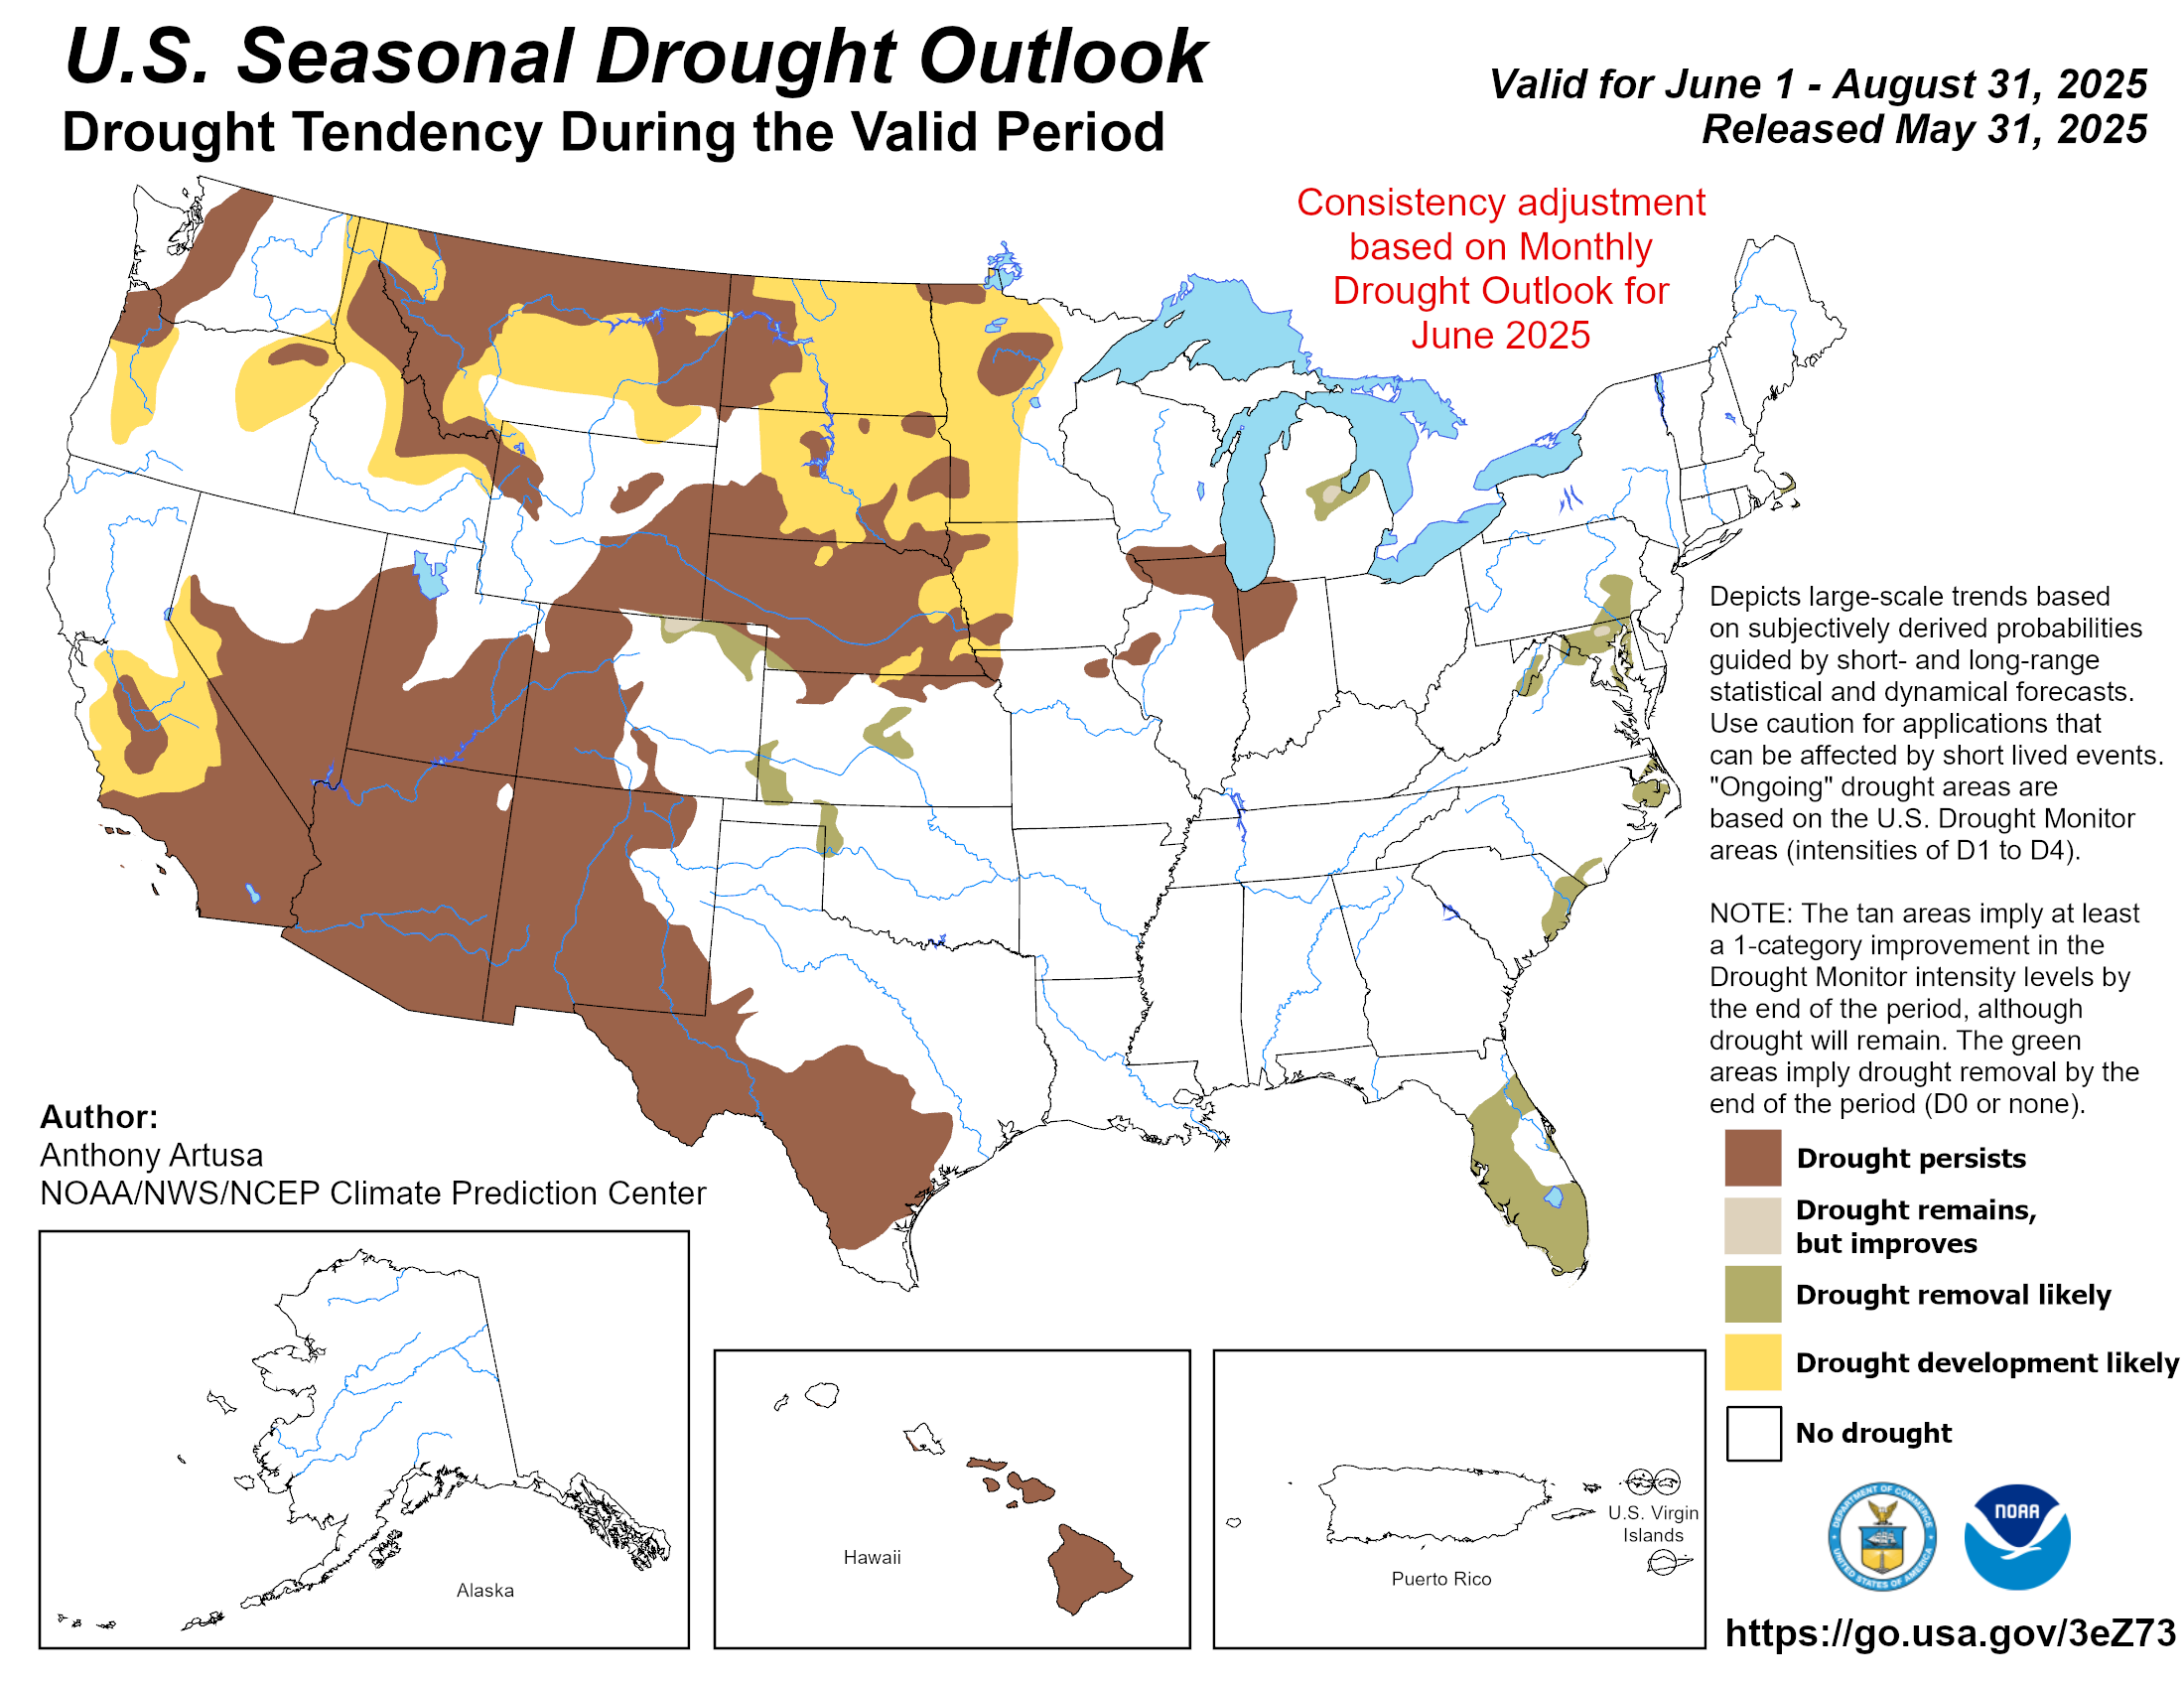
The NOAA Climate Prediction Center's outlook for summer, June through August, favors above normal temperatures across Florida and much of the U.S. There are equal chances for above, below, and near normal precipitation in Florida. Drought removal is expected in parts of the central and southern Peninsula, while drought elsewhere is expected to persist but improve.
*Click each map to view a larger image.
|
| |
Hurricane season will likely deliver fewer storms to National Parks, National Parks Traveler, May 26, 2026
Florida is extremely dry, and active wildfire conditions are ongoing, WFSU, April 30, 2026
More than 60 percent of U.S. is covered by drought as impacts worsen, The Washington Post, April 29, 2026
Drought intensifies in North Florida, raising wildlife concerns, FSView, April 22, 2026
Fast moving Florida wildfire triggers evacuations amid historic drought, The Palm Beach Post, April 14, 2026
Drought sparks concern over wildfires in Florida, PressReader, February 22, 2026
Florida’s worst drought in 25 years sparks wildfire concerns, burn bans, Florida Today, February 17, 2026
| | |
May 19, 2026: Special Southeast Drought Webinar: Conditions, Impacts, Resources, and Outlooks
Sponsored by NOAA and NIDIS, this webinar addressed the evolution of the Southeast U.S. drought, how it compares to previous events, sector-specific impacts across the region, state-level responses, and conditions needed to improve and end the drought. State Climatologist David Zierden provided an update on drought conditions in Florida. A recording of the webinar is available here.
April 30, 2026: Special Florida Drought Warning Webinar
Sponsored by NOAA, NIDIS, and the NWS, this webinar detailed the considerable impacts across the state from the drought this year, from agriculture to hydrology and wildfires. The drought featured local and regional experts from Water Management Districts, NWS offices, and others discussing regional impacts across sectors. Assistant State Climatologist Emily Powell provided an overview of drought development, historical context, and agricultural impacts. A recording of the webinar is available here.
| |
On February 27, State Climatologist David Zierden joined the UF/IFAS Forages team on the "Cow Talks" podcast to unpack one of Florida’s most challenging seasons in decades. Zierden joined soil scientist Cheryl Mackowiak as they discussed the ongoing drought, La Nina, and the winter's prolonged Arctic outbreaks. Watch the episode here.
| |
On February 26, Assistant State Climatologist Emily Powell joined the East Central Florida Regional Planning Council’s Leadership Summit, themed “The Art of What’s Next.”
Powell gave a "By the Numbers" presentation that focused on key weather and climate trends for the 8-county East Central Florida region. She joined local, regional, and national decision makers and stakeholders focused on building resilience across the region.
| | |
June 11-12:
Northwest Florida Resiliency Seminar in Pensacola, FL
June 24-26:
Annual Meeting of the American Association of State Climatologists in Fairbanks, AK
| |
The Florida Climate Center is part of a three-tiered system of national, regional, and state climate offices, including NOAA's National Centers for Environmental Information (NCEI - in Asheville, North Carolina) and the Southeast Regional Climate Center (in Chapel Hill, North Carolina). The Florida State Climatologist and staff at the Florida Climate Center provide the following information and services to the people of Florida:
Climate Data
Historical weather observations for weather stations throughout the state of Florida. We are able to provide data for most stations from 1948-present.
Climate Information
Long-term historical averages for various stations, climate divisions, and the entire state.
Extreme Event Records
Information and analyses on extreme events such as freezes, droughts, floods and hurricanes.
Special Analysis
With their vast knowledge of El Niño, La Niña and climate variability, the State Climatologist and staff can offer expert insight into Florida's climate trends.
Outreach
Activities, presentations, and workshops that inform and educate the people of Florida about current and emerging climate issues. We also coordinate volunteers for the Community Collaborative Rain, Hail & Snow Network (CoCoRaHS).
| | | | |









 (1920 x 1080 px) - Copy.jpg?t=202511191624110)