|
|
For Immediate Release: 2-14-22
Media Contacts
Nadine Slimak, 239.339.7914
|
|
How Bad is the Bloom? New Indexes Developed to Gauge Severity of Red Tides |
|
Bloom Severity Index and Respiratory Irritation Index can help resource managers and the public respond to blooms |
|
Red tides occur near annually on Florida’s west coast and can lead to significant health and economic impacts in the affected communities. But comparing the severity of blooms from year-to-year has been difficult because there has been no standardized way to gauge individual blooms or their impacts.
Until now.
Authors of a new paper recently published in the peer-review journal PLOS One looked at red tides along Florida’s west coast between 1953 and 2019 and used cell counts of the organism that causes red tide in the Gulf of Mexico — Karenia brevis — to develop a Bloom Severity Index. The authors also looked at respiratory irritation reports between 2006 and 2019 and used that information to develop a Respiratory Irritation Index.
These indexes now offer a standardized and objective way to gauge how severe red tides are, which should help decision makers better evaluate the risks of red tides as blooms occur and respond in ways that lessen bloom impacts on public health and local economies.
|
|
“Red tide blooms are described as hitting Southwest Florida nine of every 10 years,” said the study’s lead author Dr. Richard Stumpf, oceanographer with the National Oceanic and Atmospheric Administration’s National Centers for Coastal Ocean Science (NOAA-NCCOS). “But not all blooms are created equal. Some last longer, some cause more respiratory irritation. Others affect a smaller area or produce less irritation. In trying to protect public health and local economies, we found that we really needed a better way to gauge blooms and how much of a threat they pose.
“With these new indices, not only can we look historically at blooms using objective standards, we can also apply the index to current blooms to give the public a better idea of risk — similar to the way that the National Weather Service has developed the Heat Index, the Climate Extreme Index and other indices.”
|
|
In developing the indexes, the study’s authors also found:
- There was a red tide bloom somewhere on the Southwest Florida coast each year between 1994 and 2019, except for 2010.
- 2018 had the most extensive red tide along the Southwest Florida coast. That year, the Respiratory Irritation Index in Manatee and Sarasota counties was also the highest on record.
- More frequent-than-usual offshore winds can suppress the respiratory impact of blooms.
- Wind direction matters for the amount of respiratory irritation. Years with severe blooms — 2006, 2012 and 2018 — caused noticeable respiratory irritation, while other years with blooms (2008, 2009, 2011, 2013, 2014). had almost no respiratory impacts because of more frequent than usual offshore winds.
- Sampling efforts before 1995 aren’t sufficient to allow for the comparison of bloom intensity.
- Blooms most frequently occur between Sanibel Island and Tampa Bay between September and January.
- Red tides typically form in August and continue through the winter, with October and November being the months most frequently impacted.
|
|
“We’re often asked to compare red tide blooms from year-to-year and whether blooms are more frequent or getting worse,” said study co-author Dr. Barbara Kirkpatrick, Senior Advisor with the Gulf of Mexico Coastal Ocean Observing System (GCOOS). “But those are difficult questions to answer because how we monitor for blooms has changed over the decades. And today, we’re gathering information in ways that weren’t possible 50 years ago. So comparing blooms from year to year is problematic. But in developing these indexes, we developed a way to ‘normalize’ the data and create an objective way to compare blooms. So now we can answer those questions.” |
|
Dr. Kate Hubbard, who leads the Harmful Algal Bloom (HAB) Monitoring and Research Program for the Florida Fish and Wildlife Conservation Commission-Fish and Wildlife Research Institute (FWC-FWRI), said that the Bloom Severity Index and Respiratory Irritation Index are important tools for management agencies like hers.
“We know that blooms can discolor water and the toxins produced by red tide can cause fish and wildlife mortalities and accumulate in shellfish,” she said. “Blooms also impact local economies and create public health concerns. Given the potential for respiratory impacts, having severity indexes we can use during and following blooms can help us better direct resources and evaluate potential mechanisms leading to variability over time.”
|
|
Southwest Florida (25.4°-28.4°N, 82.5°-83°N) is shown in relation to the rest of Florida (Inset lower left, red box). Dark gray shaded polygon containing red marks for cell count sample locations, shows the 5 km (3 mile) extent containing Karenia brevis cell counts from 1953 to 2019 used in this study. The white star in Sarasota County indicates the location for the CMAN (meteorological) station VENF1 at Venice Pier. Blue-filled squares mark the eight beach sites in Manatee and Sarasota Counties where respiratory irritation impact was monitored by the BCRS (Beach Conditions Reporting System, Mote Marine Lab).
|
|
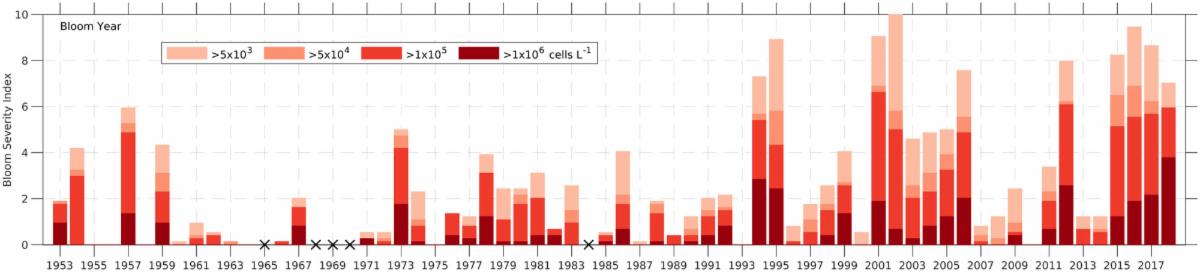
Bloom Severity Index for Each Bloom Year |
|
The annual severity index is determined for the bloom year defined as August to the following July and uses the data accumulated from Fig 2B. The annual bloom index was normalized by the largest bloom year so it fell into the scale of 0–10 (0 indicates no bloom; 10 is the largest bloom). Black Xs on the X-axis show bloom years with no available samples. (For 25.4° to 28.4° N) |
|
While most species of algae are harmless to humans and animals, some — like the Karenia brevis organism that causes red tides in the Gulf of Mexico — are toxic. When these species multiply, creating harmful algal blooms (HABs), they can wreak havoc on human and marine animal health, contaminate seafood and devastate local economies.
Red tides are especially harmful to asthmatics and people with other chronic respiratory diseases, and these groups are more likely to need emergency medical attention during blooms. One Sarasota-based study estimated that the cost for these increased ER visits ranged from $500,000 to $4 million, depending on a bloom’s severity and duration.
Scientists and health experts have developed tools designed to better protect the public from the health impacts of toxic blooms, including triggers for the closure of shellfish beds, bloom forecasts that predict red tide impacts on coastal communities, the Beach Conditions Reporting System that alerts the public when red tide is impacting beaches and, most recently a Red Tide Respiratory Forecast. The Bloom Severity and Respiratory Irritation are the latest tools developed to help mitigate the impacts of red tides.
|
|
Richard P. Stumpf, National Oceanic and Atmospheric Administration’s National Centers for Coastal Ocean Science (NOAA-NCCOS) | Barbara Kirkpatrick, Gulf of Mexico Coastal Ocean Observing System (GCOOS) and Texas A&M University (TAMU) | R. Wayne Litaker, CSS Inc./NOAA-NCCOS | Katherine A. Hubbard, Florida Fish and Wildlife Conservation Commission-Fish and Wildlife Research Institute (FWC-FWRI) | Robert D. Currier, GCOOS/TAMU | Katherine Kohler Harrison, GCOOS/TAMU | Michelle C. Tomlinson, NOAA-NCCOS
|
|
Stumpf, R.P., Yizhen, L., Kirkpatrick, B., Litaker, R.W., Hubbard, K.A., Currier, R.D., Harrison, K.K., and Tomlinson, M.C. 2022. Quantifying Karenia brevis bloom severity and respiratory irritation impact along the shoreline of Southwest Florida. PLOS ONE, 17(1): e0260755. doi.org/10.1371/journal.pone.0260755
|
|
|
|
|
|
|