Greetings!


2025 delivered the lowest annual Metro Vancouver sales total in more than two decades and January 2026 market stats continue that trend.


The total home supply in Metro Vancouver in 2025 is up 9.9% over January 2025 and that is 38% above the 10 year seasonal average while sales were down 28.7% from January 2025 and that is down 30.9% below the 10 year seasonal average.


These Metro Vancouver stats get a lot of press and are distinct from the west side market stats but we are facing similar trends here on the west side.


Westside home sales, when compared to the 10-year averages, are down by 28% for detached homes, down 39% for apartments and up by 22% for townhomes.


Compared to the 10-year average, supply is up 8% for Westside detached homes, while apartment supply is up 22%, and townhomes are up 65%.


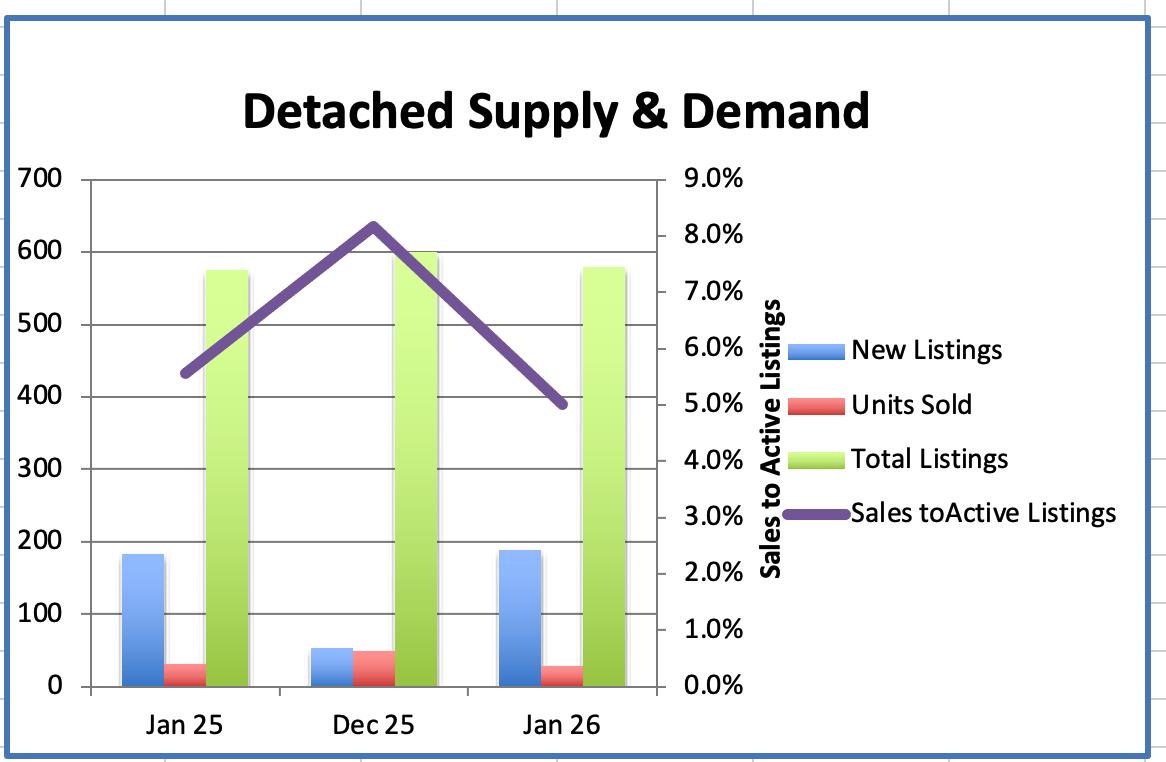
We had 29 Westside Detached home sales in January, down 39%, compared to 49 sales last month.

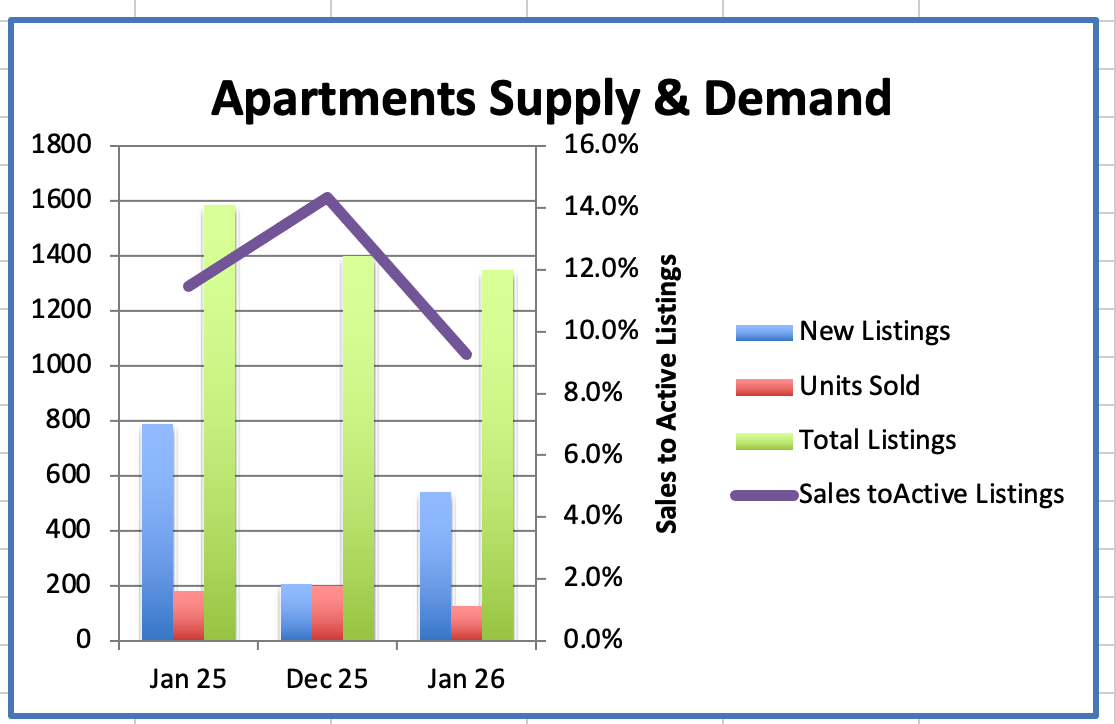
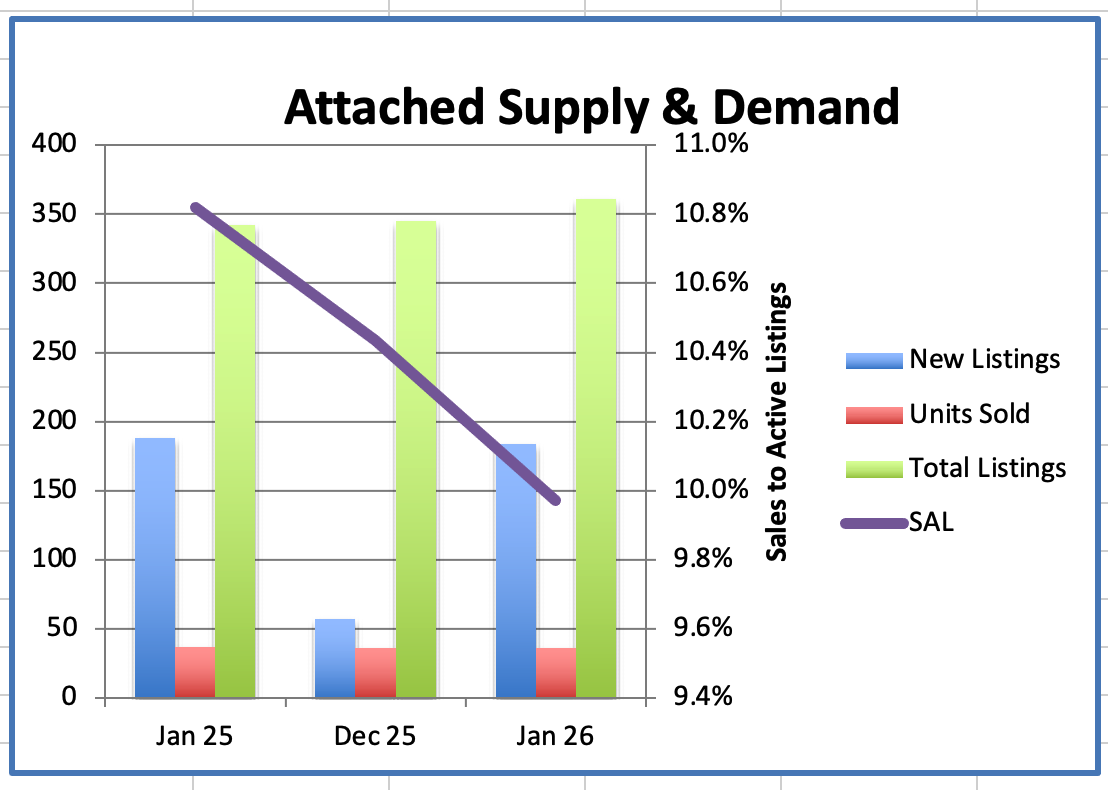
We had 125 Westside Apartment sales in January, down 38% compared to 201 sales last month.

We had 36 Westside Attached home sales in January, unchanged from December.


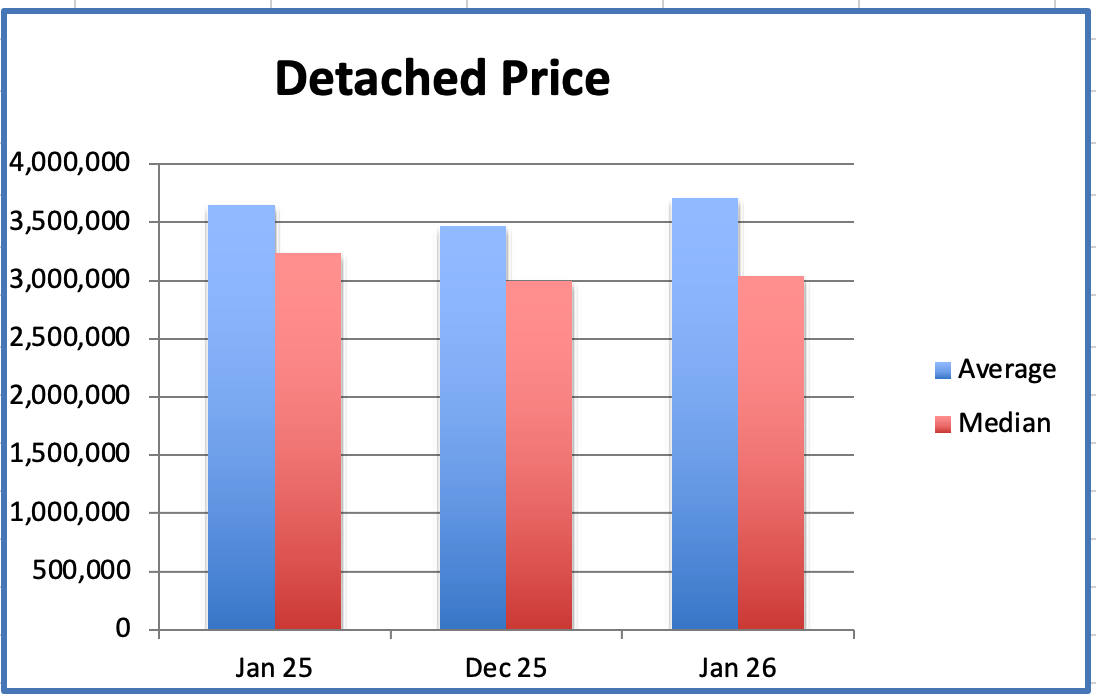
In January the Westside Detached Home average price was $3.709M, down 22% from $4.744M, the peak, in August 2023.

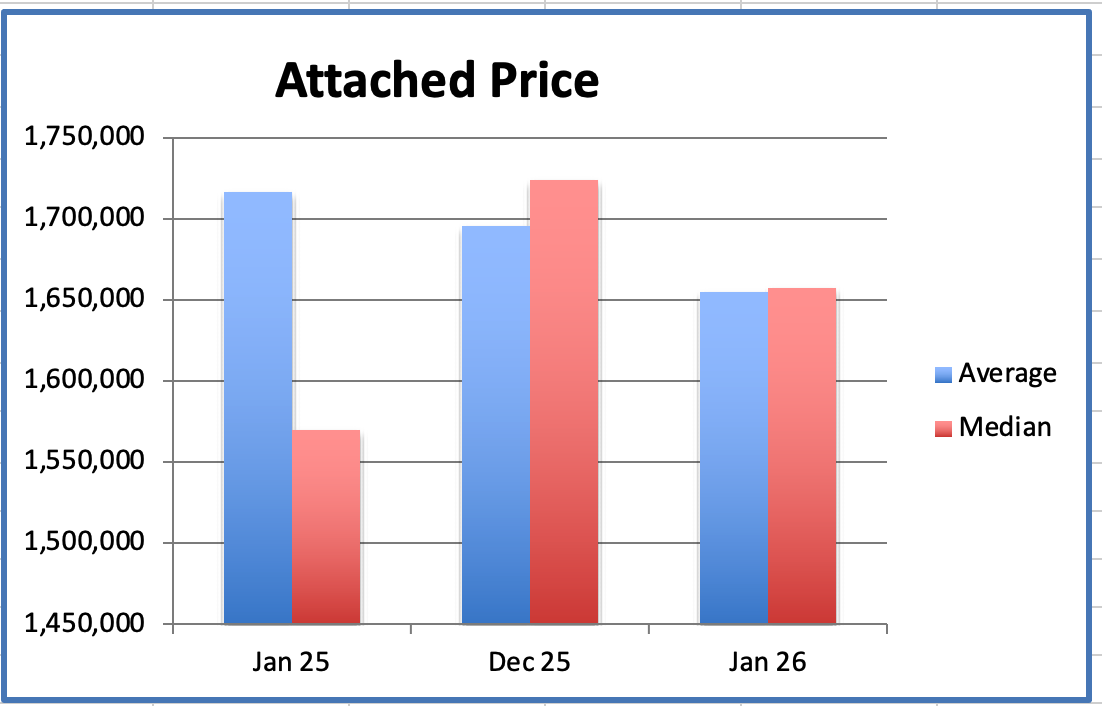
The Attached home average price was $1.655M, down 12% from $1.885M, the peak, in Dec 2024.

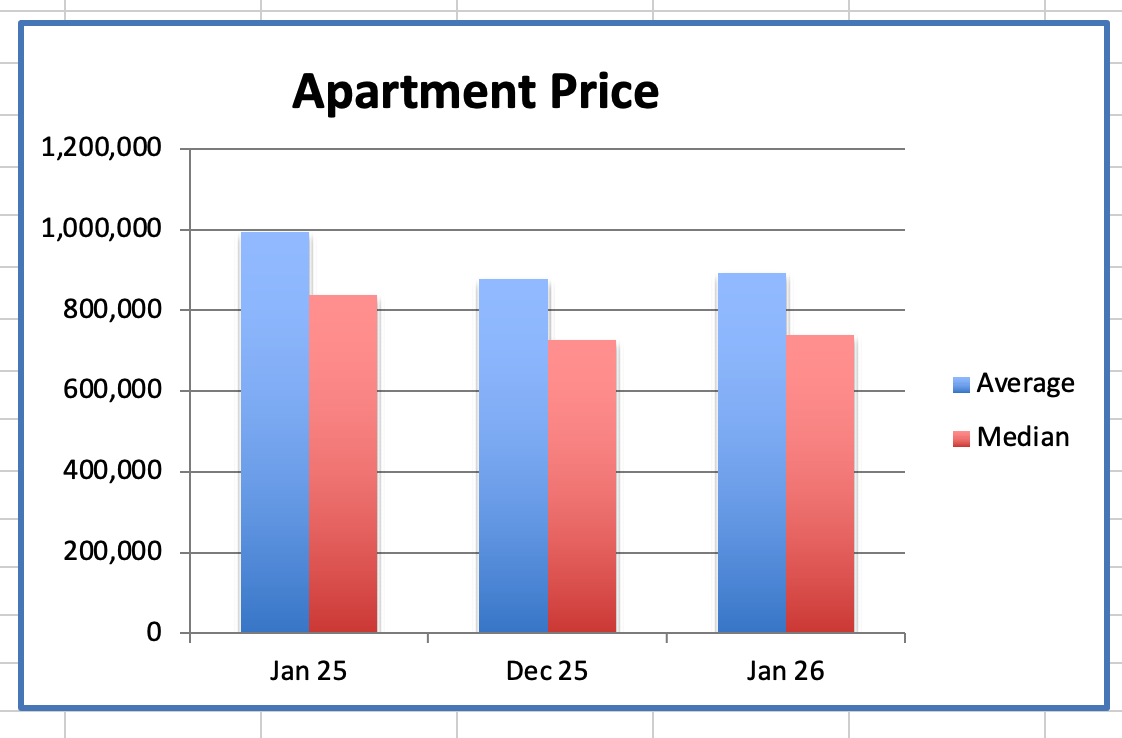
The Apartment average price was $891K, down 26% from $1.199M, the peak, in January 2018.


The Sales to Active Listings ratio (SALR) is a key indicator of market balance and it helps determine whether the market favours Buyers or Sellers. The range between 12% and 20% is considered a balanced market and prices are sustained.


Generally, downward pressure on home prices occurs when the ratio dips below 12% for a period of time. Upward pressure on home prices occurs when the ratio surpasses 20% over several months.


Market conditions are dynamic and can change rapidly due to various economic factors & the ratio can vary significantly depending on the property type.


Currently the SALR for Westside detached homes is 5%, attached is 9.3% and apartments is 14.3%.  


Historically, the market has cycled up in the spring, slowed down in summer, revived a bit in the fall and become quiet in the winter. Currently the seasonal cycle has been disrupted by economic uncertainty, interest rate affordability, job security and global events that have combined to create an ambivalent attitude towards real estate.


Our current Buyers' market and expanding supply have not translated into a rush of activity but rather has reduced urgency as buyers are able to be more discriminating than before. This is making Sellers more aware that they cannot rely on the market to move up continually and they are adjusting their expectations and recognizing that price and value are what is making the sales happen.


Affordability is what buyers need and well priced homes are selling. Sellers getting tired of waiting for prices to rise are starting to grasp the idea that value is what is selling and they are adjusting the asking prices accordingly and even with that, buyers are hesitating. Buyer confidence is still lacking and relates to events beyond real estate into global headlines, consumer tariffs and other issues which affect market momentum.


This too may all be a cycle but it is not the seasonal cycle we are used to.


This is a buyers' market and a good opportunity to get into the market or to move up in the market. We expect the market to remain slow but we know that can change in an instant.


Sellers need to be the best value in their cohort to attract a buyer so strategic pricing is the key to achieving a sale.


Thinking of Selling? Let’s Talk!


πŸ“ž Call me today to discuss your options and make the most of the upcoming selling season.


The 2026 Olympic Winter Games start February 6th. Go TEAM πŸ‡¨πŸ‡¦


Best regards


Stuart β›³ 🎾

Detailed information on the Westside detached homes market in January. Here's a summary of the key points:


  • Supply:
  • In January, the supply of Westside detached homes decreased 3.5% compared to December, with a total of 579 homes available, down from 600.
  • This is relatively unchanged compared to January 2024 when there were 576 homes on the market.
  • Demand:
  • Sales of Westside detached homes in January were down 41% from December, with 29 homes sold.
  • Sales were down 9.4% compared to January 2024, which had 32 sales.
  • The number of sales remains 28% lower than the ten-year average of 40 sales.
  • Sales to Active Listings Ratio (SAL):
  • The SAL in January decreased by 39% from the previous month, with a current SAL of 5% compared to 8.2% in December.
  • The SAL is 9.8% from January 2024.
  • An SAL between 12% to 20% is typically considered a balanced market, where prices tend to remain relatively stable.
  • Pricing:
  • The average detached home price in January decreased 22% and median decreased 283% from August 2023's peak.
  • The average price is $3.709 million, and the median price is $3.04 million.
  • Current prices are up 7% on average and 2% on median from last month.
  • High and Low Sale Prices:
  • Westside detached home sales in January ranged from a low of $1.9million to a high of $9.25 million. The most expensive property took 11 days to sell, while the least expensive took 573 days!
  • Of the 29 homes sold, only 3 sold at or above their asking price, indicating a buyer's market.


These statistics provide a comprehensive overview of the Westside detached homes market in January shedding light on changes in supply, demand, pricing, and notable sale prices.

Detailed information on the Westside apartment market in January. Here's a summary of the key points:

  • Supply:
  • In January, the supply of Westside apartments was down 4% compared to December, with a total of 1,350 apartments available for sale.
  • This number is down by 15% from January 2024.
  • Demand:
  • Demand for Westside apartments decreased by 38% in January with 125 sales compared to 201 sales in December.
  • The number of sales in January was down 31% from the same month last year, which had 182 sales.
  • Apartment sales are down 39% from the ten-year average of 206 sales.
  • Sales to Active Listings (SAL):
  • The SAL in January decreased by 35% compared to December, to 9.3%.
  • This is a decrease of 31% from the SAL of 11% in January 2024.
  • An SAL between 12% to 20% is typically considered a balanced market, where prices tend to remain relatively stable.
  • Prices:
  • The average price of Westside apartments in January increased 2% from December, with the average price at $891K
  • It was down 10% from January 2024.
  • The median price was up 2% at $740K and is down 12% from January 2024.
  • Average prices are down 26% below the peak of $1,199,000 in January 2018, and median prices are 17% below the peak of June 2024.

These statistics provide a comprehensive picture of the Westside apartment market in January, highlighting changes in supply, demand, pricing, and their respective trends over time.

Detailed information on the Westside townhouse market in January. Here's a summary of the key points:

  • Supply:
  • In January, the supply of Westside townhouses increased 5% compared to December, with a total of 361 townhouses available for sale.
  • The supply was up 6% from January 2024, which had 342 townhouses on the market.
  • Demand:
  • The demand for townhouses in January remained unchanged from last month with 36 sales.
  • The number of sales in January decreased by 3% from the same month last year, which had 37 sales.
  • Attached home sales are 22% above the ten-year average of 30 sales.
  • Sales to Active Listings (SAL):
  • With a increase in supply and no change in demand since last month, the current SAL for townhouses decreased by 4%, to 10%
  • This is 8% lower than the SAL of 11% in January 2024.
  • An SAL between 12% to 20% is typically considered a balanced market, where prices tend to remain relatively stable.
  • Prices:
  • The average price of townhouses in January was $1.654 million, down 2.4% from December.
  • It was down 4% from January 2024 when the average price was $1.716 million.
  • The median price in January was $1.657million, a 4% decrease from December ($1.57 million), and up 6% from January 2024.
  • Average prices for townhouses are down 12% from its peak. Median prices down 11% from its peak. The average peak of $1.885 million in Dec 2024, and the median peak of $1.855 million in Dec 2024.


These statistics provide a comprehensive overview of the Westside townhouse market in January, indicating changes in supply, demand, pricing, and their respective trends over time.

Facebook  Twitter  Linkedin