Weekly Indian River Lagoon

Harmful Algal Bloom Observations in

Brevard County Using Remote Sensing

Report Date - January 1st to January 7th, 2024

Prepared By: Summer Manestar & Andrew Kamerosky

Summary of Harmful Algal Bloom (HAB) Activity

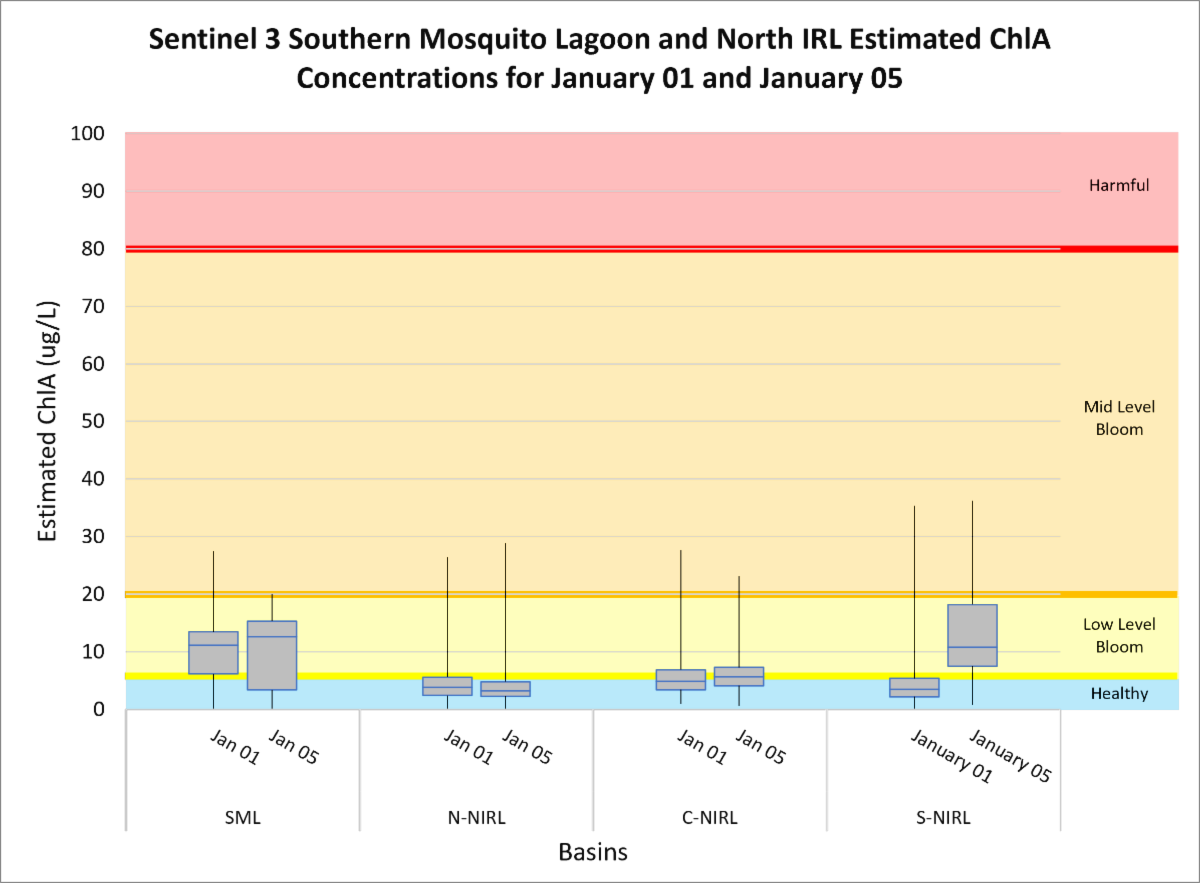
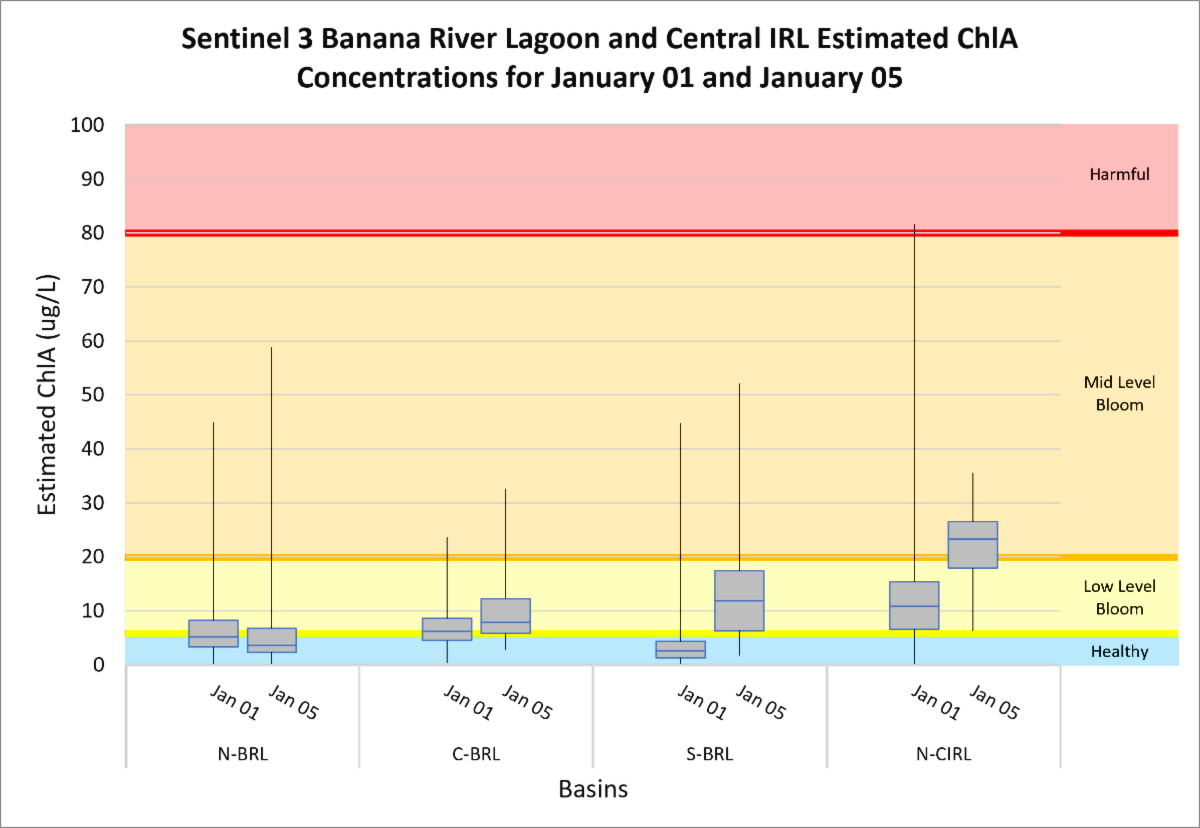
For the week of January 1st, 2024, the change in estimated median Chlorophyll A (ChlA) varied across most of the Indian River Lagoon (IRL). Imagery from January 1st was compared against January 5th (Table 1).


The Northern-North IRL (N-NIRL), Northern Banana River Lagoon (N-BRL), and Central-North IRL (C-NIRL) ended the week below the 6 µg/L threshold for healthy levels of ChlA. The Southern Mosquito Lagoon (SML), Central Banana River Lagoon (C-BRL), Southern Banana River Lagoon (S-BRL), and Southern-North IRL (S-NIRL) had median ChlA concentrations in the low-level bloom range between 6 to 20 µg/L. The North-Central IRL (N-CIRL) was observed to have the largest increase in ChlA from 10.8 to 23.2 µg/L on January 5th, ending the week in the mid-level bloom range between 20 to 80 µg/L.


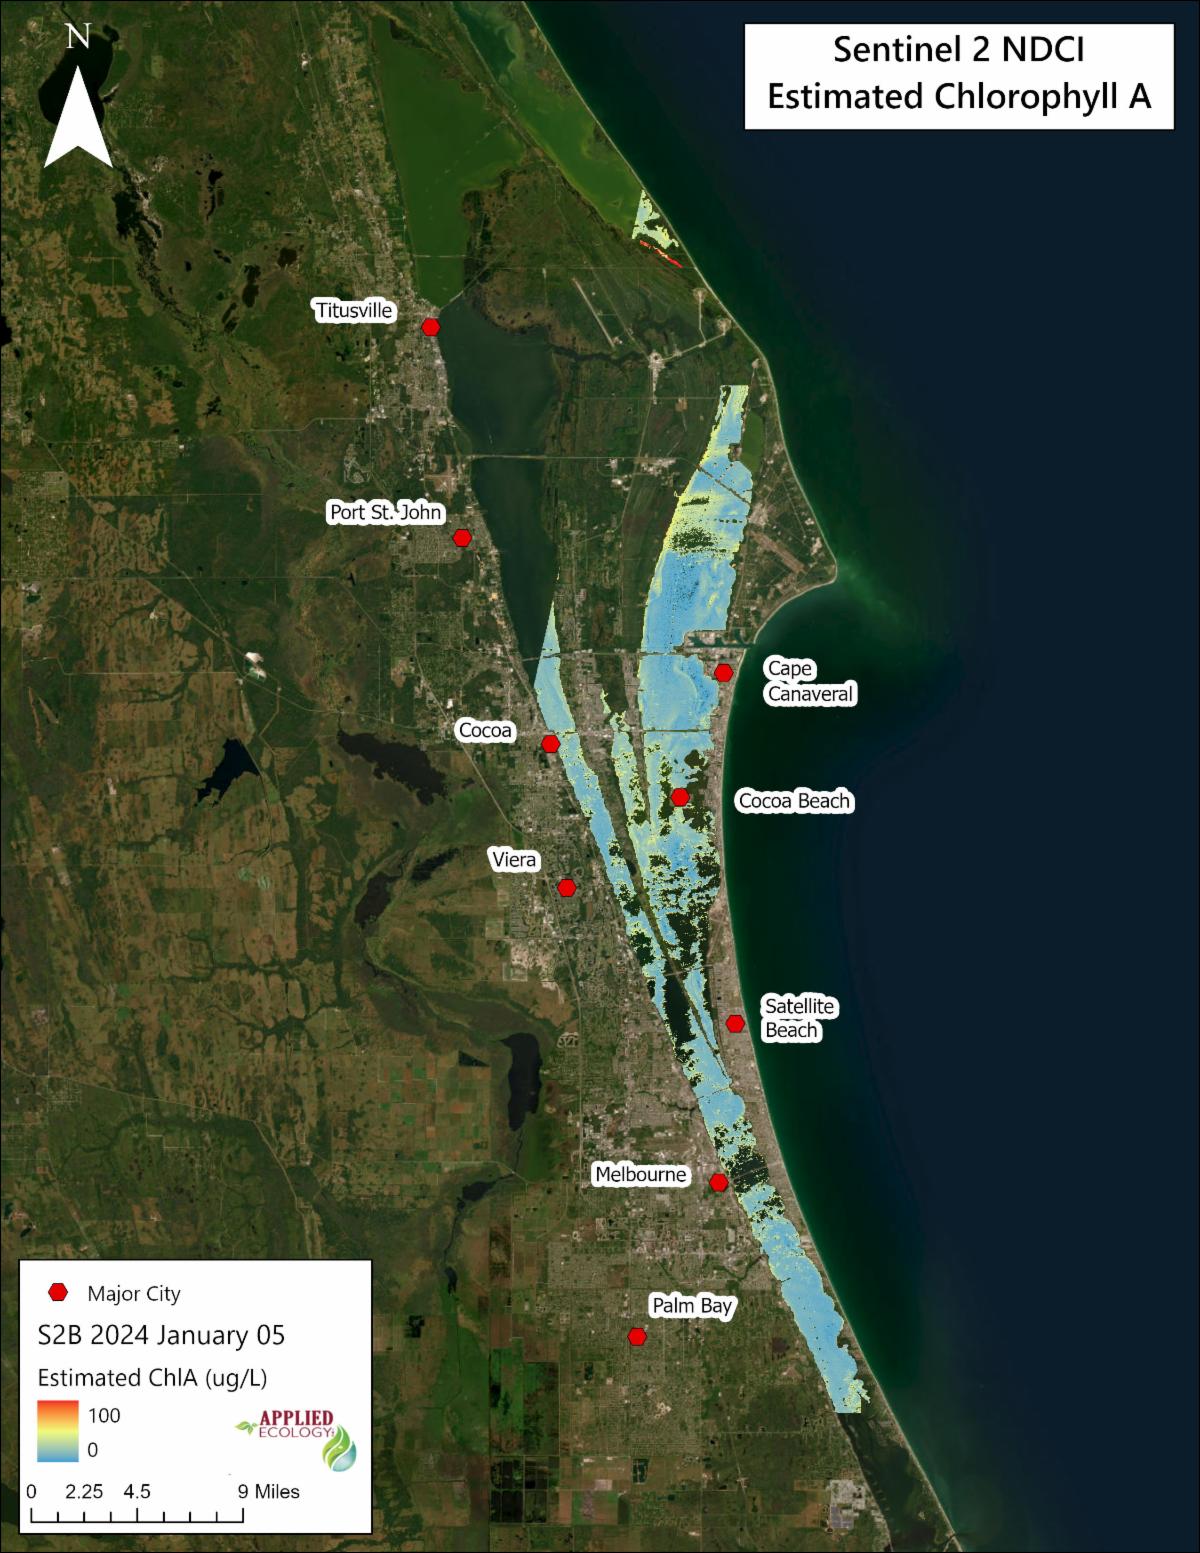
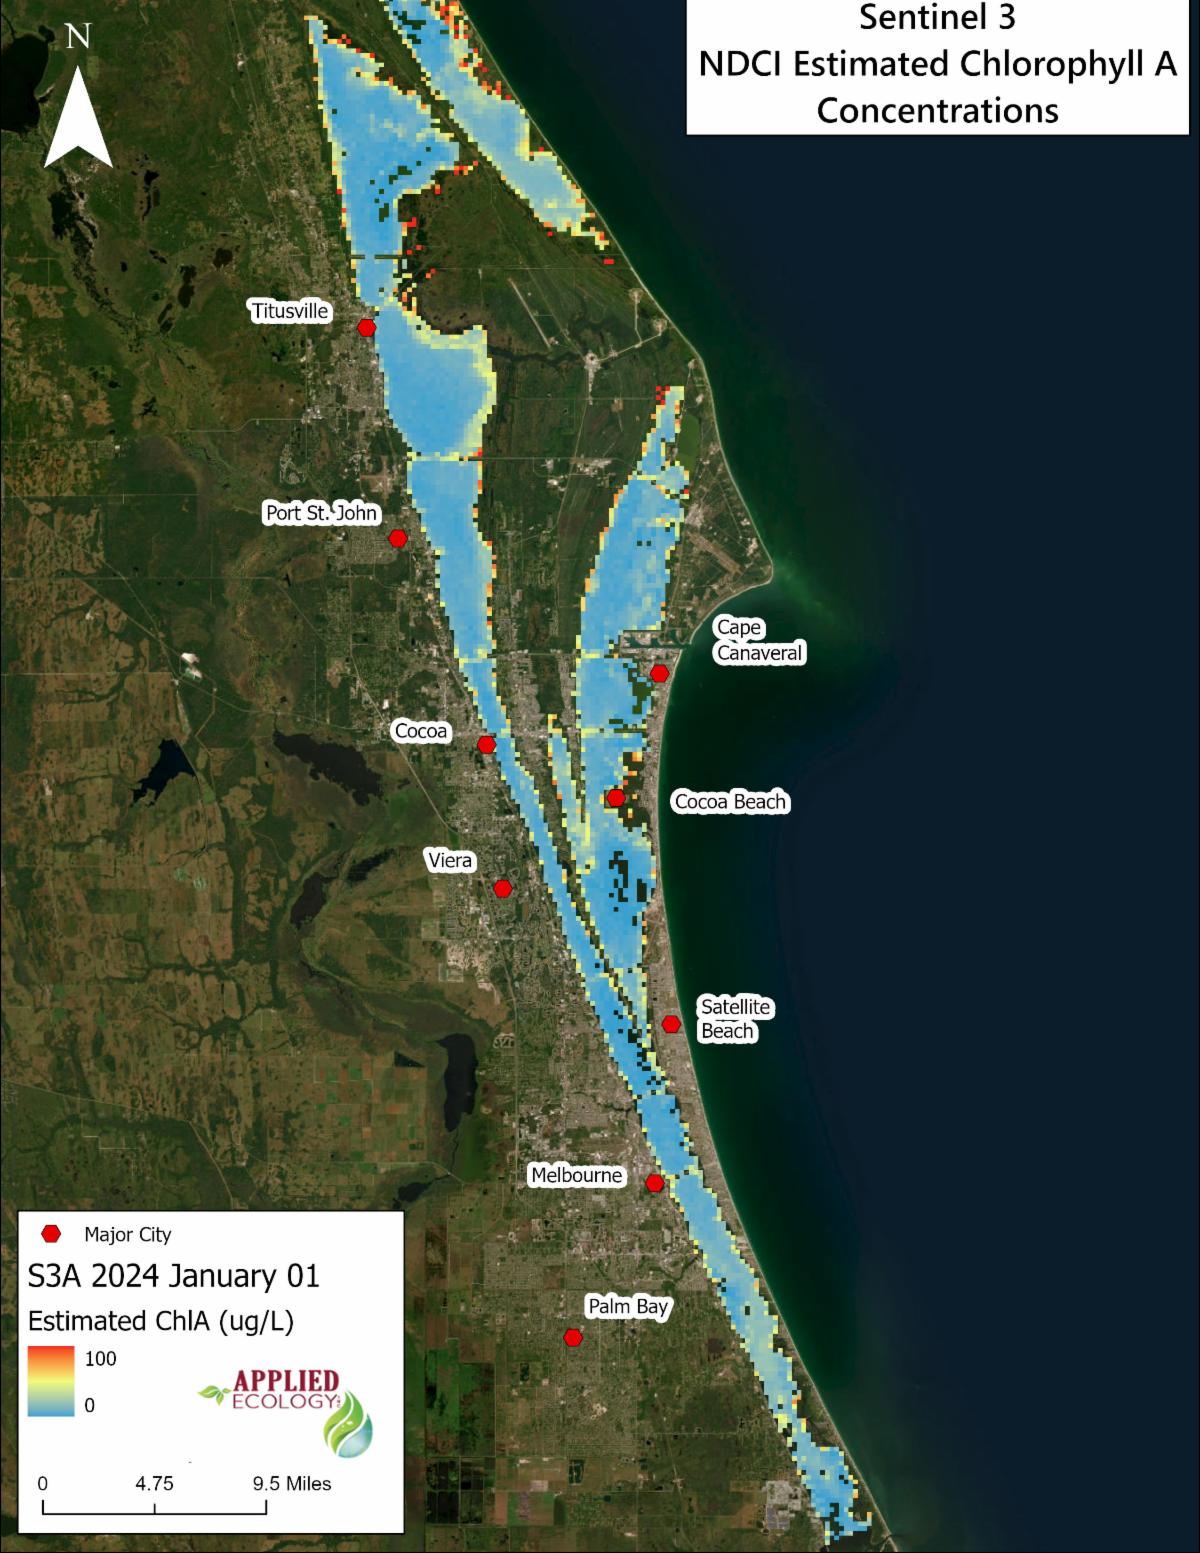
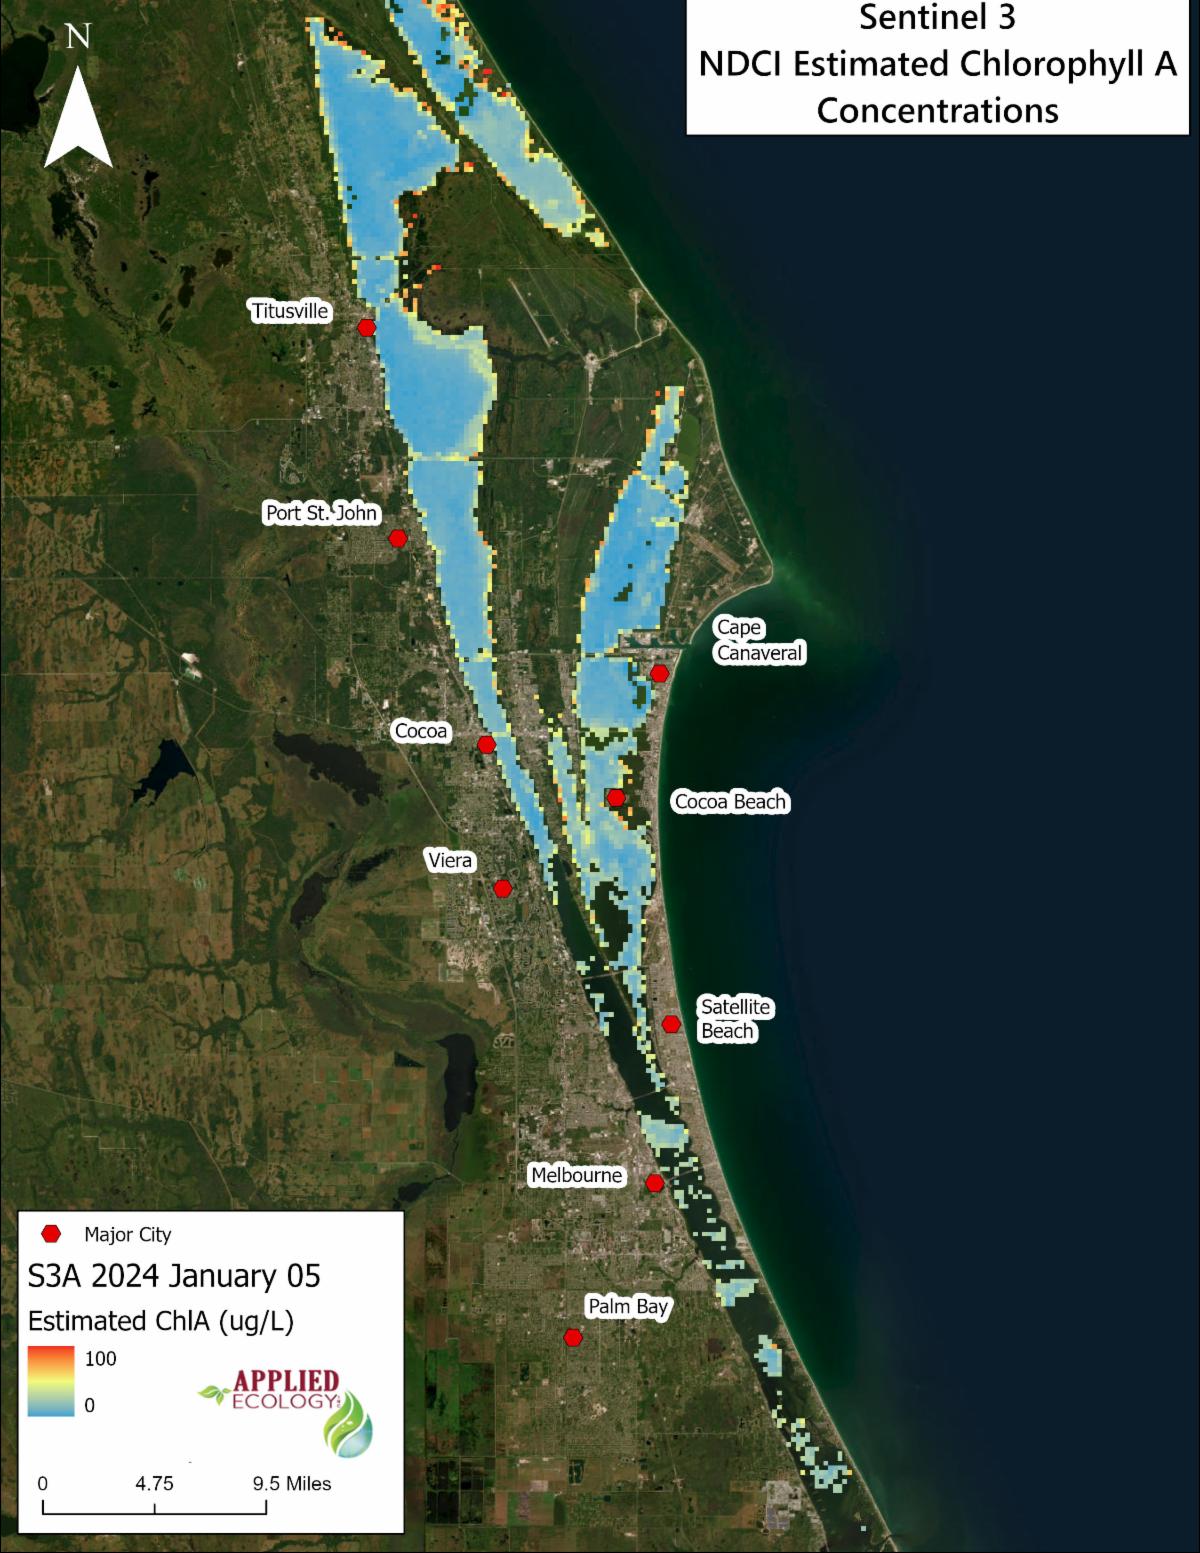
There was one (1) usable Sentinel-2 scene and two (2) usable Sentinel-3 scenes during this period.

European Space Agency Sentinel Satellite Estimated Chlorophyll A

Sentinel 2

There was one (1) partial scene from Sentinel-2 that was usable for detection of bloom activity the week of January 1st (Figure 1). Of note in this scene is the presence of medium bloom activity in the SML and N-BRL.

Figure 1 - Processed Sentinel-2 imagery for January 5, 2024

Sentinel 3

There were two (2) scenes from Sentinel 3 that were usable for detection of bloom activity the week of January 1st (Figure 2, Figure 3). The following analysis focuses on scenes from January 1st to 5th (Figure 4, Figure 5). 

Figure 2 - Processed Sentinel-3 imagery for January 1, 2024

Figure 3 - Processed Sentinel-3 imagery for January 5, 2024

Figure 4 - Sentinel 3 estimated Chlorophyll A (ChlA) Levels in Micrograms/Liter (µg/L) for January 1st and 5th, 2024, over sections of the Southern Mosquito Lagoon (SML) and North Indian River Lagoon (NIRL). The box plots represent the range of estimated ChlA values for each Basin, with the boxes showing the second quartile, median, and third quartile, and the whiskers representing the first and fourth quartiles.

Figure 5 - Sentinel 3 estimated Chlorophyll A (ChlA) Levels in Micrograms/Liter (µg/L) for January 1st and 5th, 2024, over sections of the Banana River Lagoon (BRL) and Central Indian River Lagoon (CIRL). The box plots represent the range of estimated ChlA values for each Basin, with the boxes showing the second quartile, median, and third quartile, and the whiskers representing the first and fourth quartiles.

Table 1 - Sentinel-3 estimated median ChlA in µg/L and percent change between January 1st and 5th, 2024, by IRL Basin.

Basin

January 01 Median ChlA

January 05 Median ChlA

Change in Median ChlA

Percent Change

SML

11.1

12.6

1.5

13%

N-NIRL

3.8

3.2

-0.6

-16%

C-NIRL

4.9

5.6

0.7

15%

N-BRL

5.2

3.5

-1.6

-31%

C-BRL

6.2

7.9

1.7

28%

S-BRL

2.6

11.8

9.3

358%

S-NIRL

3.5

10.8

7.3

210%

N-CIRL

10.8

23.2

12.4

115%

SJRWMD IRL Continuous Monitoring Stations

The St. John River Water Management District (SJRWMD) Continuous Monitoring (CM) stations measured Chlorophyll Reflective Fluorescence Units (RFU). (Figure 6, Table 2). 


Current and historical data are added to the SJRWMD’s database continuously; subsequent visits may reflect such additions or revisions. SJRWMD provides no warranty as to the accuracy, reliability, or completeness of these data.

Figure 6 – St. John River Water Management District (SJRWMD) Indian River Lagoon (IRL) Continuous Monitoring Station Relative Chlorophyll A (ChlA) readings for the week of January 1st, 2024.

Below are the estimated ChlA levels measured by SJRWMD continuous monitoring stations for the week of January 1st, 2024 (Table 2). The Continuous Monitoring Station data is reported hourly by SJRWMD, and this report provides the 95th percentile of RFU for a given day. 

Table 2 – St. John River Water Management District (SJRWMD) Indian River Lagoon (IRL) Continuous Monitoring Station Average Relative Chlorophyll A (ChlA) 95th percentile levels for the week of January 1st, 2024.

Date

IRLML02

IRLTITUS

IRLB04

IRLI13

IRLI21

01-January

ND

5.30

1.47

3.19

3.67

02-January

ND

6.22

1.74

4.03

2.95

03-January

ND

3.81

1.33

3.26

0.46

04-January

ND

2.57

1.55

4.79

1.77

05-January

ND

2.32

1.99

4.26

1.77

06-January

ND

2.09

1.71

4.96

0.38

07-January

ND

2.07

1.48

3.44

3.59

Available Sentinel 2 & 3 Imagery

The availability and usability of satellite imagery is contingent upon both the satellite being overhead and low cloud cover. The orbits of the Sentinel satellites will on occasion cover a portion versus all of the Indian River Lagoon. Likewise, cloud cover can also result in only portions of the Indian River Lagoon (IRL) being visible. Table 3 below lists the availability of Sentinel imagery and its usability for Harmful Algal Bloom (HAB) analysis.

Table 3 - Sentinel 2 and 3 imagery availability for the week of January 1st, 2024.

Date

S2 - A

S2 - B

S3 - A

S3 - B

01 January

N

N

Y - G

N

02 January

N

N

Y - C

N

03 January

Y - C

N

N

Y - C

04 January

N

N

N

Y - C

05 January

N

Y - G

Y - G

N

06 January

N

N

Y - C

N

07 January

N

N

N

Y - C

N - Imagery Not Available

Y - C - Imagery Available, Cannot Use Due to Cloud Cover

Y - P - Imagery Available, Only Partial Imagery of IRL

Y - G - Imagery Available, No Issues Over the IRL

Methods

HAB’s observed by this project are defined as over 80 Micrograms/Liter (µg/L) Chlorophyll A (ChlA) (as estimated by a calibrated Normalized Difference Chlorophyll Index (NDCI)) and persistent across the week in review. The algorithms that transform the NDCI index value to estimated ChlA concentrations were developed using a second-order polynomial equation. The Sentinel 2 (S2) equation has a Root Square (R2) of 0.81 with a Root Mean Square Error (RMSE) of 14.14 ug/L of ChlA. The Sentinel 3 (S3) equation has an R2 of 0.92 and an RMSE of 9.92 ug/L ChlA. The RMSE is a measure of the accuracy of a model in estimating values, ChlA in this instance, where a lower value is indicative of higher accuracy. It does not identify if the model consistently over or underestimates the modeled values. The equations are below:


  • S2 Estimated ChlA = 297.36(NDCI)2 + 313.98(NDCI) + 36.152


  • S3 Estimated ChlA = 437.07(NDCI)2 + 348.98(NDCI) + 33.928

   Figure 7 - SJRWMD Continuous Monitoring stations and IRL Basins used for S2 and S3 analysis. 

Use Our HAB Tool

Want to look at a specific day or compare days over time? Our online HAB Viewer Tool will let you select days and even compare different days using the slider viewer tool.


Algae Bloom Viewer Tool

Want to be in the know about other Save Our Indian River Lagoon Plan projects and progress?

Sign up for our monthly Newsletter Emails


Did you receive this email from someone else and would like to get your own weekly HAB notices?

Sign up for weekly HAB Emails

Visit our Website
Facebook  Instagram  YouTube