Weekly Indian River Lagoon
Harmful Algal Bloom Observations
| |
Report Date - February 27th to March 5th, 2023 | |
|
Project Name: Florida Department of Environmental Protection Grant INVO14: Remote Sensing of Harmful Algal Blooms in the Indian River Lagoon and Connected Waterways in Brevard County
Prepared By: Andrew Kamerosky and Rachel Scime
| |
Summary of Harmful Algal Bloom (HAB) Activity | |
For the week of February 27th, 2023, to March 5th, 2023, there was a general increase in HAB activity from the previous week, with the Southern Mosquito Lagoon and South-North Indian River Lagoon experiencing the largest increases. There were 2 useable Sentinel-2 scenes and 6 Sentinel-3 scenes during this period. | |
Table 1 - Sentinel 3 estimated ChlA percent change for the week of February 27, 2023, to March 5, 2023, by IRL Basin. | |
Available Sentinel 2 & 3 Imagery | |
Table 2 - Sentinel 2 and 3 imagery availability for February 27th-March 5th, 2023 | |
|
N - Imagery Not Available
Y - C - Imagery Available, Cannot Use Due to Cloud Cover
Y - P - Imagery Available, Only Partial Imagery of IRL
Y - G - Imagery Available, No Issues Over the IRL
| |
27 February 2023 - Sentinel 2A | |
27 February 2023 - Sentinel 3A | |
01 March 2023 - Sentinel 2B | |
01 March 2023 - Sentinel 3B | |
02 March 2023 - Sentinel 3A | |
02 March 2023 - Sentinel 3B | |
03 March 2023 - Sentinel 3A | |
05 March 2023 - Sentinel 3B | |
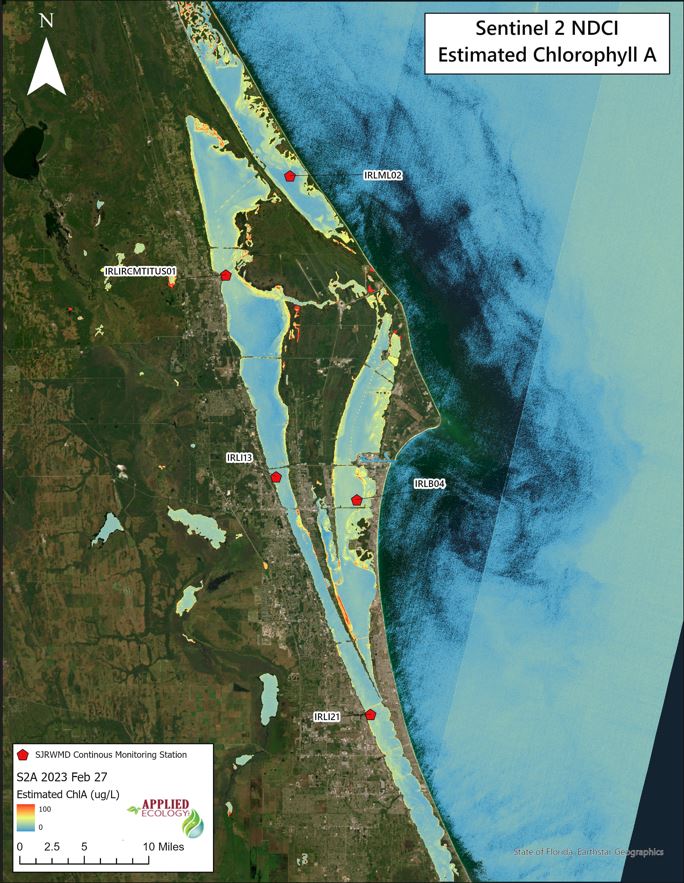
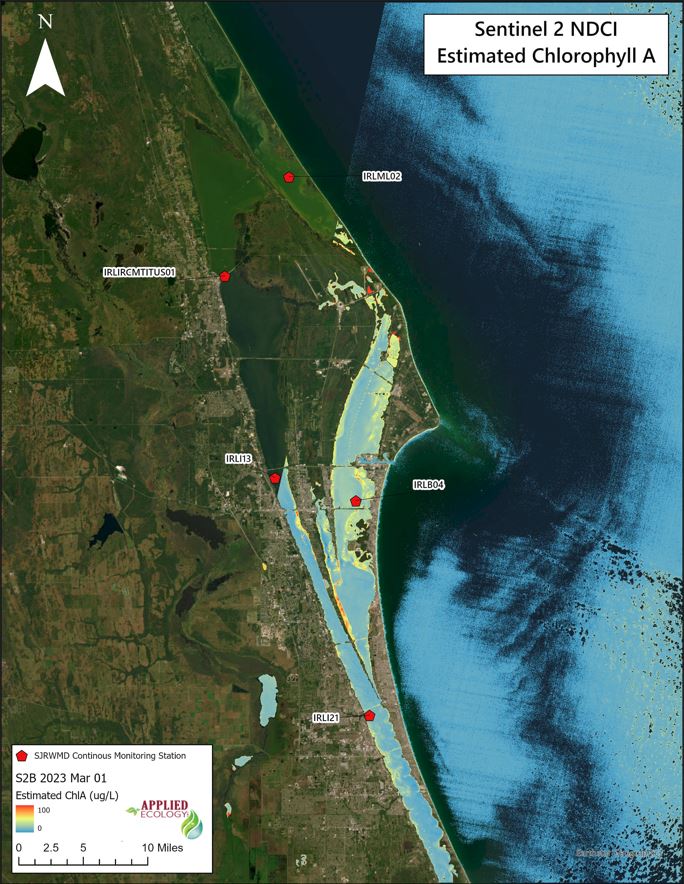
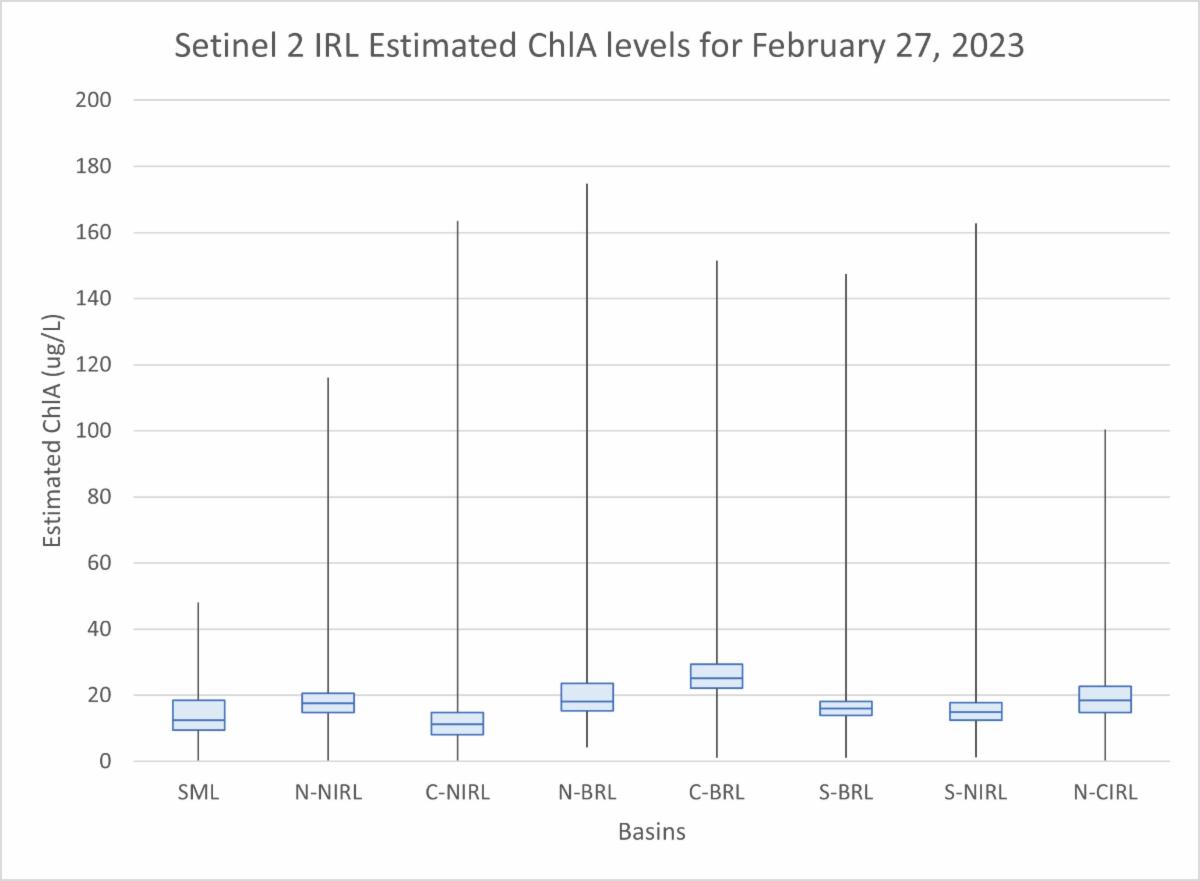
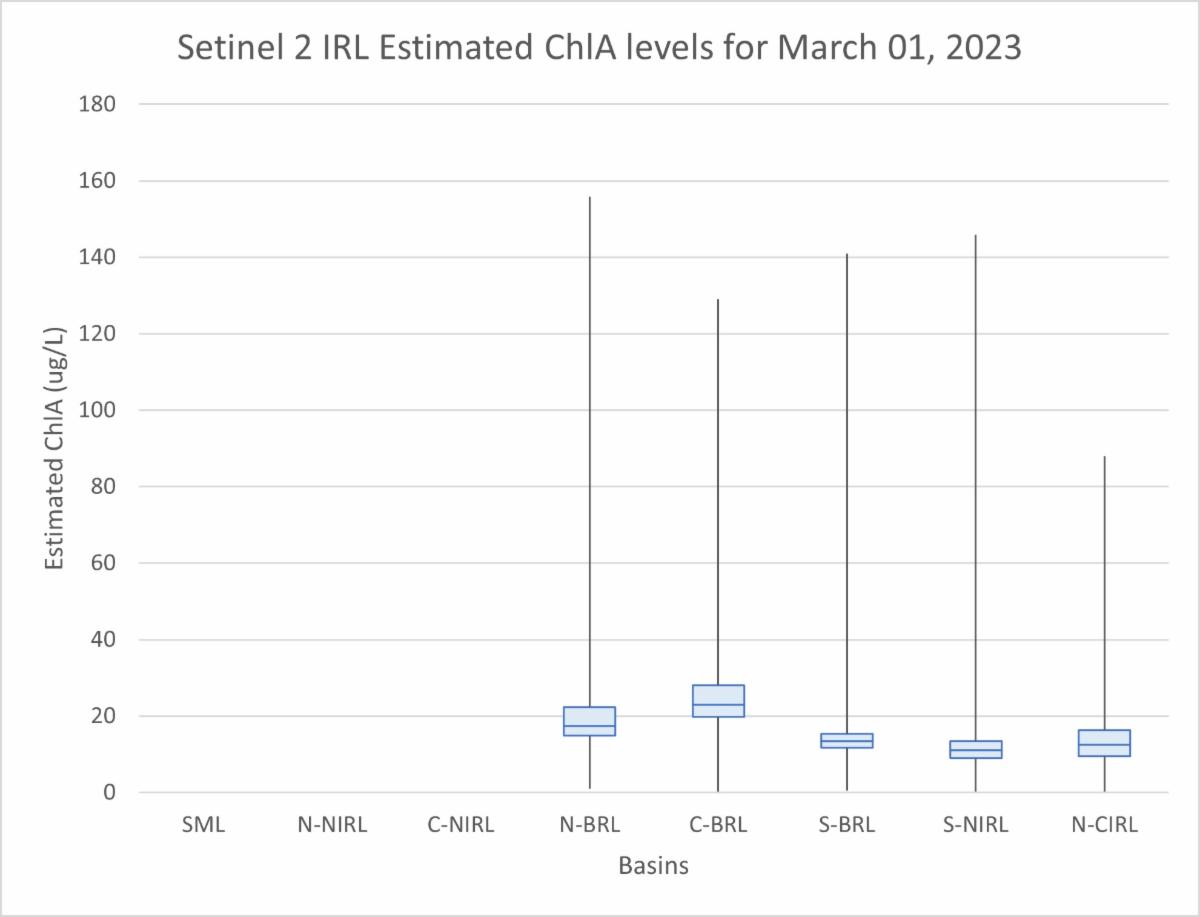
Two scenes from Sentinel 2 were usable for detection of HAB activity from February 27th, 2023, to March 5th, 2023. The following analysis focused on the scenes from February 27th and March 1st. Data from the Southern Mosquito Lagoon, Northern-North IRL, and Central-North IRL were not available on March 1st. (Figure 1, Figure 2) | |
Figure 1 - Sentinel 2 estimated Chlorophyll A (ChlA) Levels in Micrograms/Liter (µg/L) for February 27, 2023, over sections of the Mosquito Lagoon (ML), Indian River Lagoon (IRL), and Banana River (BR). The box plot represents the range of estimated ChlA values for each Basin, with the boxes showing the second quartile, median, and third quartile, and the whiskers representing the first and fourth quartiles. | |
Figure 2 - Sentinel 2 estimated Chlorophyll A (ChlA) Levels in Micrograms/Liter (µg/L) for March 1, 2023, over sections of the Mosquito Lagoon (ML), Indian River Lagoon (IRL), and Banana River (BR). The box plot represents the range of estimated ChlA values for each Basin, with the boxes showing the second quartile, median, and third quartile, and the whiskers representing the first and fourth quartiles. | |
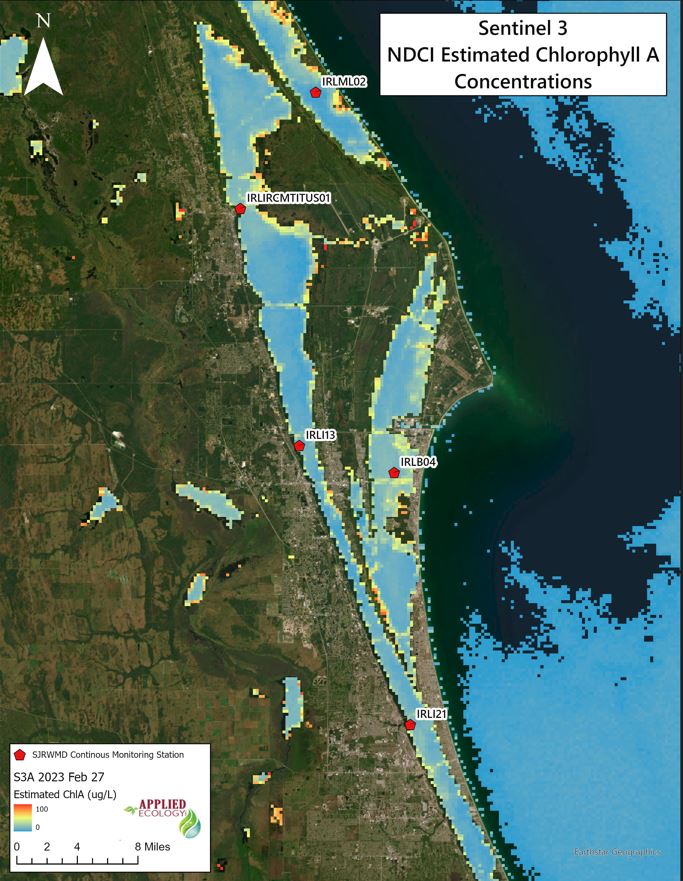
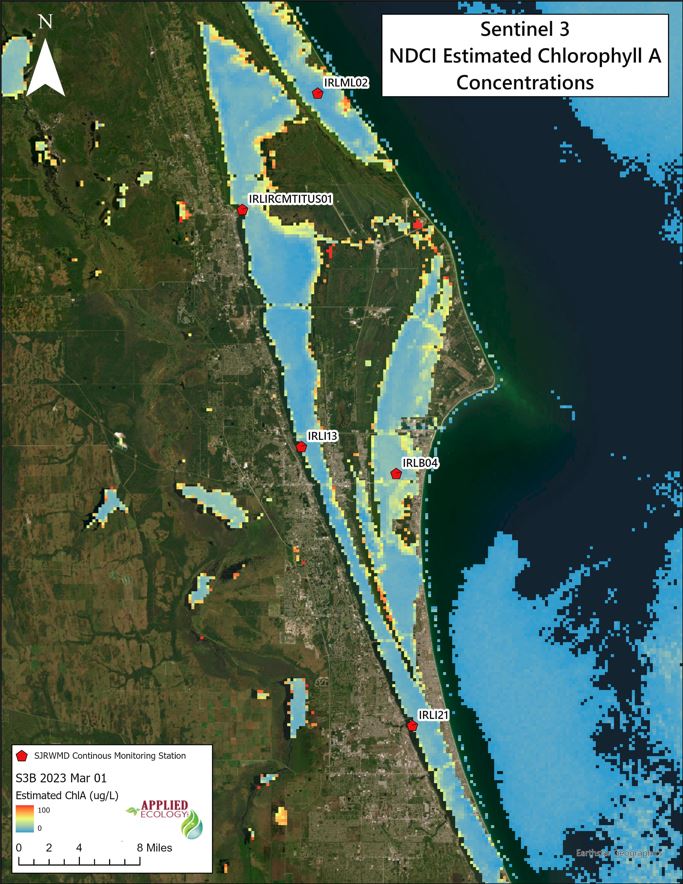
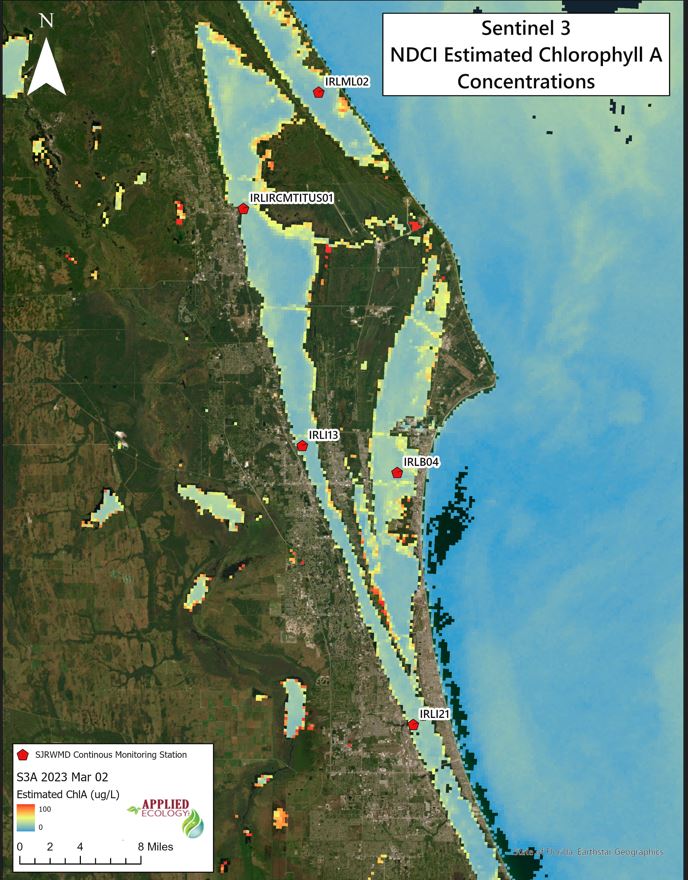
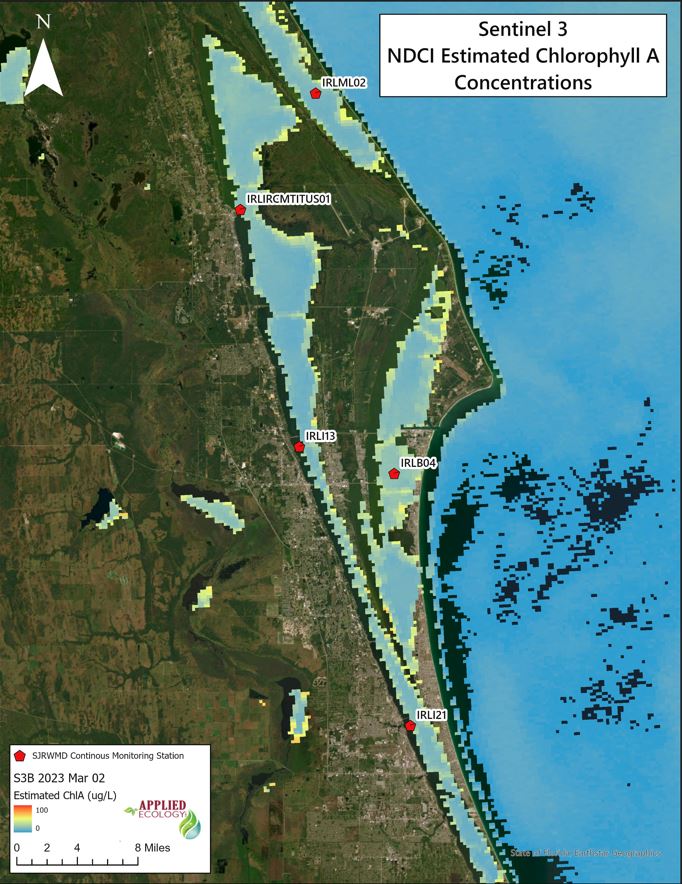
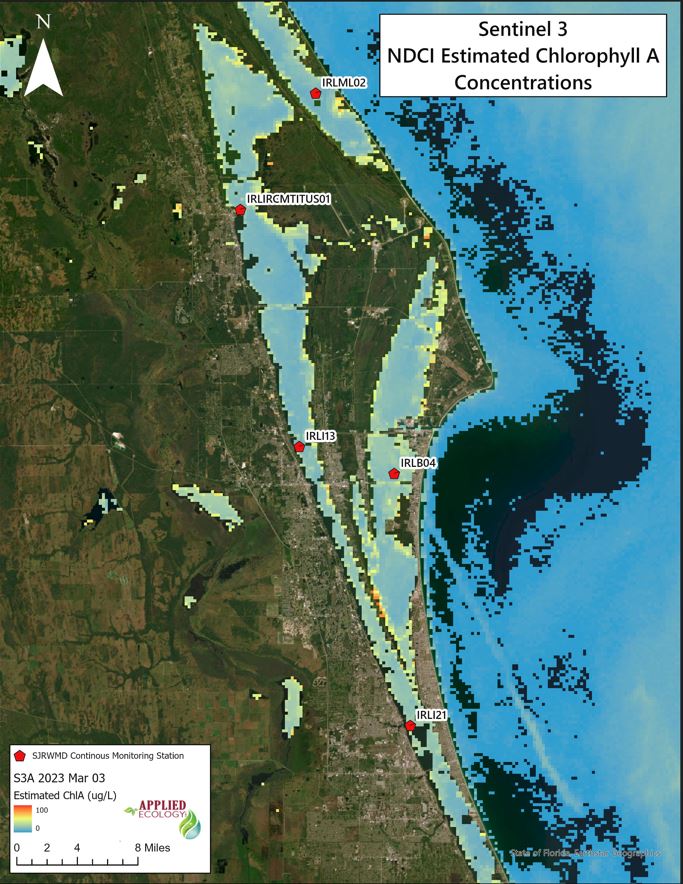
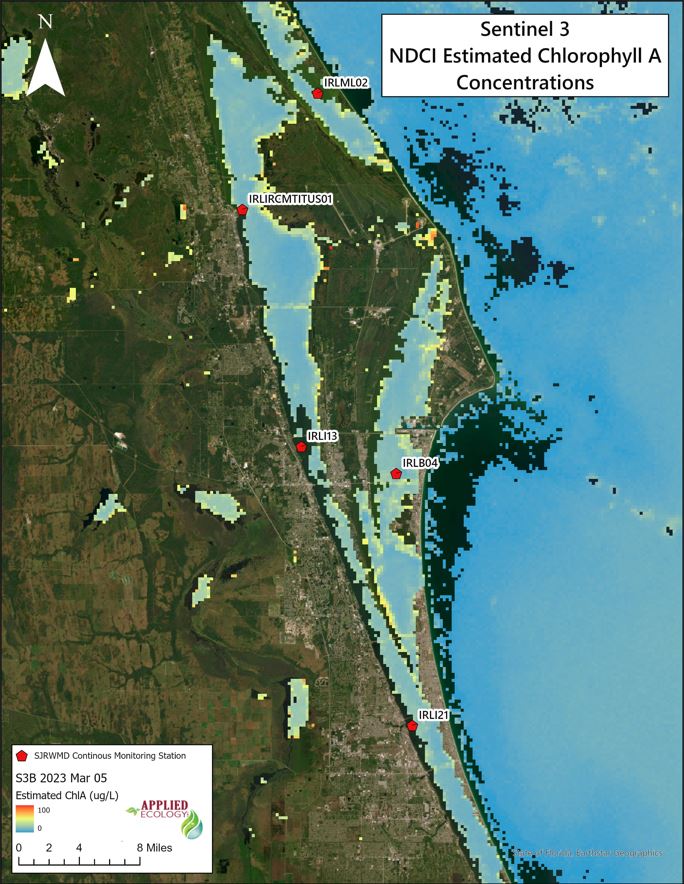
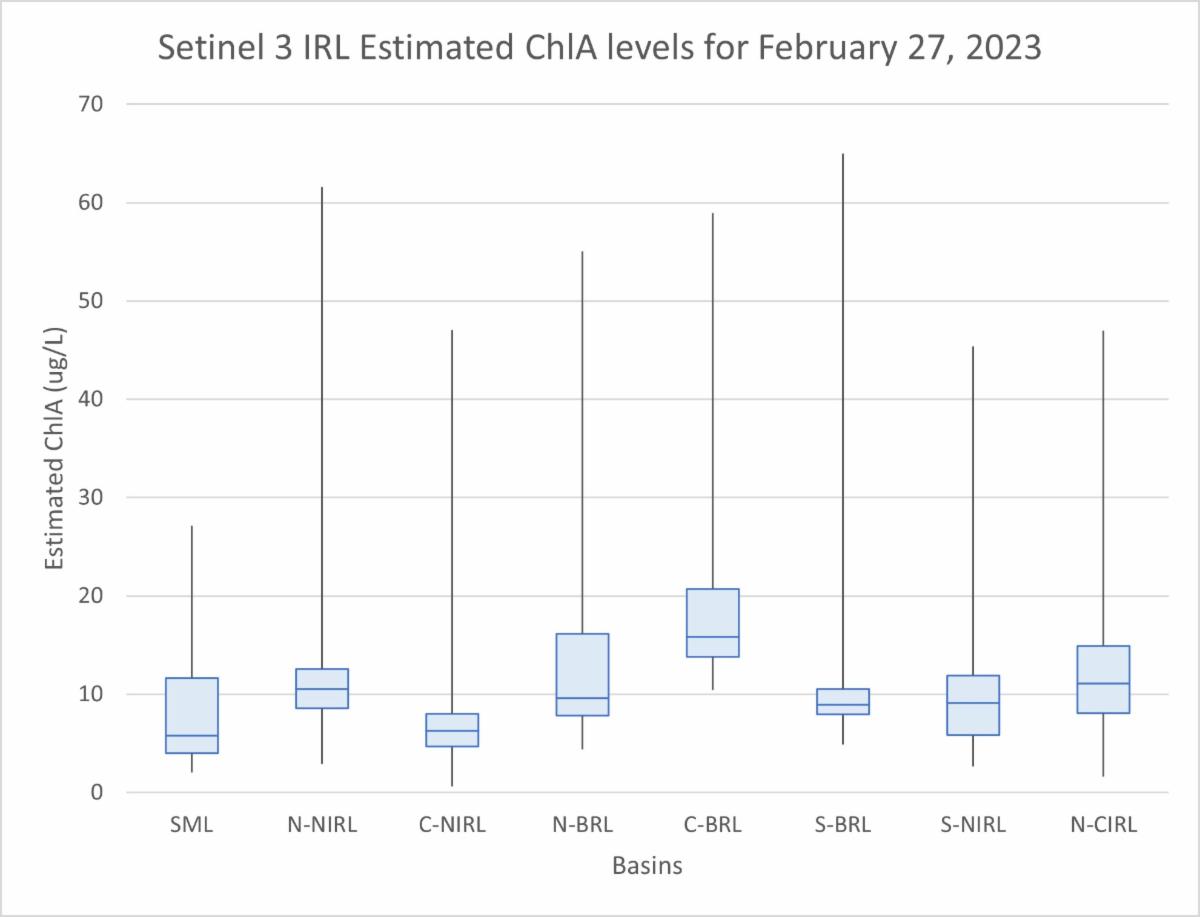
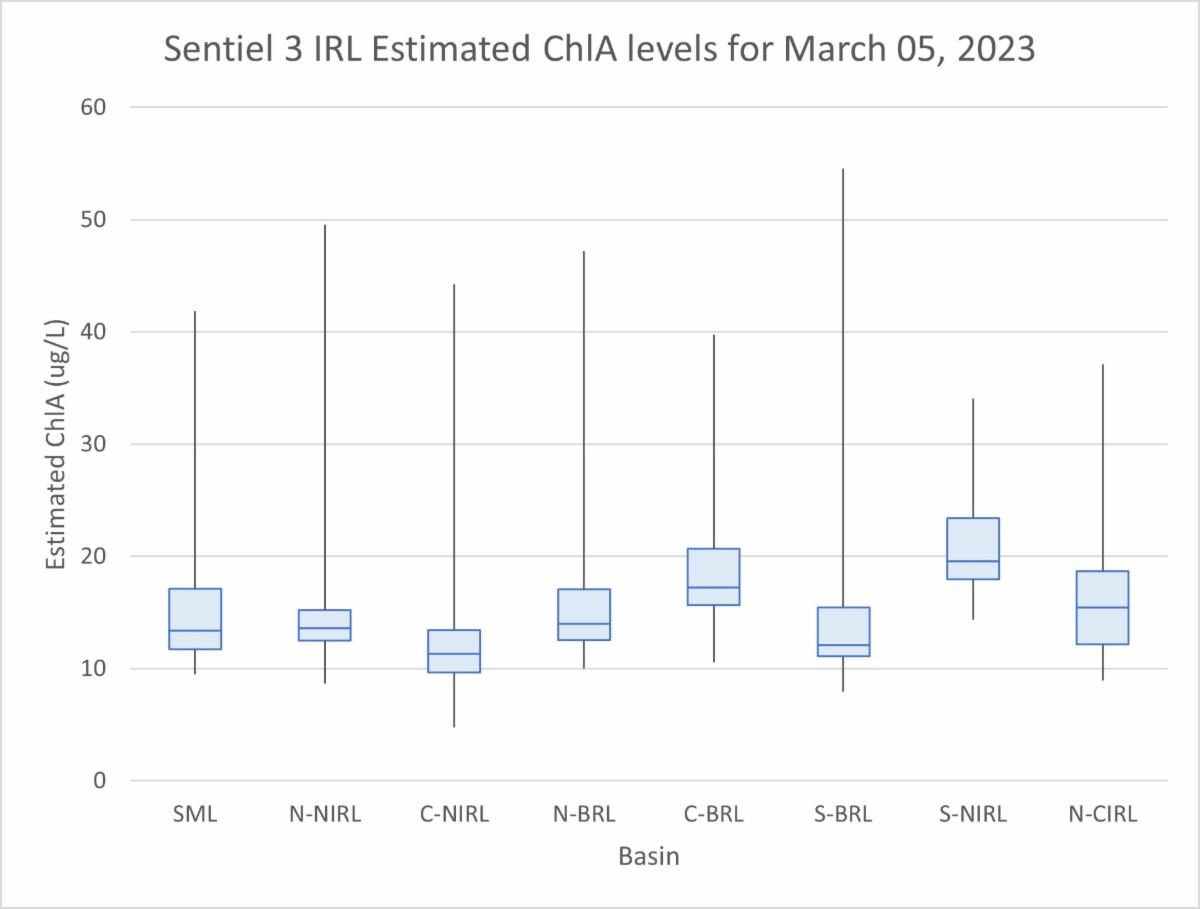
Six scenes from Sentinel 3 were usable for detection of HAB activity from February 27th, 2023, to March 5th, 2023. The following analysis focuses on the scenes from February 27th and March 5th (Figure 3, Figure 4). | |
Figure 3 - Sentinel 3 estimated Chlorophyll A (ChlA) Levels in Micrograms/Liter (µg/L) for February 27, 2023, over sections of the Mosquito Lagoon (ML), Indian River Lagoon (IRL), and Banana River (BR). The box plot represents the range of estimated ChlA values for each Basin, with the boxes showing the second quartile, median, and third quartile, and the whiskers representing the first and fourth quartiles. | |
Figure 4 - Sentinel 3 estimated Chlorophyll A (ChlA) Levels in Micrograms/Liter (µg/L) for March 5, 2023, over sections of the Mosquito Lagoon (ML), Indian River Lagoon (IRL), and Banana River (BR). The box plot represents the range of estimated ChlA values for each Basin, with the boxes showing the second quartile, median, and third quartile, and the whiskers representing the first and fourth quartiles. | |
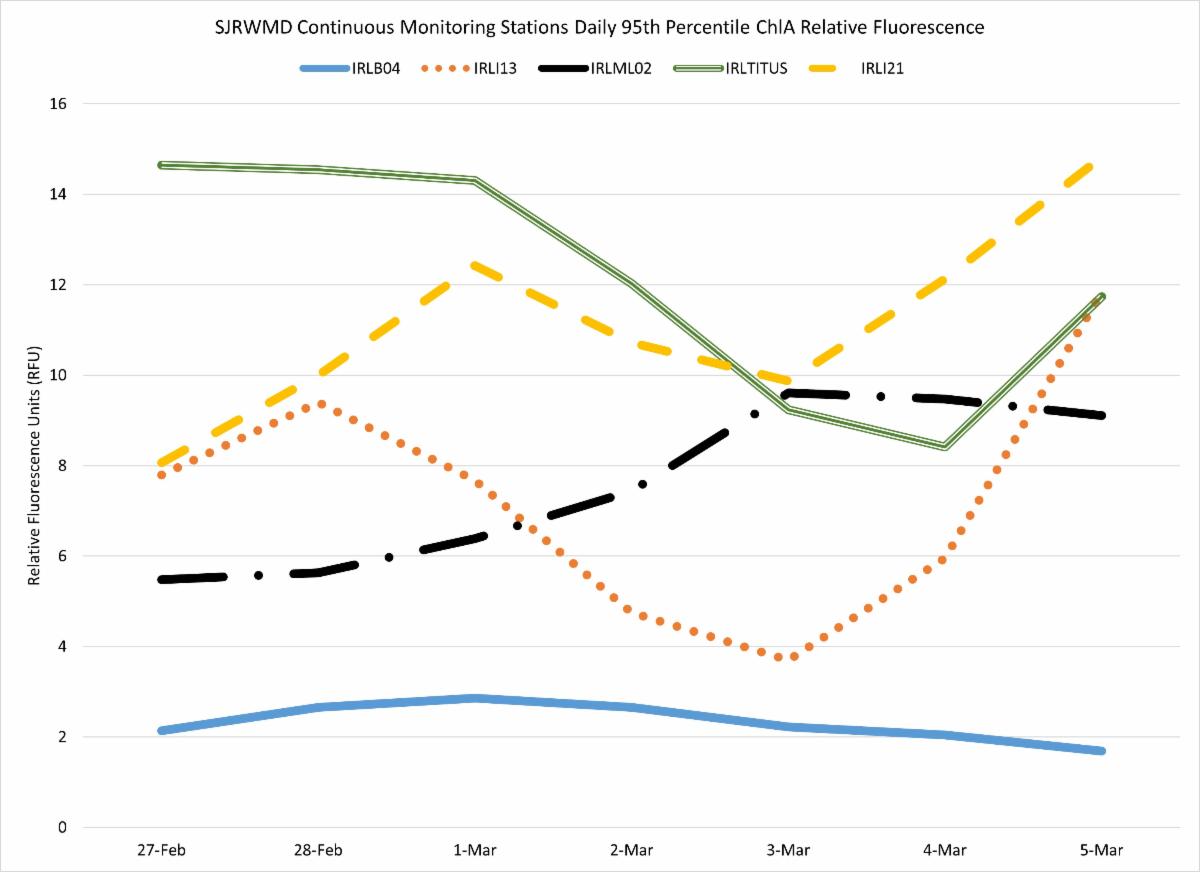
SJRWMD IRL Continuous Monitoring Stations | |
|
The St. John River Water Management District (SJRWMD) Continuous Monitoring (CM) stations measured generally stable Chlorophyll Reflective Fluorescence Units (RFU), with 3 of 5 stations experiencing an increase. (Figure 5, Table 3).
Current and historical data are added to the SJRWMD’s database continuously; subsequent visits may reflect such additions or revisions. SJRWMD provides no warranty as to the accuracy, reliability, or completeness of these data.
| |
Figure 5 - St Johns River Water Management District (SJRWMD) Indian River Lagoon Continuous Monitoring Station Relative Chlorophyll A (ChlA) readings from February 27th-March 5th, 2023, as described in Table 3. | |
Below are the estimated ChlA levels measured by SJRWMD continuous monitoring stations and Sentinel 3 within a radius of 0.75 miles (1.2 km) of the SJRWMD continuous monitoring stations for February 27th through March 5th. The Continuous Monitoring Station data is reported hourly by SJRWMD and this report provides the 95th percentile of RFU for a given day. | |
Table 3 - St Johns River Water Management District (SJRWMD) Indian River Lagoon Continuous Monitoring Station Relative Chlorophyll A (ChlA) Relative Fluorescence from February 27th-March 5th, 2023. | |
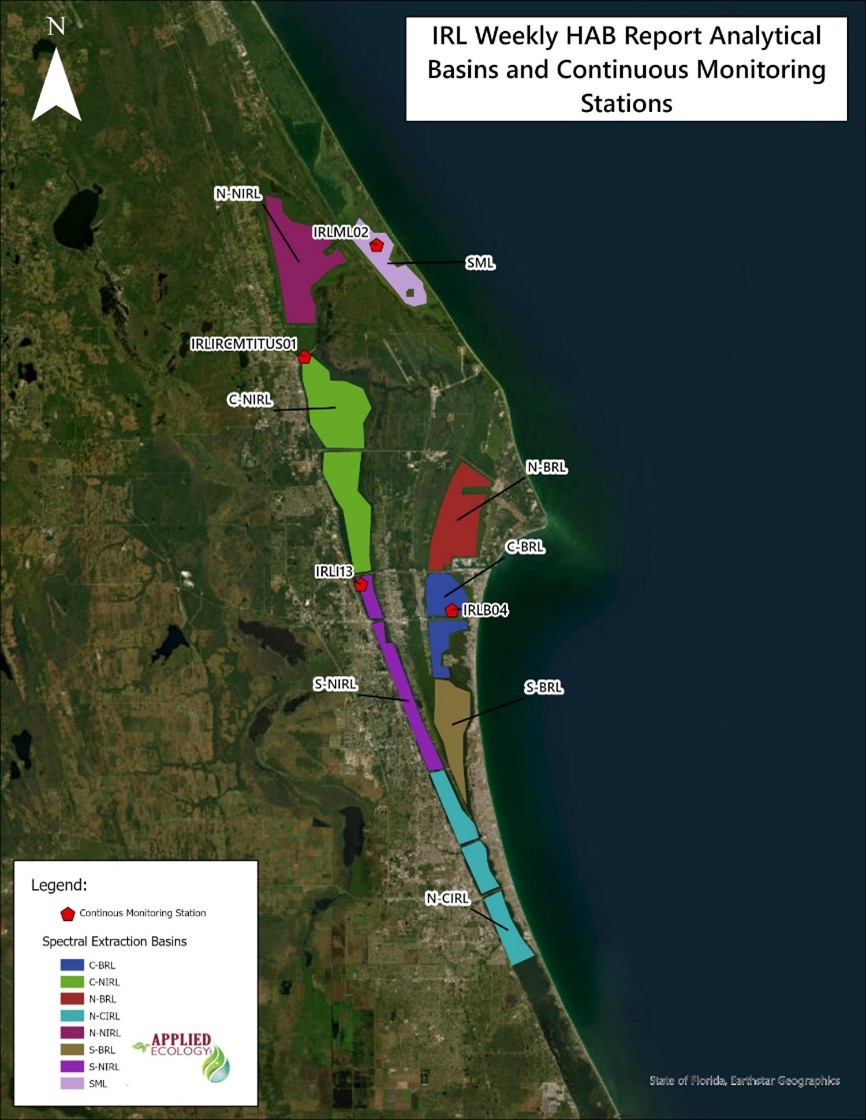
Figure 6. SJRWMD Continuous Monitoring stations and IRL Basins used for S2 and S3 analysis. | |
|
HAB’s observed by this project are defined as over 80 Micrograms/Liter (µg/L) Chlorophyll A (ChlA) (as estimated by a calibrated Normalized Difference Chlorophyll Index (NDCI)) and persistent across the week in review. The algorithms that transform the NDCI index value to estimated ChlA concentrations were developed using a second-order polynomial equation. The Sentinel 2 (S2) equation has a Root Square (R2) of 0.81 with a Root Mean Square Error (RMSE) of 14.14 ug/L of ChlA. The Sentinel 3 (S3) equation has an R2 of 0.92 and an RMSE of 9.92 ug/L ChlA. The RMSE is a measure of the accuracy of a model in estimating values, ChlA in this instance, where a lower value is indicative of higher accuracy. It does not identify if the model consistently over or underestimates the modeled values. The equations are below:
- S2 Estimated ChlA = 297.36(NDCI)2 + 313.98(NDCI) + 36.152
- S3 Estimated ChlA = 437.07(NDCI)2 + 348.98(NDCI) + 33.928
| | |
|
|
Want to look at a specific day or compare days over time? Our online HAB Viewer Tool will let you select days and even compare different days using the slider viewer tool.
Algae Bloom Viewer Tool
| | | | | |